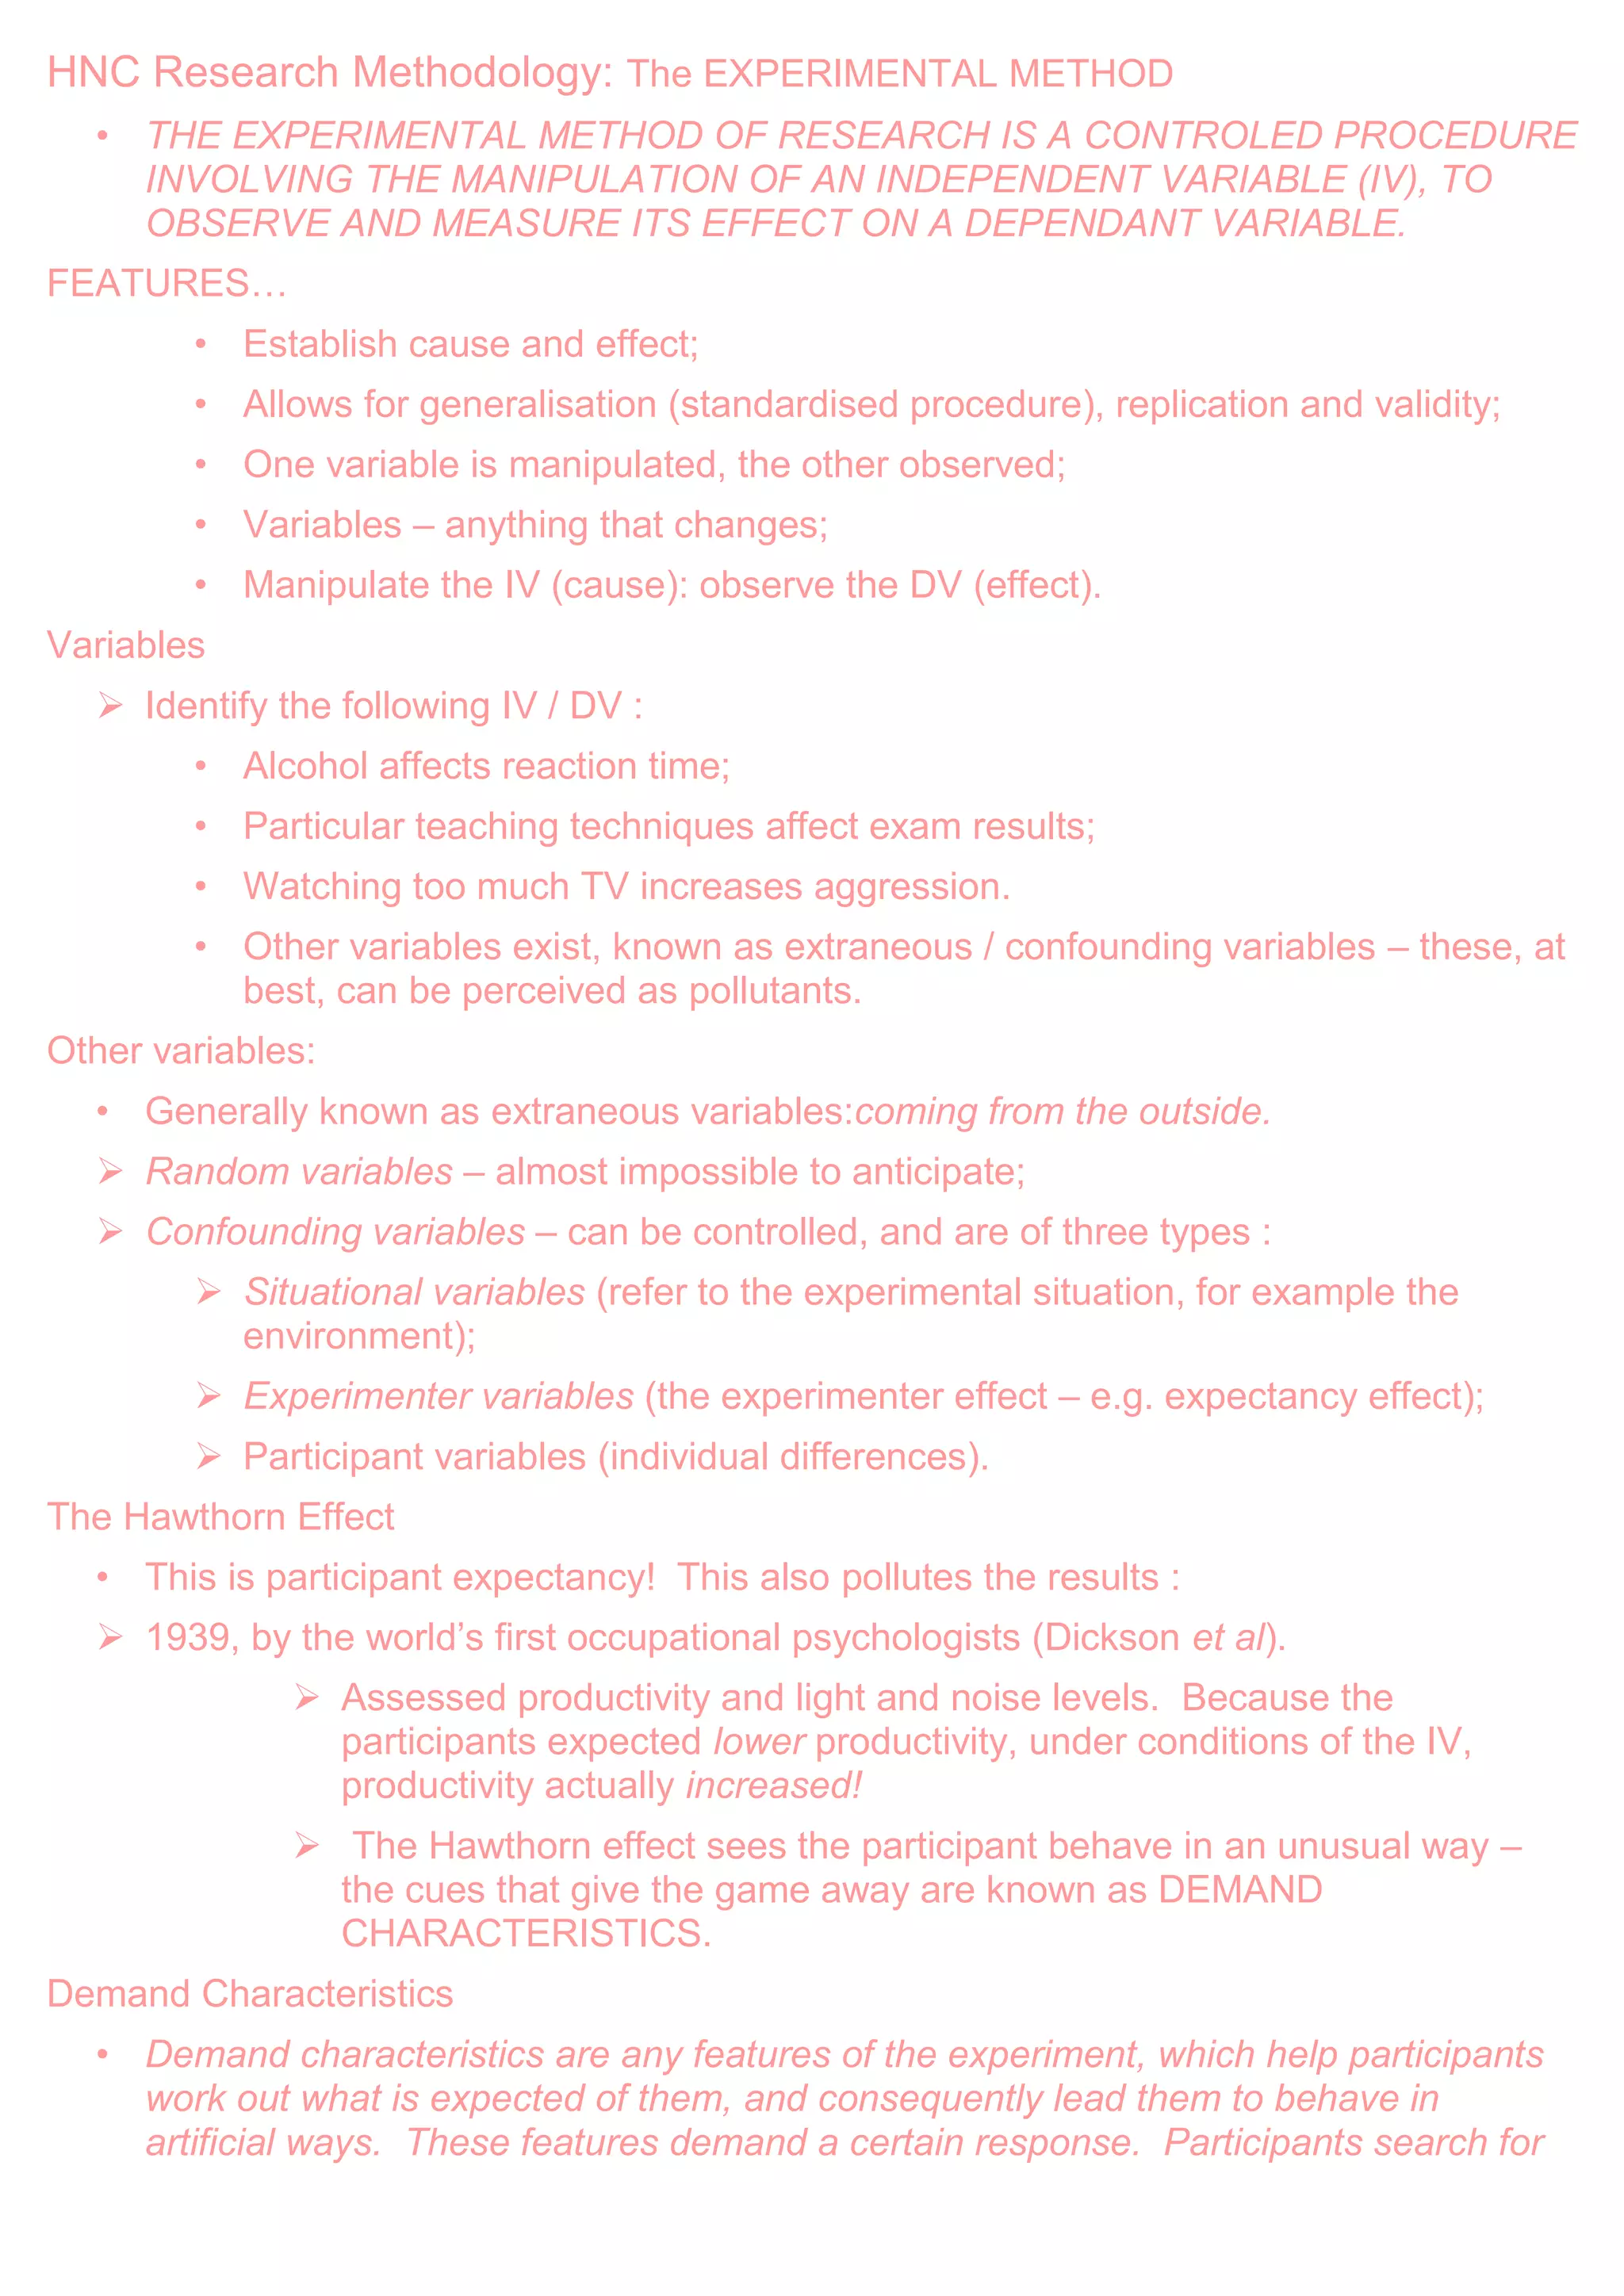
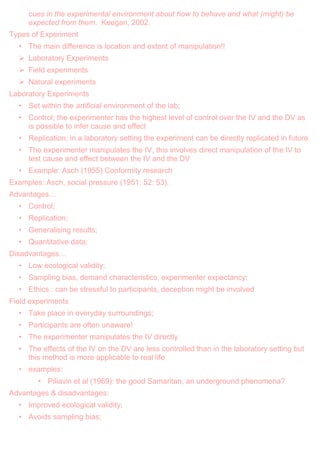
SlideShare a Scribd company logo
HNC Research Methodology: The EXPERIMENTAL METHOD
• THE EXPERIMENTAL METHOD OF RESEARCH IS A CONTROLED PROCEDURE
INVOLVING THE MANIPULATION OF AN INDEPENDENT VARIABLE (IV), TO
OBSERVE AND MEASURE ITS EFFECT ON A DEPENDANT VARIABLE.
FEATURES…
• Establish cause and effect;
• Allows for generalisation (standardised procedure), replication and validity;
• One variable is manipulated, the other observed;
• Variables – anything that changes;
• Manipulate the IV (cause): observe the DV (effect).
Variables
 Identify the following IV / DV :
• Alcohol affects reaction time;
• Particular teaching techniques affect exam results;
• Watching too much TV increases aggression.
• Other variables exist, known as extraneous / confounding variables – these, at
best, can be perceived as pollutants.
Other variables:
• Generally known as extraneous variables:coming from the outside.
 Random variables – almost impossible to anticipate;
 Confounding variables – can be controlled, and are of three types :
 Situational variables (refer to the experimental situation, for example the
environment);
 Experimenter variables (the experimenter effect – e.g. expectancy effect);
 Participant variables (individual differences).
The Hawthorn Effect
• This is participant expectancy! This also pollutes the results :
 1939, by the world‟s first occupational psychologists (Dickson et al).
 Assessed productivity and light and noise levels. Because the
participants expected lower productivity, under conditions of the IV,
productivity actually increased!
 The Hawthorn effect sees the participant behave in an unusual way –
the cues that give the game away are known as DEMAND
CHARACTERISTICS.
Demand Characteristics
• Demand characteristics are any features of the experiment, which help participants
work out what is expected of them, and consequently lead them to behave in
artificial ways. These features demand a certain response. Participants search for
cues in the experimental environment about how to behave and what (might) be
expected from them. Keegan, 2002.
Types of Experiment
• The main difference is location and extent of manipulation!!
 Laboratory Experiments
 Field experiments
 Natural experiments
Laboratory Experiments
• Set within the artificial environment of the lab;
• Control; the experimenter has the highest level of control over the IV and the DV as
is possible to infer cause and effect
• Replication; in a laboratory setting the experiment can be directly replicated in future
• The experimenter manipulates the IV, this involves direct manipulation of the IV to
test cause and effect between the IV and the DV
• Example: Asch (1955) Conformity research
Examples: Asch, social pressure (1951: 52: 53).
Advantages…
• Control;
• Replication;
• Generalising results;
• Quantitative data;
Disadvantages…
• Low ecological validity;
• Sampling bias, demand characteristics, experimenter expectancy;
• Ethics : can be stressful to participants, deception might be involved
Field experiments
• Take place in everyday surroundings;
• Participants are often unaware!
• The experimenter manipulates the IV directly
• The effects of the IV on the DV are less controlled than in the laboratory setting but
this method is more applicable to real life
• examples:
• Piliavin et al (1969): the good Samaritan, an underground phenomena?
Advantages & disadvantages:
• Improved ecological validity;
• Avoids sampling bias;
• Reduction in demand characteristics.
Disadvantages:
 Establishing control;
 Difficult to replicate;
 Ethics: consent, deception, privacy.
Natural experiments…
• No manipulation of IV! It is already in place.
• The experimenter does not interfere with the IV in this type of experiment, there is no
manipulation
• There is the least control over variables in this type of experiment, but it is very
applicable to real life as there is no interference from the experimenter
• Example: Oscar Lewis (1960s): Operation Head Start.
Advantages & disadvantages…
• Advantages
• Reduction in demand characteristics;
• Great ecological validity;
• No sample bias;
Disadvantages:
 Cause and effect difficult to establish between IV and DV;
 Little control, or replication;
 Ethics (privacy, consent, deception).
Experimental designs…
• Repeated Measures Design:
 The same participants are used in all conditions of the IV.
 Example: alcohol and reaction time.
 May produce order effects: fatigue, boredom, and prior practice leading to
better performance.
 Counterbalancing (swapping the order of conditions) will reduce this.
Independent Groups Design
• Different participants are exposed to different conditions of the IV – the researcher
will use different participants for each condition.
• Problem: subject variables (personal differences between the two, or more, groups).
• Costly and time consuming.
• Apply matched participants design.
Control group and experimental group…
• The control and experimental group undergo different conditions of the IV – take
alcohol…
THE EXPERIMENTAL HYPOTHESIS…
• A testable scientific prediction of cause and effect between an independent and
dependant variable.
• Two hypothesis –
 Experimental Hypothesis (or alternative): the IV will affect the DV ;
 Null Hypothesis: the IV will not affect the DV – if a result occurs, it is due to chance
factors.
One or two tailed?
• The experimental hypothesis can be :
 One tailed, ordirectional: predicts the direction of outcome: reduce, increase, lower,
etc.
 Two tailed, or non-directional: no predication of outcome; this hypothesis simply
states that the IV will affect the DV: changes, affects, influences, etc.
Probability and significance…
• Probability is the likelihood of an event happening: a night out without alcohol, etc.
• The like hood of results in a psychological experiment being due to chance factors
other than the manipulation of the IV, are expressed in terms of significance. Levels
of significance indicate the probability level (pvalue) of chance factors being the
cause of your result. P values are normally set at : p = 0.05 – this means there is a
one in twenty possibility of your results occurring due to chance factors, and not the
manipulation of the DV.
Participants, samples and populations…
• Participants – take part in research!
• Participants taken from a sample of the population;
• Results generalised to the target population, or population at large;
• Should obtain an unbiased sample: it should be representative!!
• Representative samples have the same characteristics as the population it was
drawn from!
Methods of Sampling…
• Opportunity sampling – the researcher will use anyone available at the time!!
• Self-selected sampling – advertisements.
• Imposed sampling – the participant had no choice!!
• Random sampling – every member of the population has an equal chance of
being selected.
• Systematic sampling – e.g. every 10th
person from a target population list. This
may involve asking every tenth person to complete a survey at a supermarket
checkout
• Quota sampling – the population is analysed and individuals are chosen in
order to ensure the sample has the same characteristics as the target or
general population in equal quantities. Gender is a good example – male and
female participants are used in equal proportions
The Scientific Approach: Terminology and key concepts
 Inductive – generalising to create laws so that they may be applied to the general
population.
 Deductive – producing theories from observations so that hypotheses may be
constructed and tested.
 Reliability – results that can be consistently found when the experiment is repeated.
 Validity - Measuring results to ensure accuracy – your research should be testing for
what you are actually measuring
 Ecological Validity – Whether Something is true to life (if the results can be applied
to real life situations)
 Scientific Validity – “Cause and effect” can be confidently concluded
 Quantitative data – Is any data in numerical form(can be quantified and statistically
analysed
 Qualitative data – In depth, detailed answer or summary
Common Sense and Research Methods: Features and Differences
Common Sense
Simple logic
Biased
General ignorance
Based on assumption, rumour and hearsay
Learned from those around you
Individual experience/opinions
Subjective (narrow minded)
Lacks validity and reliability
No attempt to substantiate its claims
Useful to the individual
Research Methods
Based on the scientific method
There to support hypotheses, theory and conclude phenomena
Unbiased
Validity and reliability
Objective (generalisation)
Systematic process to collect data
Recognised research methods
Empirical evidence
Useful to the social sciences
Research Methods
Survey
• The survey method of research asks a representative sample of people oral or
written questions to find out about their attitudes, behaviours, beliefs, opinions or
values. Gerard Keegan, Higher Psychology, 2002.
• Mostly used by social psychologists;
• Good design is imperative :
• Standardised instructions;
• Open (qualitative) and closed (quantitative) questions;
• Likert scales;
• Representative sample used (prevents response bias).
• Surveys can be done in person, by phone or by post.
• Quantitative data from closed and likert questions (categorical or numerical answers)
• Qualitative data from open questions (in-depth answers)
Advantages
• Large amounts of data in a short space of time ;
• Cheap ;
• Range of data: qualitative & quantitative.
• Good for future research.
Disadvantages
• No cause and effect conclusions ;
• Open questions – hard to quantify ;
• Closed questions – restrict creative answers;
• GIGO effect (garbage in, garbage out)
• Demand characteristics (social desirability bias)
• Researcher effects: ethnic origin, gender, body language.
An example
• Adorno (1950): researching prejudice behaviours.
• Adorno found authoritarian personalities to be more prejudice.
Interviews
A conversation with a purpose!”
• Verbal questionnaires ;
• One-to-one questioning ;
• Can be structured – pre-planned : un-structured – in - depth ; or semi – structured
(Clinical interview) ;
• Standardisation of structured interviews gives quantitative information (as
comparisons between participants can be made) ;
• Highly qualitative (particularly the unstructured interview) ;
Features
• The clinical interview: Piaget (conservation): some pre-set questions, but the
interviewer will ask spontaneous questions as a consequence of previous answers
(semi – structured!). Very flexible and sensitive to participants.
Advantages
• Very detailed data obtained ;
• Can be quantifiable (numerical), or qualitative (descriptive; high ecological validity) ;
• Structured interviews can be generalised.
Disadvantages
• Self-report by the interviewee is an un-scientific method of gathering data ;
• Cannot infer cause and effect relationship ;
• Inexperience and lack of training of interviewer can be anextraneous variable;
• Demand characteristics: interviewer effects.
Examples
• PSYCHOLOGY
• Hodges and Tizard (1989): longitudinal study: institutionalised and ex-
institutionalised children.
• Result: institutionalised children found it difficult to form attachments with others –
this impacted on their emotional, and social development.
• SOCIOLOGY
• Willis (1977) „Learning to Labour‟
OBSERVATION
• The observational method of research concerns the planned watching, recording,
and analysis of observed behaviour as it occurs
• It is a non-experimental method, cause and effect relationships cannot be
established
• Observation is a very useful method that can produce quantitative and qualitative
data depending on how it is designed for use
• Observation can be used with other research methods within a multi-method
approach
There are five main types that we should concern ourselves with:
• Participant ( researcher joins the group and is involved with the participants, the
researcher might manipulate the situation in a covert or overt role)
• Non-participant (researcher does not join the group and does not get involved with
the participants, but observation is usually planned observation and recording)
• Natural observation (used within comparative psychology where the researcher
might be interested in natural behaviours within animal subjects, e.g. Lorenz)
• Structured observation – involve the planned watching and recording of behaviours
within the controlled environment of the laboratory
• Unstructured observation – unplanned and informal, observations take place in
natural environments and recorded on a casual basis
Features
• Qualitative (descriptive) and quantitative (numerical) information.
• Data always recorded: check lists ; video recordings.
• Can be covert or overt.
• Covert involves the researcher joining the group and being „undercover‟, often
pretending to be part of the group without the group‟s knowledge a researcher is
present
• Overt involves telling the group a researcher will be present but perhaps allowing the
group to think you are observing something other than what you are observing
Examples
• Participant : James Patrick (1960s) ; Rosehan (1973) ; Piliavin et al (1969); Willis
(1977)
• Non – participant: Ainsworth et al (1978): strange situations; Bandura Ross and
Ross (1961) aggression studies.
• Natural observations: Lorenz and Imprinting (1960s).
Advantages
• Establish relationships before experimentation ;
• Ecological validity (naturalistic, covert) ;
• Avoidance of observer effects (non-participant) ;
• Useful with ethological studies (of animals in habitats)
Disadvantages
• Ethics – lack of consent with covert studies;
• Ethics – confidentiality ;
• Observer effect ;
• Possible lack of objectivity (participant) ;
• Replication difficult ;
• Poor control over confounding variables.
CASE STUDIES
The case study method of research is a detailed, in-depth investigation of an individual (or
small group) with unique or interesting characteristics.
Features:
• Idiographic in nature;
• Involves many other methods of enquiry: case histories; interviews; questionnaires;
psychometric tests; diaries; observation; and experimental research.
• Two types: retrospective & longitudinal.
• Retrospective: recall of past events (Freud’s case studies of Anna O / Little Hans).
• Longitudinal : follow the same individual or group over an extended period of time
(BBC’s 7-Up, currently at age 56)
Advantages
• Large amounts of qualitative data ;
• High ecological validity ;
• Sensitive to the individual, and sensitive to issues concerning the individual.
Disadvantages
• Cannot generalise results ;
• Replication impossible, to confirm earlier results ;
• Reliability of information is self-report (subjective, inaccurate) ;
• Interviewer/observer bias ;
• Lack of scientific validity: no cause effect conclusions can be drawn.
Primary and Secondary sources of data
Primary
– These are data that you have collected first hand
– You carry out your own research in the laboratory or field (can be time
consuming and expensive)
– You set your own parameters, control your own variables and select your own
participants
Secondary
– Use of data that someone else has collected
– You use information you perhaps could not have collected first hand
– You save time and money over primary research but you accept existing
biases
– Desk based research
Primary sources of data
 The main primary sources of data are:
– Experiment
– Correlation
– Case study
– Observation
– Survey
Primary and Secondary sources of reading
 Primary
– Think autobiographies
– First-hand accounts written by people who were there
– Authentic and detailed but often highly subjective
– Invaluable insight into phenomena or events
 Secondary
– Think biographies
– Examination of primary sources by a more objective third party
– Evaluation and new understanding of primary sources
– Often collates a wide range of primary sources with a commentary to add
understanding and strengthen viewpoints
Qualitative and Quantitative data
 Qualitative
– Rich
– Insightful
– Verbal
– Time consuming
– Difficult to compare and contrast
 Quantitative
– Numbers
– Statistics
– Numerical analysis
– Graphical display
– Objective
– Can lack depth
Research and Methodology
Where do we start? The Research Process
 Start with a general aim (based on theory or prior research)
 Formulate a hypothesis (a specific statement to test)
 Test the Hypothesis
 Collect and collate the evidence
 Analyse the data
 Understand what the data mean
 Write up your findings
Main types of Research for Primary Data
 Experimental
– This is the most scientific method
– You change something and study the effect this has on something else
 Non-Experimental
– Correlation
– Case study
– Observation
– Survey
 Experiments can take place in one of three settings:
– Laboratory – very controlled, can be easy to replicate but low in ecological
validity
– Field – less control, more difficult to replicate but high in ecological validity
– Natural – researcher has no real control but very high in ecological validity,
and probably no other opportunity to study phenomena. Often taking
opportunity to study something otherwise unavailable to researchers
 Hypotheses
– Experimental (Sometimes called „Alternative‟) Hypothesis
– Null Hypothesis
 Before you carry out research, you make a statement to test.
 This is your Experimental (or Alternative) Hypothesis.
 It states that when you manipulate one variable it will have an effect on another.
 Experiment is the only method that can determine cause and effect - a causal
relationship (NB not „casual‟!)
 The Null Hypothesis states that there is no experimental effect.
 You will always have both hypotheses. One will be correct in that there will either be
an effect or not (although we‟ll come back to this when we look at directional
hypotheses)
 You can either predict the direction of change in a hypothesis or just say that there
will be an effect.
 1-tailed is when you predict direction
– (think – it will go that way)
 2-tailed is when you just predict effect
– (Think of the caterpillar in Alice in Wonderland – could go thisaway or could go
thataway!)
 Even if you find a cause and effect relationship between your variables the direction
could be wrong if you used a 1-tailed hypothesis
Ethics
 When you carry out research using human participants you must consider ethics. At
university level, research proposals go before an ethics committee for approval
before you start to carry out research.
 Key aspects include:
– Informed consent
– Deception
– Distress
– Confidentiality
– Right to Withdraw
 Informed Consent
– Participants should know what will be required of them (and what they are
letting themselves in for!)
 Deception
– Sometimes you need to hide the true purpose of the experiment until you have
finished. Where deception takes place there needs to be a clear debrief
 Distress
– Taking part in research should not cause any distress to a participant. There
should be no physical or psychological harm to participants.
 Confidentiality
– Participants should not be identified within the study. Participation and results
should be anonymous and confidential.
 Right to Withdraw
– Participants have a right to withdraw consent for their contribution to be used.
 Right to Withdraw
– Participants have a right to withdraw consent for their contribution to be used.
– They have the right to withdraw at any stage. This means they can change
their mind at the consent/briefing stage; during the experiment/study; after the
study has taken place (give a timeline, e.g. 2 weeks after they take part)
– Give clear guidelines as to how their contribution will be used and the last date
for withdrawal.
Sampling
 It is unlikely that you will undertake research with every potential participant. The aim
is usually to:
– Identify your target population (who you are interested in researching)
– identify a representative sample
– carry out research with this small group
– generalise the results back to the target population
 Identify your target population. This is the group of people you want to be able to talk
about.
 Your sample should represent your target population.
 Select your sample using an accepted technique:
– E.g. Random Sampling; Opportunity Sampling
 Carry out the research on your sample.
 Generalise your findings back to your target population.
 Random Sampling
 Opportunity/Convenience Sampling
 Self-selecting Sampling
 Realism - Ecological Validity
 Random Sampling
– This is effectively names out a hat. Every person has an equal chance of being
selected with every name drawn. Can use computers.
 Opportunity/Convenience Sampling
– Place yourself where you have access to your target population, e.g. football
crowd or college
 Self-selecting Sampling
– Ask for volunteers to take part in your research
Analysis and Presentation of Findings
 Before you carry out your research you need to know how you are going to make
sense of your results
 Analysing and Representing Findings: Quantitative Analysis
– Percentages
– Measures of Central Tendency
 Mean, Median, Mode
– Measure of dispersion
– Charts and Graphs
 Once you have carried out your research you need to find out what your results
mean. This involves calculations and presentations.
 Unusual results can be talked about in isolation but normally you will be talking
about the results as a whole. To do this, you will look at patterns, trends, differences
and similarities in the data.
Quantitative Analysis
 Measures of Central Tendency
– Mean (arithmetic average)
– Median (mid-point when ordered)
– Mode (most frequently occurring)
 Percentages
Quantitative Analysis: MMM
– Mean(arithmetic average)
Add up the scores then divide by the number of scores. This is the mean.
– Median (mid-point when ordered)
Put responses in ascending order and count in from each side to the middle score.
This is the median.
– Mode(most frequently occurring)
Find the score that occurs most frequently. This is the mode. (There may be a tie –
you can have one, two or even three modes, but no more!)
Quantitative Analysis: Range
 This is a measure of dispersion, or how spread out your scores are. Mean, Median
and Mode could all fall on the same score but one variable could have a small range
(all scores clustered tightly together) and another could be very spread out. Range
shows this spread.
 Range = (maximum score – minimum score) + 1
Quantitative Analysis: %
 As there can be different numbers of participants in different studies, or even within
different groups in the same study, it is helpful to consider what equivalent scores
are „per hundred‟ or per cent (%).
 E.g. to calculate the percentage of people scoring at a particular level or above:
count up how many participants are in this category, divide by the total number of
participants, (=), then multiply by 100. Round to the nearest whole number.
Presentation of Findings
 When you present findings you should label every graph or chart clearly. Make sure
it is clear what variables you are presenting.
 Always describe what the graph shows.
 Graphs and charts should display data in a visual and accessible way, otherwise you
would just talk about your findings.
Line Graph
– Used for continuous scores. Good to show trends and patterns.
Graph showing 2009 profits in yellow and 2010 profits in blue
Histogram/Histograph
– Each variable can be shown with a solid bar. Like a
line graph, it also needs a continuous scale on the x-axis. There is
arelationship between thebars – the scale is usually
increasingfrom left to right.
Bar Chart
– Each variable can be shown with a
solid bar. There is no relationship between
bars.
Pie Chart
– These can be calculated with degrees but there are pie-
chart templates that allow you to use percentages (much easier!)
 When you present a correlation graphically you would use a scatter graph.
 Make sure you label both axes clearly.

More Related Content

Similar to Hnc research methodology

Research methods in industrial and organizational psychology
Research methods in industrial and organizational psychologyResearch methods in industrial and organizational psychology
Research methods in industrial and organizational psychology
Seta Wicaksana
 
Research design
Research designResearch design
Research design
RajaKrishnan M
 
Scientific research in psychology
Scientific research in psychologyScientific research in psychology
Scientific research in psychology
Rahul singroha
 
Research methods revision 2015
Research methods revision 2015Research methods revision 2015
Research methods revision 2015
coburgpsych
 
Research methodology
Research methodology Research methodology
Research methodology
ANCYBS
 
TSLB3143 Topic 1c Experimental Research
TSLB3143 Topic 1c Experimental ResearchTSLB3143 Topic 1c Experimental Research
TSLB3143 Topic 1c Experimental Research
Yee Bee Choo
 
Aqa research methods 1
Aqa research methods 1Aqa research methods 1
Aqa research methods 1
traceperfection
 
day1.week22010.ppt
day1.week22010.pptday1.week22010.ppt
day1.week22010.ppt
kait23
 
TSL3133 Topic 3 Introduction to Various Types of Educational Research Design
TSL3133 Topic 3 Introduction to Various Types of Educational Research DesignTSL3133 Topic 3 Introduction to Various Types of Educational Research Design
TSL3133 Topic 3 Introduction to Various Types of Educational Research Design
Yee Bee Choo
 
STUDY DESIGNS.ppt
STUDY DESIGNS.pptSTUDY DESIGNS.ppt
STUDY DESIGNS.ppt
Mkindi Mkindi
 
Ch07 Experimental & Quasi-Experimental Designs
Ch07 Experimental & Quasi-Experimental DesignsCh07 Experimental & Quasi-Experimental Designs
Ch07 Experimental & Quasi-Experimental Designs
yxl007
 
Quick introduction to critical appraisal of quantitative research
Quick introduction to critical appraisal of quantitative researchQuick introduction to critical appraisal of quantitative research
Quick introduction to critical appraisal of quantitative research
Alan Fricker
 
experimental research ppt
experimental research pptexperimental research ppt
experimental research ppt
Akinaw Wagari
 
Study design
Study designStudy design
Unit 2 Disha Research Methdology shdhmxu
Unit 2 Disha Research Methdology shdhmxuUnit 2 Disha Research Methdology shdhmxu
Unit 2 Disha Research Methdology shdhmxu
ameyjoshi69
 
Module5_Quantitative_.pptx
Module5_Quantitative_.pptxModule5_Quantitative_.pptx
Module5_Quantitative_.pptx
LEANNAMAETAPANGCO
 
Unit2appowerpointmethodsandstatistics 150924001242-lva1-app6892
Unit2appowerpointmethodsandstatistics 150924001242-lva1-app6892Unit2appowerpointmethodsandstatistics 150924001242-lva1-app6892
Unit2appowerpointmethodsandstatistics 150924001242-lva1-app6892
Cleophas Rwemera
 
Unit 2 ap power point methods and statistics
Unit 2 ap power point methods and statisticsUnit 2 ap power point methods and statistics
Unit 2 ap power point methods and statistics
MrTimBradley
 
EXPERIMENTAL RESEARCH DESIGN.pptx
EXPERIMENTAL RESEARCH DESIGN.pptxEXPERIMENTAL RESEARCH DESIGN.pptx
EXPERIMENTAL RESEARCH DESIGN.pptx
SabaJahan2
 

Similar to Hnc research methodology (20)

Research methods in industrial and organizational psychology
Research methods in industrial and organizational psychologyResearch methods in industrial and organizational psychology
Research methods in industrial and organizational psychology
 
Research design
Research designResearch design
Research design
 
Scientific research in psychology
Scientific research in psychologyScientific research in psychology
Scientific research in psychology
 
Research methods revision 2015
Research methods revision 2015Research methods revision 2015
Research methods revision 2015
 
Research methodology
Research methodology Research methodology
Research methodology
 
TSLB3143 Topic 1c Experimental Research
TSLB3143 Topic 1c Experimental ResearchTSLB3143 Topic 1c Experimental Research
TSLB3143 Topic 1c Experimental Research
 
Aqa research methods 1
Aqa research methods 1Aqa research methods 1
Aqa research methods 1
 
day1.week22010.ppt
day1.week22010.pptday1.week22010.ppt
day1.week22010.ppt
 
TSL3133 Topic 3 Introduction to Various Types of Educational Research Design
TSL3133 Topic 3 Introduction to Various Types of Educational Research DesignTSL3133 Topic 3 Introduction to Various Types of Educational Research Design
TSL3133 Topic 3 Introduction to Various Types of Educational Research Design
 
STUDY DESIGNS.ppt
STUDY DESIGNS.pptSTUDY DESIGNS.ppt
STUDY DESIGNS.ppt
 
Ch07 Experimental & Quasi-Experimental Designs
Ch07 Experimental & Quasi-Experimental DesignsCh07 Experimental & Quasi-Experimental Designs
Ch07 Experimental & Quasi-Experimental Designs
 
Quick introduction to critical appraisal of quantitative research
Quick introduction to critical appraisal of quantitative researchQuick introduction to critical appraisal of quantitative research
Quick introduction to critical appraisal of quantitative research
 
experimental research ppt
experimental research pptexperimental research ppt
experimental research ppt
 
Study design
Study designStudy design
Study design
 
Unit 2 Disha Research Methdology shdhmxu
Unit 2 Disha Research Methdology shdhmxuUnit 2 Disha Research Methdology shdhmxu
Unit 2 Disha Research Methdology shdhmxu
 
Module5_Quantitative_.pptx
Module5_Quantitative_.pptxModule5_Quantitative_.pptx
Module5_Quantitative_.pptx
 
Unit2appowerpointmethodsandstatistics 150924001242-lva1-app6892
Unit2appowerpointmethodsandstatistics 150924001242-lva1-app6892Unit2appowerpointmethodsandstatistics 150924001242-lva1-app6892
Unit2appowerpointmethodsandstatistics 150924001242-lva1-app6892
 
Unit 2 ap power point methods and statistics
Unit 2 ap power point methods and statisticsUnit 2 ap power point methods and statistics
Unit 2 ap power point methods and statistics
 
Module2
Module2Module2
Module2
 
EXPERIMENTAL RESEARCH DESIGN.pptx
EXPERIMENTAL RESEARCH DESIGN.pptxEXPERIMENTAL RESEARCH DESIGN.pptx
EXPERIMENTAL RESEARCH DESIGN.pptx
 

Recently uploaded

Ethnobotany and Ethnopharmacology ......
Ethnobotany and Ethnopharmacology ......Ethnobotany and Ethnopharmacology ......
Ethnobotany and Ethnopharmacology ......
Ashokrao Mane college of Pharmacy Peth-Vadgaon
 
Sha'Carri Richardson Presentation 202345
Sha'Carri Richardson Presentation 202345Sha'Carri Richardson Presentation 202345
Sha'Carri Richardson Presentation 202345
beazzy04
 
aaaaaaaaaaaaaaaaaaaaaaaaaaaaaaaaaaaaaaaaaaaaaaaaaaaaaaa
aaaaaaaaaaaaaaaaaaaaaaaaaaaaaaaaaaaaaaaaaaaaaaaaaaaaaaaaaaaaaaaaaaaaaaaaaaaaaaaaaaaaaaaaaaaaaaaaaaaaaaaaaaaaaa
aaaaaaaaaaaaaaaaaaaaaaaaaaaaaaaaaaaaaaaaaaaaaaaaaaaaaaa
siemaillard
 
Thesis Statement for students diagnonsed withADHD.ppt
Thesis Statement for students diagnonsed withADHD.pptThesis Statement for students diagnonsed withADHD.ppt
Thesis Statement for students diagnonsed withADHD.ppt
EverAndrsGuerraGuerr
 
CLASS 11 CBSE B.St Project AIDS TO TRADE - INSURANCE
CLASS 11 CBSE B.St Project AIDS TO TRADE - INSURANCECLASS 11 CBSE B.St Project AIDS TO TRADE - INSURANCE
CLASS 11 CBSE B.St Project AIDS TO TRADE - INSURANCE
BhavyaRajput3
 
How to Create Map Views in the Odoo 17 ERP
How to Create Map Views in the Odoo 17 ERPHow to Create Map Views in the Odoo 17 ERP
How to Create Map Views in the Odoo 17 ERP
Celine George
 
The Challenger.pdf DNHS Official Publication
The Challenger.pdf DNHS Official PublicationThe Challenger.pdf DNHS Official Publication
The Challenger.pdf DNHS Official Publication
Delapenabediema
 
How libraries can support authors with open access requirements for UKRI fund...
How libraries can support authors with open access requirements for UKRI fund...How libraries can support authors with open access requirements for UKRI fund...
How libraries can support authors with open access requirements for UKRI fund...
Jisc
 
Chapter 3 - Islamic Banking Products and Services.pptx
Chapter 3 - Islamic Banking Products and Services.pptxChapter 3 - Islamic Banking Products and Services.pptx
Chapter 3 - Islamic Banking Products and Services.pptx
Mohd Adib Abd Muin, Senior Lecturer at Universiti Utara Malaysia
 
Unit 2- Research Aptitude (UGC NET Paper I).pdf
Unit 2- Research Aptitude (UGC NET Paper I).pdfUnit 2- Research Aptitude (UGC NET Paper I).pdf
Unit 2- Research Aptitude (UGC NET Paper I).pdf
Thiyagu K
 
TESDA TM1 REVIEWER FOR NATIONAL ASSESSMENT WRITTEN AND ORAL QUESTIONS WITH A...
TESDA TM1 REVIEWER  FOR NATIONAL ASSESSMENT WRITTEN AND ORAL QUESTIONS WITH A...TESDA TM1 REVIEWER  FOR NATIONAL ASSESSMENT WRITTEN AND ORAL QUESTIONS WITH A...
TESDA TM1 REVIEWER FOR NATIONAL ASSESSMENT WRITTEN AND ORAL QUESTIONS WITH A...
EugeneSaldivar
 
Instructions for Submissions thorugh G- Classroom.pptx
Instructions for Submissions thorugh G- Classroom.pptxInstructions for Submissions thorugh G- Classroom.pptx
Instructions for Submissions thorugh G- Classroom.pptx
Jheel Barad
 
Welcome to TechSoup New Member Orientation and Q&A (May 2024).pdf
Welcome to TechSoup   New Member Orientation and Q&A (May 2024).pdfWelcome to TechSoup   New Member Orientation and Q&A (May 2024).pdf
Welcome to TechSoup New Member Orientation and Q&A (May 2024).pdf
TechSoup
 
Cambridge International AS A Level Biology Coursebook - EBook (MaryFosbery J...
Cambridge International AS  A Level Biology Coursebook - EBook (MaryFosbery J...Cambridge International AS  A Level Biology Coursebook - EBook (MaryFosbery J...
Cambridge International AS A Level Biology Coursebook - EBook (MaryFosbery J...
AzmatAli747758
 
The Roman Empire A Historical Colossus.pdf
The Roman Empire A Historical Colossus.pdfThe Roman Empire A Historical Colossus.pdf
The Roman Empire A Historical Colossus.pdf
kaushalkr1407
 
The French Revolution Class 9 Study Material pdf free download
The French Revolution Class 9 Study Material pdf free downloadThe French Revolution Class 9 Study Material pdf free download
The French Revolution Class 9 Study Material pdf free download
Vivekanand Anglo Vedic Academy
 
Template Jadual Bertugas Kelas (Boleh Edit)
Template Jadual Bertugas Kelas (Boleh Edit)Template Jadual Bertugas Kelas (Boleh Edit)
Template Jadual Bertugas Kelas (Boleh Edit)
rosedainty
 
How to Break the cycle of negative Thoughts
How to Break the cycle of negative ThoughtsHow to Break the cycle of negative Thoughts
How to Break the cycle of negative Thoughts
Col Mukteshwar Prasad
 
Fish and Chips - have they had their chips
Fish and Chips - have they had their chipsFish and Chips - have they had their chips
Fish and Chips - have they had their chips
GeoBlogs
 
Language Across the Curriculm LAC B.Ed.
Language Across the  Curriculm LAC B.Ed.Language Across the  Curriculm LAC B.Ed.
Language Across the Curriculm LAC B.Ed.
Atul Kumar Singh
 

Recently uploaded (20)

Ethnobotany and Ethnopharmacology ......
Ethnobotany and Ethnopharmacology ......Ethnobotany and Ethnopharmacology ......
Ethnobotany and Ethnopharmacology ......
 
Sha'Carri Richardson Presentation 202345
Sha'Carri Richardson Presentation 202345Sha'Carri Richardson Presentation 202345
Sha'Carri Richardson Presentation 202345
 
aaaaaaaaaaaaaaaaaaaaaaaaaaaaaaaaaaaaaaaaaaaaaaaaaaaaaaa
aaaaaaaaaaaaaaaaaaaaaaaaaaaaaaaaaaaaaaaaaaaaaaaaaaaaaaaaaaaaaaaaaaaaaaaaaaaaaaaaaaaaaaaaaaaaaaaaaaaaaaaaaaaaaa
aaaaaaaaaaaaaaaaaaaaaaaaaaaaaaaaaaaaaaaaaaaaaaaaaaaaaaa
 
Thesis Statement for students diagnonsed withADHD.ppt
Thesis Statement for students diagnonsed withADHD.pptThesis Statement for students diagnonsed withADHD.ppt
Thesis Statement for students diagnonsed withADHD.ppt
 
CLASS 11 CBSE B.St Project AIDS TO TRADE - INSURANCE
CLASS 11 CBSE B.St Project AIDS TO TRADE - INSURANCECLASS 11 CBSE B.St Project AIDS TO TRADE - INSURANCE
CLASS 11 CBSE B.St Project AIDS TO TRADE - INSURANCE
 
How to Create Map Views in the Odoo 17 ERP
How to Create Map Views in the Odoo 17 ERPHow to Create Map Views in the Odoo 17 ERP
How to Create Map Views in the Odoo 17 ERP
 
The Challenger.pdf DNHS Official Publication
The Challenger.pdf DNHS Official PublicationThe Challenger.pdf DNHS Official Publication
The Challenger.pdf DNHS Official Publication
 
How libraries can support authors with open access requirements for UKRI fund...
How libraries can support authors with open access requirements for UKRI fund...How libraries can support authors with open access requirements for UKRI fund...
How libraries can support authors with open access requirements for UKRI fund...
 
Chapter 3 - Islamic Banking Products and Services.pptx
Chapter 3 - Islamic Banking Products and Services.pptxChapter 3 - Islamic Banking Products and Services.pptx
Chapter 3 - Islamic Banking Products and Services.pptx
 
Unit 2- Research Aptitude (UGC NET Paper I).pdf
Unit 2- Research Aptitude (UGC NET Paper I).pdfUnit 2- Research Aptitude (UGC NET Paper I).pdf
Unit 2- Research Aptitude (UGC NET Paper I).pdf
 
TESDA TM1 REVIEWER FOR NATIONAL ASSESSMENT WRITTEN AND ORAL QUESTIONS WITH A...
TESDA TM1 REVIEWER  FOR NATIONAL ASSESSMENT WRITTEN AND ORAL QUESTIONS WITH A...TESDA TM1 REVIEWER  FOR NATIONAL ASSESSMENT WRITTEN AND ORAL QUESTIONS WITH A...
TESDA TM1 REVIEWER FOR NATIONAL ASSESSMENT WRITTEN AND ORAL QUESTIONS WITH A...
 
Instructions for Submissions thorugh G- Classroom.pptx
Instructions for Submissions thorugh G- Classroom.pptxInstructions for Submissions thorugh G- Classroom.pptx
Instructions for Submissions thorugh G- Classroom.pptx
 
Welcome to TechSoup New Member Orientation and Q&A (May 2024).pdf
Welcome to TechSoup   New Member Orientation and Q&A (May 2024).pdfWelcome to TechSoup   New Member Orientation and Q&A (May 2024).pdf
Welcome to TechSoup New Member Orientation and Q&A (May 2024).pdf
 
Cambridge International AS A Level Biology Coursebook - EBook (MaryFosbery J...
Cambridge International AS  A Level Biology Coursebook - EBook (MaryFosbery J...Cambridge International AS  A Level Biology Coursebook - EBook (MaryFosbery J...
Cambridge International AS A Level Biology Coursebook - EBook (MaryFosbery J...
 
The Roman Empire A Historical Colossus.pdf
The Roman Empire A Historical Colossus.pdfThe Roman Empire A Historical Colossus.pdf
The Roman Empire A Historical Colossus.pdf
 
The French Revolution Class 9 Study Material pdf free download
The French Revolution Class 9 Study Material pdf free downloadThe French Revolution Class 9 Study Material pdf free download
The French Revolution Class 9 Study Material pdf free download
 
Template Jadual Bertugas Kelas (Boleh Edit)
Template Jadual Bertugas Kelas (Boleh Edit)Template Jadual Bertugas Kelas (Boleh Edit)
Template Jadual Bertugas Kelas (Boleh Edit)
 
How to Break the cycle of negative Thoughts
How to Break the cycle of negative ThoughtsHow to Break the cycle of negative Thoughts
How to Break the cycle of negative Thoughts
 
Fish and Chips - have they had their chips
Fish and Chips - have they had their chipsFish and Chips - have they had their chips
Fish and Chips - have they had their chips
 
Language Across the Curriculm LAC B.Ed.
Language Across the  Curriculm LAC B.Ed.Language Across the  Curriculm LAC B.Ed.
Language Across the Curriculm LAC B.Ed.
 

Hnc research methodology

  • 1. HNC Research Methodology: The EXPERIMENTAL METHOD • THE EXPERIMENTAL METHOD OF RESEARCH IS A CONTROLED PROCEDURE INVOLVING THE MANIPULATION OF AN INDEPENDENT VARIABLE (IV), TO OBSERVE AND MEASURE ITS EFFECT ON A DEPENDANT VARIABLE. FEATURES… • Establish cause and effect; • Allows for generalisation (standardised procedure), replication and validity; • One variable is manipulated, the other observed; • Variables – anything that changes; • Manipulate the IV (cause): observe the DV (effect). Variables  Identify the following IV / DV : • Alcohol affects reaction time; • Particular teaching techniques affect exam results; • Watching too much TV increases aggression. • Other variables exist, known as extraneous / confounding variables – these, at best, can be perceived as pollutants. Other variables: • Generally known as extraneous variables:coming from the outside.  Random variables – almost impossible to anticipate;  Confounding variables – can be controlled, and are of three types :  Situational variables (refer to the experimental situation, for example the environment);  Experimenter variables (the experimenter effect – e.g. expectancy effect);  Participant variables (individual differences). The Hawthorn Effect • This is participant expectancy! This also pollutes the results :  1939, by the world‟s first occupational psychologists (Dickson et al).  Assessed productivity and light and noise levels. Because the participants expected lower productivity, under conditions of the IV, productivity actually increased!  The Hawthorn effect sees the participant behave in an unusual way – the cues that give the game away are known as DEMAND CHARACTERISTICS. Demand Characteristics • Demand characteristics are any features of the experiment, which help participants work out what is expected of them, and consequently lead them to behave in artificial ways. These features demand a certain response. Participants search for
  • 2. cues in the experimental environment about how to behave and what (might) be expected from them. Keegan, 2002. Types of Experiment • The main difference is location and extent of manipulation!!  Laboratory Experiments  Field experiments  Natural experiments Laboratory Experiments • Set within the artificial environment of the lab; • Control; the experimenter has the highest level of control over the IV and the DV as is possible to infer cause and effect • Replication; in a laboratory setting the experiment can be directly replicated in future • The experimenter manipulates the IV, this involves direct manipulation of the IV to test cause and effect between the IV and the DV • Example: Asch (1955) Conformity research Examples: Asch, social pressure (1951: 52: 53). Advantages… • Control; • Replication; • Generalising results; • Quantitative data; Disadvantages… • Low ecological validity; • Sampling bias, demand characteristics, experimenter expectancy; • Ethics : can be stressful to participants, deception might be involved Field experiments • Take place in everyday surroundings; • Participants are often unaware! • The experimenter manipulates the IV directly • The effects of the IV on the DV are less controlled than in the laboratory setting but this method is more applicable to real life • examples: • Piliavin et al (1969): the good Samaritan, an underground phenomena? Advantages & disadvantages: • Improved ecological validity; • Avoids sampling bias;
  • 3. • Reduction in demand characteristics. Disadvantages:  Establishing control;  Difficult to replicate;  Ethics: consent, deception, privacy. Natural experiments… • No manipulation of IV! It is already in place. • The experimenter does not interfere with the IV in this type of experiment, there is no manipulation • There is the least control over variables in this type of experiment, but it is very applicable to real life as there is no interference from the experimenter • Example: Oscar Lewis (1960s): Operation Head Start. Advantages & disadvantages… • Advantages • Reduction in demand characteristics; • Great ecological validity; • No sample bias; Disadvantages:  Cause and effect difficult to establish between IV and DV;  Little control, or replication;  Ethics (privacy, consent, deception). Experimental designs… • Repeated Measures Design:  The same participants are used in all conditions of the IV.  Example: alcohol and reaction time.  May produce order effects: fatigue, boredom, and prior practice leading to better performance.  Counterbalancing (swapping the order of conditions) will reduce this. Independent Groups Design • Different participants are exposed to different conditions of the IV – the researcher will use different participants for each condition. • Problem: subject variables (personal differences between the two, or more, groups). • Costly and time consuming. • Apply matched participants design. Control group and experimental group… • The control and experimental group undergo different conditions of the IV – take alcohol…
  • 4. THE EXPERIMENTAL HYPOTHESIS… • A testable scientific prediction of cause and effect between an independent and dependant variable. • Two hypothesis –  Experimental Hypothesis (or alternative): the IV will affect the DV ;  Null Hypothesis: the IV will not affect the DV – if a result occurs, it is due to chance factors. One or two tailed? • The experimental hypothesis can be :  One tailed, ordirectional: predicts the direction of outcome: reduce, increase, lower, etc.  Two tailed, or non-directional: no predication of outcome; this hypothesis simply states that the IV will affect the DV: changes, affects, influences, etc. Probability and significance… • Probability is the likelihood of an event happening: a night out without alcohol, etc. • The like hood of results in a psychological experiment being due to chance factors other than the manipulation of the IV, are expressed in terms of significance. Levels of significance indicate the probability level (pvalue) of chance factors being the cause of your result. P values are normally set at : p = 0.05 – this means there is a one in twenty possibility of your results occurring due to chance factors, and not the manipulation of the DV. Participants, samples and populations… • Participants – take part in research! • Participants taken from a sample of the population; • Results generalised to the target population, or population at large; • Should obtain an unbiased sample: it should be representative!! • Representative samples have the same characteristics as the population it was drawn from! Methods of Sampling… • Opportunity sampling – the researcher will use anyone available at the time!! • Self-selected sampling – advertisements. • Imposed sampling – the participant had no choice!! • Random sampling – every member of the population has an equal chance of being selected. • Systematic sampling – e.g. every 10th person from a target population list. This may involve asking every tenth person to complete a survey at a supermarket checkout • Quota sampling – the population is analysed and individuals are chosen in order to ensure the sample has the same characteristics as the target or
  • 5. general population in equal quantities. Gender is a good example – male and female participants are used in equal proportions The Scientific Approach: Terminology and key concepts  Inductive – generalising to create laws so that they may be applied to the general population.  Deductive – producing theories from observations so that hypotheses may be constructed and tested.  Reliability – results that can be consistently found when the experiment is repeated.  Validity - Measuring results to ensure accuracy – your research should be testing for what you are actually measuring  Ecological Validity – Whether Something is true to life (if the results can be applied to real life situations)  Scientific Validity – “Cause and effect” can be confidently concluded  Quantitative data – Is any data in numerical form(can be quantified and statistically analysed  Qualitative data – In depth, detailed answer or summary Common Sense and Research Methods: Features and Differences Common Sense Simple logic Biased General ignorance Based on assumption, rumour and hearsay Learned from those around you Individual experience/opinions Subjective (narrow minded) Lacks validity and reliability No attempt to substantiate its claims Useful to the individual Research Methods Based on the scientific method There to support hypotheses, theory and conclude phenomena Unbiased Validity and reliability Objective (generalisation) Systematic process to collect data Recognised research methods Empirical evidence Useful to the social sciences Research Methods Survey
  • 6. • The survey method of research asks a representative sample of people oral or written questions to find out about their attitudes, behaviours, beliefs, opinions or values. Gerard Keegan, Higher Psychology, 2002. • Mostly used by social psychologists; • Good design is imperative : • Standardised instructions; • Open (qualitative) and closed (quantitative) questions; • Likert scales; • Representative sample used (prevents response bias). • Surveys can be done in person, by phone or by post. • Quantitative data from closed and likert questions (categorical or numerical answers) • Qualitative data from open questions (in-depth answers) Advantages • Large amounts of data in a short space of time ; • Cheap ; • Range of data: qualitative & quantitative. • Good for future research. Disadvantages • No cause and effect conclusions ; • Open questions – hard to quantify ; • Closed questions – restrict creative answers; • GIGO effect (garbage in, garbage out) • Demand characteristics (social desirability bias) • Researcher effects: ethnic origin, gender, body language. An example • Adorno (1950): researching prejudice behaviours. • Adorno found authoritarian personalities to be more prejudice. Interviews A conversation with a purpose!” • Verbal questionnaires ; • One-to-one questioning ; • Can be structured – pre-planned : un-structured – in - depth ; or semi – structured (Clinical interview) ; • Standardisation of structured interviews gives quantitative information (as comparisons between participants can be made) ; • Highly qualitative (particularly the unstructured interview) ;
  • 7. Features • The clinical interview: Piaget (conservation): some pre-set questions, but the interviewer will ask spontaneous questions as a consequence of previous answers (semi – structured!). Very flexible and sensitive to participants. Advantages • Very detailed data obtained ; • Can be quantifiable (numerical), or qualitative (descriptive; high ecological validity) ; • Structured interviews can be generalised. Disadvantages • Self-report by the interviewee is an un-scientific method of gathering data ; • Cannot infer cause and effect relationship ; • Inexperience and lack of training of interviewer can be anextraneous variable; • Demand characteristics: interviewer effects. Examples • PSYCHOLOGY • Hodges and Tizard (1989): longitudinal study: institutionalised and ex- institutionalised children. • Result: institutionalised children found it difficult to form attachments with others – this impacted on their emotional, and social development. • SOCIOLOGY • Willis (1977) „Learning to Labour‟ OBSERVATION • The observational method of research concerns the planned watching, recording, and analysis of observed behaviour as it occurs • It is a non-experimental method, cause and effect relationships cannot be established • Observation is a very useful method that can produce quantitative and qualitative data depending on how it is designed for use • Observation can be used with other research methods within a multi-method approach There are five main types that we should concern ourselves with: • Participant ( researcher joins the group and is involved with the participants, the researcher might manipulate the situation in a covert or overt role) • Non-participant (researcher does not join the group and does not get involved with the participants, but observation is usually planned observation and recording) • Natural observation (used within comparative psychology where the researcher might be interested in natural behaviours within animal subjects, e.g. Lorenz)
  • 8. • Structured observation – involve the planned watching and recording of behaviours within the controlled environment of the laboratory • Unstructured observation – unplanned and informal, observations take place in natural environments and recorded on a casual basis Features • Qualitative (descriptive) and quantitative (numerical) information. • Data always recorded: check lists ; video recordings. • Can be covert or overt. • Covert involves the researcher joining the group and being „undercover‟, often pretending to be part of the group without the group‟s knowledge a researcher is present • Overt involves telling the group a researcher will be present but perhaps allowing the group to think you are observing something other than what you are observing Examples • Participant : James Patrick (1960s) ; Rosehan (1973) ; Piliavin et al (1969); Willis (1977) • Non – participant: Ainsworth et al (1978): strange situations; Bandura Ross and Ross (1961) aggression studies. • Natural observations: Lorenz and Imprinting (1960s). Advantages • Establish relationships before experimentation ; • Ecological validity (naturalistic, covert) ; • Avoidance of observer effects (non-participant) ; • Useful with ethological studies (of animals in habitats) Disadvantages • Ethics – lack of consent with covert studies; • Ethics – confidentiality ; • Observer effect ; • Possible lack of objectivity (participant) ; • Replication difficult ; • Poor control over confounding variables. CASE STUDIES The case study method of research is a detailed, in-depth investigation of an individual (or small group) with unique or interesting characteristics. Features: • Idiographic in nature; • Involves many other methods of enquiry: case histories; interviews; questionnaires; psychometric tests; diaries; observation; and experimental research.
  • 9. • Two types: retrospective & longitudinal. • Retrospective: recall of past events (Freud’s case studies of Anna O / Little Hans). • Longitudinal : follow the same individual or group over an extended period of time (BBC’s 7-Up, currently at age 56) Advantages • Large amounts of qualitative data ; • High ecological validity ; • Sensitive to the individual, and sensitive to issues concerning the individual. Disadvantages • Cannot generalise results ; • Replication impossible, to confirm earlier results ; • Reliability of information is self-report (subjective, inaccurate) ; • Interviewer/observer bias ; • Lack of scientific validity: no cause effect conclusions can be drawn. Primary and Secondary sources of data Primary – These are data that you have collected first hand – You carry out your own research in the laboratory or field (can be time consuming and expensive) – You set your own parameters, control your own variables and select your own participants Secondary – Use of data that someone else has collected – You use information you perhaps could not have collected first hand – You save time and money over primary research but you accept existing biases – Desk based research Primary sources of data  The main primary sources of data are: – Experiment – Correlation – Case study – Observation – Survey Primary and Secondary sources of reading  Primary
  • 10. – Think autobiographies – First-hand accounts written by people who were there – Authentic and detailed but often highly subjective – Invaluable insight into phenomena or events  Secondary – Think biographies – Examination of primary sources by a more objective third party – Evaluation and new understanding of primary sources – Often collates a wide range of primary sources with a commentary to add understanding and strengthen viewpoints Qualitative and Quantitative data  Qualitative – Rich – Insightful – Verbal – Time consuming – Difficult to compare and contrast  Quantitative – Numbers – Statistics – Numerical analysis – Graphical display – Objective – Can lack depth Research and Methodology Where do we start? The Research Process  Start with a general aim (based on theory or prior research)  Formulate a hypothesis (a specific statement to test)  Test the Hypothesis  Collect and collate the evidence  Analyse the data  Understand what the data mean  Write up your findings Main types of Research for Primary Data  Experimental
  • 11. – This is the most scientific method – You change something and study the effect this has on something else  Non-Experimental – Correlation – Case study – Observation – Survey  Experiments can take place in one of three settings: – Laboratory – very controlled, can be easy to replicate but low in ecological validity – Field – less control, more difficult to replicate but high in ecological validity – Natural – researcher has no real control but very high in ecological validity, and probably no other opportunity to study phenomena. Often taking opportunity to study something otherwise unavailable to researchers  Hypotheses – Experimental (Sometimes called „Alternative‟) Hypothesis – Null Hypothesis  Before you carry out research, you make a statement to test.  This is your Experimental (or Alternative) Hypothesis.  It states that when you manipulate one variable it will have an effect on another.  Experiment is the only method that can determine cause and effect - a causal relationship (NB not „casual‟!)  The Null Hypothesis states that there is no experimental effect.  You will always have both hypotheses. One will be correct in that there will either be an effect or not (although we‟ll come back to this when we look at directional hypotheses)  You can either predict the direction of change in a hypothesis or just say that there will be an effect.  1-tailed is when you predict direction – (think – it will go that way)  2-tailed is when you just predict effect – (Think of the caterpillar in Alice in Wonderland – could go thisaway or could go thataway!)  Even if you find a cause and effect relationship between your variables the direction could be wrong if you used a 1-tailed hypothesis Ethics
  • 12.  When you carry out research using human participants you must consider ethics. At university level, research proposals go before an ethics committee for approval before you start to carry out research.  Key aspects include: – Informed consent – Deception – Distress – Confidentiality – Right to Withdraw  Informed Consent – Participants should know what will be required of them (and what they are letting themselves in for!)  Deception – Sometimes you need to hide the true purpose of the experiment until you have finished. Where deception takes place there needs to be a clear debrief  Distress – Taking part in research should not cause any distress to a participant. There should be no physical or psychological harm to participants.  Confidentiality – Participants should not be identified within the study. Participation and results should be anonymous and confidential.  Right to Withdraw – Participants have a right to withdraw consent for their contribution to be used.  Right to Withdraw – Participants have a right to withdraw consent for their contribution to be used. – They have the right to withdraw at any stage. This means they can change their mind at the consent/briefing stage; during the experiment/study; after the study has taken place (give a timeline, e.g. 2 weeks after they take part) – Give clear guidelines as to how their contribution will be used and the last date for withdrawal. Sampling  It is unlikely that you will undertake research with every potential participant. The aim is usually to: – Identify your target population (who you are interested in researching) – identify a representative sample – carry out research with this small group – generalise the results back to the target population
  • 13.  Identify your target population. This is the group of people you want to be able to talk about.  Your sample should represent your target population.  Select your sample using an accepted technique: – E.g. Random Sampling; Opportunity Sampling  Carry out the research on your sample.  Generalise your findings back to your target population.  Random Sampling  Opportunity/Convenience Sampling  Self-selecting Sampling  Realism - Ecological Validity  Random Sampling – This is effectively names out a hat. Every person has an equal chance of being selected with every name drawn. Can use computers.  Opportunity/Convenience Sampling – Place yourself where you have access to your target population, e.g. football crowd or college  Self-selecting Sampling – Ask for volunteers to take part in your research Analysis and Presentation of Findings  Before you carry out your research you need to know how you are going to make sense of your results  Analysing and Representing Findings: Quantitative Analysis – Percentages – Measures of Central Tendency  Mean, Median, Mode – Measure of dispersion – Charts and Graphs  Once you have carried out your research you need to find out what your results mean. This involves calculations and presentations.  Unusual results can be talked about in isolation but normally you will be talking about the results as a whole. To do this, you will look at patterns, trends, differences and similarities in the data. Quantitative Analysis  Measures of Central Tendency – Mean (arithmetic average) – Median (mid-point when ordered)
  • 14. – Mode (most frequently occurring)  Percentages Quantitative Analysis: MMM – Mean(arithmetic average) Add up the scores then divide by the number of scores. This is the mean. – Median (mid-point when ordered) Put responses in ascending order and count in from each side to the middle score. This is the median. – Mode(most frequently occurring) Find the score that occurs most frequently. This is the mode. (There may be a tie – you can have one, two or even three modes, but no more!) Quantitative Analysis: Range  This is a measure of dispersion, or how spread out your scores are. Mean, Median and Mode could all fall on the same score but one variable could have a small range (all scores clustered tightly together) and another could be very spread out. Range shows this spread.  Range = (maximum score – minimum score) + 1 Quantitative Analysis: %  As there can be different numbers of participants in different studies, or even within different groups in the same study, it is helpful to consider what equivalent scores are „per hundred‟ or per cent (%).  E.g. to calculate the percentage of people scoring at a particular level or above: count up how many participants are in this category, divide by the total number of participants, (=), then multiply by 100. Round to the nearest whole number. Presentation of Findings  When you present findings you should label every graph or chart clearly. Make sure it is clear what variables you are presenting.  Always describe what the graph shows.  Graphs and charts should display data in a visual and accessible way, otherwise you would just talk about your findings. Line Graph – Used for continuous scores. Good to show trends and patterns. Graph showing 2009 profits in yellow and 2010 profits in blue
  • 15. Histogram/Histograph – Each variable can be shown with a solid bar. Like a line graph, it also needs a continuous scale on the x-axis. There is arelationship between thebars – the scale is usually increasingfrom left to right. Bar Chart – Each variable can be shown with a solid bar. There is no relationship between bars. Pie Chart – These can be calculated with degrees but there are pie- chart templates that allow you to use percentages (much easier!)  When you present a correlation graphically you would use a scatter graph.  Make sure you label both axes clearly.