APM Welcome, APM North West Network Conference, Synergies Across Sectors
Hypothesis Tests (outline)
1. Hypothesis Tests
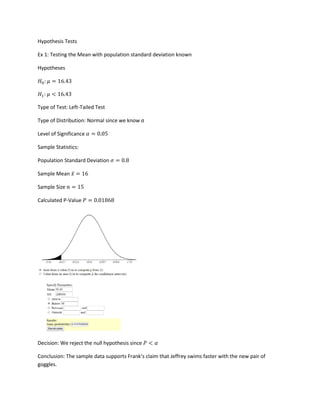
Ex 1: Testing the Mean with population standard deviation known
Hypotheses
𝐻0: 𝜇 = 16.43
𝐻1: 𝜇 < 16.43
Type of Test: Left-Tailed Test
Type of Distribution: Normal since we know σ
Level of Significance 𝛼 = 0.05
Sample Statistics:
Population Standard Deviation 𝜎 = 0.8
Sample Mean 𝑥̅ = 16
Sample Size 𝑛 = 15
Calculated P-Value 𝑃 = 0.01868
Decision: We reject the null hypothesis since 𝑃 < 𝛼
Conclusion: The sample data supports Frank’s claim that Jeffrey swims faster with the new pair of
goggles.
2. Ex 2: Testing the Mean with population standard deviation unknown
Hypotheses
𝐻0: 𝜇 = 65
𝐻1: 𝜇 > 65
Type of Test: Right-Tailed Test
Type of Distribution: t-Distribution since we don’t know σ
Level of Significance 𝛼 = 0.05
Sample Statistics:
Sample Standard Deviation 𝑠 = 3.19722
Sample Mean 𝑥̅ = 67
Sample Size 𝑛 = 10
Calculated P-Value 𝑃 = 0.0396
Decision: We reject the null hypothesis since 𝑃 < 𝛼
Conclusion: The sample data supports the instructor’s claim that the mean test score was greater than
65.
Ex 3: Testing the Proportion
Hypotheses
𝐻0: 𝑝 = 0.5
𝐻1: 𝑝 ≠ 0.5
3. Type of Test: Two-Tailed Test
Type of Distribution: Normal Distribution since it’s a proportion test with large sample size
Level of Significance 𝛼 = 0.01
Sample Statistics:
Sample Proportion 𝑝′ = 0.53
Sample Size 𝑛 = 100
Calculated P-Value 𝑃 = 0.5485
Decision: We fail to reject the null hypothesis since 𝑃 > 𝛼
Conclusion: The sample data fails to reject Joon’s claim that 50% of first-time brides in the U.S are
younger than their grooms.
This work is licensed under a Creative Commons Attribution 4.0 International License.