SlideShare a Scribd company logo
Methodology: Confidence Intervals for Mean and Proportion
Example 1: CI for the Mean (with summary statistics)
Suppose average pizza delivery times are normally distributed with an unknown population mean
and a population standard deviation of six minutes. A random sample of 28 pizza delivery
restaurants is taken and has a sample mean delivery time of 36 minutes.
Find a 90% confidence interval estimate for the population mean delivery time.
Step Discussion Example
Step 1: What is the
parameter?
Identify if you want to
estimate the mean or
proportion of the population
We want to estimate the
mean
Step 2: Are the requirements
met?
For the Mean you need a
random sample with
(a) or
(b) Population normal
with no outliers
The sample size is greater
than 30.
Step 3: What distribution
will you use?
If you know the population
standard deviation the use
the normal distribution,
otherwise use the t-
distribution.
We know the population
standard deviation so we
will use the normal
distribution.
Step 4: Identify the summary
statistics.
Find or calculate the sample
mean, standard deviation,
sample size and confidence
level.
̅
Step 5: Calculate Confidence
Interval
Use the formula or
technology to calculate the
confidence interval
TI-84:
STAT>TESTS>Z-Interval
Choose STATS
Excel:
z=-NORMSINV((1-C)/2)
̅
√
( )
Step 6: Interpret Confidence
Interval
Write a complete sentence
that includes the confidence
level, limits of interval, and
units of random variable.
We are 90% confident that
the mean pizza delivery time
is between 34.14 minutes
and 37.87 minutes.
Example 2: CI for the Mean (with sample data)
You do a study of hypnotherapy to determine how effective it is in increasing the number of hours
of sleep subjects get each night. You measure hours of sleep for 12 subjects with the following
results. Construct a 95% confidence interval for the mean number of hours slept for the population
(assumed normal) from which you took the data.
8.2; 9.1; 7.7; 8.6; 6.9; 11.2; 10.1; 9.9; 8.9; 9.2; 7.5; 10.5
Step Discussion Example
Step 1: What is the
parameter?
Identify if you want to
estimate the mean or
We want to estimate the
mean
proportion of the population
Step 2: Are the requirements
met?
For the Mean you need a
random sample with
(a) or
(b) Population normal
with no outliers
The population is normal.
Step 3: What distribution
will you use?
If you know the population
standard deviation the use
the normal distribution,
otherwise use the t-
distribution.
We do not know the
population standard
deviation so we will use the
t-distribution.
Step 4:Identify the summary
statistics.
Find or calculate the sample
mean, standard deviation,
sample size and confidence
level.
TI-84: STAT>EDIT
Enter Data in L1
̅
Step 5: Calculate Confidence
Interval
Use the formula or
technology to calculate the
confidence interval
TI-84:
STAT>TESTS>T-Interval
Choose DATA
Excel:
t=TINV(1-C)
̅
√
( )
Step 6: Interpret Confidence
Interval
Write a complete sentence
that includes the confidence
level, limits of interval, and
units of random variable.
We are 95% confident that
the mean amount of sleep
for patients undergoing
hypnotherapy is between
8.96 hours and 9.01 hours.
Example 3: CI for the Proportion
Suppose 250 randomly selected people are surveyed to determine if they own a tablet. Of the 250
surveyed, 98 reported owning a tablet. Using a 95% confidence level, compute a confidence interval
estimate for the true proportion of people who own tablets.
Step Discussion Example
Step 1: What is the
parameter?
Identify if you want to
estimate the mean or
proportion of the population
We want to estimate the
proportion
Step 2: Are the requirements
met?
For the proportion you need
a random sample with
(a) ( ) and
(b)
( )
Step 3: What distribution
will you use?
If the sample size is
sufficiently large then the
We will use the normal
distribution.
normal distribution
approximates the binomial
distribution quite well.
Step 4:Identify the summary
statistics.
Find or calculate the sample
proportion, sample size and
confidence level.
Step 5: Calculate Confidence
Interval
Use the formula or
technology to calculate the
confidence interval
TI-84:
STAT>TESTS>1-
PropZInterval
Excel:
z=-NORMSINV((1-C)/2)
√
( )
( )
Step 6: Interpret Confidence
Interval
Write a complete sentence
that includes the confidence
level, limits of interval, and
units of random variable.
We are 95% confident that
the proportion of people
who own tablets between
33% and 45%

More Related Content

Similar to Confidence Interval for Mean and Proportion (Methodology)

Chapter 7 – Confidence Intervals And Sample Size
Chapter 7 – Confidence Intervals And Sample SizeChapter 7 – Confidence Intervals And Sample Size
Chapter 7 – Confidence Intervals And Sample Sizeguest3720ca
 
Sample size determination
Sample size determinationSample size determination
Sample size determination
Augustine Gatimu
 
Section 7 Analyzing our Marketing Test, Survey Results .docx
Section 7 Analyzing our Marketing Test, Survey Results .docxSection 7 Analyzing our Marketing Test, Survey Results .docx
Section 7 Analyzing our Marketing Test, Survey Results .docx
kenjordan97598
 
Sample size calculation
Sample size calculationSample size calculation
Sample size calculation
Santam Chakraborty
 
Chapter09
Chapter09Chapter09
Chapter09rwmiller
 
Chapter 8
Chapter 8Chapter 8
Chapter 8
MaryWall14
 
Lesson04_Static11
Lesson04_Static11Lesson04_Static11
Lesson04_Static11thangv
 
GROUP 1 biostatistics ,sample size and epid.pptx
GROUP 1 biostatistics ,sample size and epid.pptxGROUP 1 biostatistics ,sample size and epid.pptx
GROUP 1 biostatistics ,sample size and epid.pptx
Emma910932
 
Lesson04_new
Lesson04_newLesson04_new
Lesson04_newshengvn
 
Probability Distributions
Probability DistributionsProbability Distributions
Probability DistributionsHarish Lunani
 
Confidence Intervals in the Life Sciences PresentationNamesS.docx
Confidence Intervals in the Life Sciences PresentationNamesS.docxConfidence Intervals in the Life Sciences PresentationNamesS.docx
Confidence Intervals in the Life Sciences PresentationNamesS.docx
maxinesmith73660
 
How to determine sample size
How to determine sample size How to determine sample size
How to determine sample size
saifur rahman
 
Testing a claim about a mean
Testing a claim about a mean  Testing a claim about a mean
Testing a claim about a mean
Long Beach City College
 
Estimating a Population Proportion
Estimating a Population ProportionEstimating a Population Proportion
Estimating a Population Proportion
Long Beach City College
 
Estimating a Population Proportion
Estimating a Population ProportionEstimating a Population Proportion
Estimating a Population Proportion
Long Beach City College
 
RESEARCH METHODS LESSON 3
RESEARCH METHODS LESSON 3RESEARCH METHODS LESSON 3
RESEARCH METHODS LESSON 3
DR. TIRIMBA IBRAHIM
 
Estimation and hypothesis testing 1 (graduate statistics2)
Estimation and hypothesis testing 1 (graduate statistics2)Estimation and hypothesis testing 1 (graduate statistics2)
Estimation and hypothesis testing 1 (graduate statistics2)Harve Abella
 
confidence intervals for one popular mean.pdf
confidence intervals for one popular mean.pdfconfidence intervals for one popular mean.pdf
confidence intervals for one popular mean.pdf
RAHULSUTHAR46
 
Hypothesis testing: A single sample test
Hypothesis testing: A single sample testHypothesis testing: A single sample test
Hypothesis testing: A single sample test
Umme Salma Tuli
 

Similar to Confidence Interval for Mean and Proportion (Methodology) (20)

Chapter 7 – Confidence Intervals And Sample Size
Chapter 7 – Confidence Intervals And Sample SizeChapter 7 – Confidence Intervals And Sample Size
Chapter 7 – Confidence Intervals And Sample Size
 
Sample size determination
Sample size determinationSample size determination
Sample size determination
 
Section 7 Analyzing our Marketing Test, Survey Results .docx
Section 7 Analyzing our Marketing Test, Survey Results .docxSection 7 Analyzing our Marketing Test, Survey Results .docx
Section 7 Analyzing our Marketing Test, Survey Results .docx
 
Sample size calculation
Sample size calculationSample size calculation
Sample size calculation
 
Chapter09
Chapter09Chapter09
Chapter09
 
Chapter 8
Chapter 8Chapter 8
Chapter 8
 
Lesson04_Static11
Lesson04_Static11Lesson04_Static11
Lesson04_Static11
 
Sampling Technique
Sampling TechniqueSampling Technique
Sampling Technique
 
GROUP 1 biostatistics ,sample size and epid.pptx
GROUP 1 biostatistics ,sample size and epid.pptxGROUP 1 biostatistics ,sample size and epid.pptx
GROUP 1 biostatistics ,sample size and epid.pptx
 
Lesson04_new
Lesson04_newLesson04_new
Lesson04_new
 
Probability Distributions
Probability DistributionsProbability Distributions
Probability Distributions
 
Confidence Intervals in the Life Sciences PresentationNamesS.docx
Confidence Intervals in the Life Sciences PresentationNamesS.docxConfidence Intervals in the Life Sciences PresentationNamesS.docx
Confidence Intervals in the Life Sciences PresentationNamesS.docx
 
How to determine sample size
How to determine sample size How to determine sample size
How to determine sample size
 
Testing a claim about a mean
Testing a claim about a mean  Testing a claim about a mean
Testing a claim about a mean
 
Estimating a Population Proportion
Estimating a Population ProportionEstimating a Population Proportion
Estimating a Population Proportion
 
Estimating a Population Proportion
Estimating a Population ProportionEstimating a Population Proportion
Estimating a Population Proportion
 
RESEARCH METHODS LESSON 3
RESEARCH METHODS LESSON 3RESEARCH METHODS LESSON 3
RESEARCH METHODS LESSON 3
 
Estimation and hypothesis testing 1 (graduate statistics2)
Estimation and hypothesis testing 1 (graduate statistics2)Estimation and hypothesis testing 1 (graduate statistics2)
Estimation and hypothesis testing 1 (graduate statistics2)
 
confidence intervals for one popular mean.pdf
confidence intervals for one popular mean.pdfconfidence intervals for one popular mean.pdf
confidence intervals for one popular mean.pdf
 
Hypothesis testing: A single sample test
Hypothesis testing: A single sample testHypothesis testing: A single sample test
Hypothesis testing: A single sample test
 

More from MaryWall14

Chapter 11
Chapter 11Chapter 11
Chapter 11
MaryWall14
 
Chapter 10
Chapter 10Chapter 10
Chapter 10
MaryWall14
 
Chapter 9
Chapter 9Chapter 9
Chapter 9
MaryWall14
 
Chapter 7
Chapter 7Chapter 7
Chapter 7
MaryWall14
 
Chapter 6
Chapter 6Chapter 6
Chapter 6
MaryWall14
 
Chapter 5
Chapter 5Chapter 5
Chapter 5
MaryWall14
 
Chapter 4
Chapter 4Chapter 4
Chapter 4
MaryWall14
 
Chapter 3
Chapter 3Chapter 3
Chapter 3
MaryWall14
 
Chapter 2
Chapter 2Chapter 2
Chapter 2
MaryWall14
 
Chapter 1
Chapter 1Chapter 1
Chapter 1
MaryWall14
 
P value
P valueP value
P value
MaryWall14
 
p-value drawing (model)
p-value drawing (model) p-value drawing (model)
p-value drawing (model)
MaryWall14
 
Hypothesis Tests (outline)
Hypothesis Tests (outline)Hypothesis Tests (outline)
Hypothesis Tests (outline)
MaryWall14
 
Decisions conclusions hypothesis_testing
Decisions conclusions hypothesis_testingDecisions conclusions hypothesis_testing
Decisions conclusions hypothesis_testing
MaryWall14
 
Confidence interval (t-critical)
Confidence interval (t-critical)Confidence interval (t-critical)
Confidence interval (t-critical)
MaryWall14
 
Confidence interval interpreting_proportion
Confidence interval interpreting_proportionConfidence interval interpreting_proportion
Confidence interval interpreting_proportion
MaryWall14
 
1.4 How not to do Statistics
1.4 How not to do Statistics1.4 How not to do Statistics
1.4 How not to do Statistics
MaryWall14
 
1.3 Experimental Design and Observational Studies
1.3 Experimental Design and Observational Studies 1.3 Experimental Design and Observational Studies
1.3 Experimental Design and Observational Studies
MaryWall14
 
1.2 Sampling Methods
1.2 Sampling Methods1.2 Sampling Methods
1.2 Sampling Methods
MaryWall14
 
1.1 intro to statistics
1.1 intro to statistics1.1 intro to statistics
1.1 intro to statistics
MaryWall14
 

More from MaryWall14 (20)

Chapter 11
Chapter 11Chapter 11
Chapter 11
 
Chapter 10
Chapter 10Chapter 10
Chapter 10
 
Chapter 9
Chapter 9Chapter 9
Chapter 9
 
Chapter 7
Chapter 7Chapter 7
Chapter 7
 
Chapter 6
Chapter 6Chapter 6
Chapter 6
 
Chapter 5
Chapter 5Chapter 5
Chapter 5
 
Chapter 4
Chapter 4Chapter 4
Chapter 4
 
Chapter 3
Chapter 3Chapter 3
Chapter 3
 
Chapter 2
Chapter 2Chapter 2
Chapter 2
 
Chapter 1
Chapter 1Chapter 1
Chapter 1
 
P value
P valueP value
P value
 
p-value drawing (model)
p-value drawing (model) p-value drawing (model)
p-value drawing (model)
 
Hypothesis Tests (outline)
Hypothesis Tests (outline)Hypothesis Tests (outline)
Hypothesis Tests (outline)
 
Decisions conclusions hypothesis_testing
Decisions conclusions hypothesis_testingDecisions conclusions hypothesis_testing
Decisions conclusions hypothesis_testing
 
Confidence interval (t-critical)
Confidence interval (t-critical)Confidence interval (t-critical)
Confidence interval (t-critical)
 
Confidence interval interpreting_proportion
Confidence interval interpreting_proportionConfidence interval interpreting_proportion
Confidence interval interpreting_proportion
 
1.4 How not to do Statistics
1.4 How not to do Statistics1.4 How not to do Statistics
1.4 How not to do Statistics
 
1.3 Experimental Design and Observational Studies
1.3 Experimental Design and Observational Studies 1.3 Experimental Design and Observational Studies
1.3 Experimental Design and Observational Studies
 
1.2 Sampling Methods
1.2 Sampling Methods1.2 Sampling Methods
1.2 Sampling Methods
 
1.1 intro to statistics
1.1 intro to statistics1.1 intro to statistics
1.1 intro to statistics
 

Recently uploaded

The Accursed House by Émile Gaboriau.pptx
The Accursed House by Émile Gaboriau.pptxThe Accursed House by Émile Gaboriau.pptx
The Accursed House by Émile Gaboriau.pptx
DhatriParmar
 
Unit 2- Research Aptitude (UGC NET Paper I).pdf
Unit 2- Research Aptitude (UGC NET Paper I).pdfUnit 2- Research Aptitude (UGC NET Paper I).pdf
Unit 2- Research Aptitude (UGC NET Paper I).pdf
Thiyagu K
 
BÀI TẬP BỔ TRỢ TIẾNG ANH GLOBAL SUCCESS LỚP 3 - CẢ NĂM (CÓ FILE NGHE VÀ ĐÁP Á...
BÀI TẬP BỔ TRỢ TIẾNG ANH GLOBAL SUCCESS LỚP 3 - CẢ NĂM (CÓ FILE NGHE VÀ ĐÁP Á...BÀI TẬP BỔ TRỢ TIẾNG ANH GLOBAL SUCCESS LỚP 3 - CẢ NĂM (CÓ FILE NGHE VÀ ĐÁP Á...
BÀI TẬP BỔ TRỢ TIẾNG ANH GLOBAL SUCCESS LỚP 3 - CẢ NĂM (CÓ FILE NGHE VÀ ĐÁP Á...
Nguyen Thanh Tu Collection
 
CLASS 11 CBSE B.St Project AIDS TO TRADE - INSURANCE
CLASS 11 CBSE B.St Project AIDS TO TRADE - INSURANCECLASS 11 CBSE B.St Project AIDS TO TRADE - INSURANCE
CLASS 11 CBSE B.St Project AIDS TO TRADE - INSURANCE
BhavyaRajput3
 
The approach at University of Liverpool.pptx
The approach at University of Liverpool.pptxThe approach at University of Liverpool.pptx
The approach at University of Liverpool.pptx
Jisc
 
Phrasal Verbs.XXXXXXXXXXXXXXXXXXXXXXXXXX
Phrasal Verbs.XXXXXXXXXXXXXXXXXXXXXXXXXXPhrasal Verbs.XXXXXXXXXXXXXXXXXXXXXXXXXX
Phrasal Verbs.XXXXXXXXXXXXXXXXXXXXXXXXXX
MIRIAMSALINAS13
 
Biological Screening of Herbal Drugs in detailed.
Biological Screening of Herbal Drugs in detailed.Biological Screening of Herbal Drugs in detailed.
Biological Screening of Herbal Drugs in detailed.
Ashokrao Mane college of Pharmacy Peth-Vadgaon
 
Language Across the Curriculm LAC B.Ed.
Language Across the  Curriculm LAC B.Ed.Language Across the  Curriculm LAC B.Ed.
Language Across the Curriculm LAC B.Ed.
Atul Kumar Singh
 
Operation Blue Star - Saka Neela Tara
Operation Blue Star   -  Saka Neela TaraOperation Blue Star   -  Saka Neela Tara
Operation Blue Star - Saka Neela Tara
Balvir Singh
 
Sha'Carri Richardson Presentation 202345
Sha'Carri Richardson Presentation 202345Sha'Carri Richardson Presentation 202345
Sha'Carri Richardson Presentation 202345
beazzy04
 
The geography of Taylor Swift - some ideas
The geography of Taylor Swift - some ideasThe geography of Taylor Swift - some ideas
The geography of Taylor Swift - some ideas
GeoBlogs
 
Unit 8 - Information and Communication Technology (Paper I).pdf
Unit 8 - Information and Communication Technology (Paper I).pdfUnit 8 - Information and Communication Technology (Paper I).pdf
Unit 8 - Information and Communication Technology (Paper I).pdf
Thiyagu K
 
Instructions for Submissions thorugh G- Classroom.pptx
Instructions for Submissions thorugh G- Classroom.pptxInstructions for Submissions thorugh G- Classroom.pptx
Instructions for Submissions thorugh G- Classroom.pptx
Jheel Barad
 
678020731-Sumas-y-Restas-Para-Colorear.pdf
678020731-Sumas-y-Restas-Para-Colorear.pdf678020731-Sumas-y-Restas-Para-Colorear.pdf
678020731-Sumas-y-Restas-Para-Colorear.pdf
CarlosHernanMontoyab2
 
The Roman Empire A Historical Colossus.pdf
The Roman Empire A Historical Colossus.pdfThe Roman Empire A Historical Colossus.pdf
The Roman Empire A Historical Colossus.pdf
kaushalkr1407
 
Digital Tools and AI for Teaching Learning and Research
Digital Tools and AI for Teaching Learning and ResearchDigital Tools and AI for Teaching Learning and Research
Digital Tools and AI for Teaching Learning and Research
Vikramjit Singh
 
The French Revolution Class 9 Study Material pdf free download
The French Revolution Class 9 Study Material pdf free downloadThe French Revolution Class 9 Study Material pdf free download
The French Revolution Class 9 Study Material pdf free download
Vivekanand Anglo Vedic Academy
 
Thesis Statement for students diagnonsed withADHD.ppt
Thesis Statement for students diagnonsed withADHD.pptThesis Statement for students diagnonsed withADHD.ppt
Thesis Statement for students diagnonsed withADHD.ppt
EverAndrsGuerraGuerr
 
Lapbook sobre os Regimes TotalitĂĄrios.pdf
Lapbook sobre os Regimes TotalitĂĄrios.pdfLapbook sobre os Regimes TotalitĂĄrios.pdf
Lapbook sobre os Regimes TotalitĂĄrios.pdf
Jean Carlos Nunes PaixĂŁo
 
Mule 4.6 & Java 17 Upgrade | MuleSoft Mysore Meetup #46
Mule 4.6 & Java 17 Upgrade | MuleSoft Mysore Meetup #46Mule 4.6 & Java 17 Upgrade | MuleSoft Mysore Meetup #46
Mule 4.6 & Java 17 Upgrade | MuleSoft Mysore Meetup #46
MysoreMuleSoftMeetup
 

Recently uploaded (20)

The Accursed House by Émile Gaboriau.pptx
The Accursed House by Émile Gaboriau.pptxThe Accursed House by Émile Gaboriau.pptx
The Accursed House by Émile Gaboriau.pptx
 
Unit 2- Research Aptitude (UGC NET Paper I).pdf
Unit 2- Research Aptitude (UGC NET Paper I).pdfUnit 2- Research Aptitude (UGC NET Paper I).pdf
Unit 2- Research Aptitude (UGC NET Paper I).pdf
 
BÀI TẬP BỔ TRỢ TIẾNG ANH GLOBAL SUCCESS LỚP 3 - CẢ NĂM (CÓ FILE NGHE VÀ ĐÁP Á...
BÀI TẬP BỔ TRỢ TIẾNG ANH GLOBAL SUCCESS LỚP 3 - CẢ NĂM (CÓ FILE NGHE VÀ ĐÁP Á...BÀI TẬP BỔ TRỢ TIẾNG ANH GLOBAL SUCCESS LỚP 3 - CẢ NĂM (CÓ FILE NGHE VÀ ĐÁP Á...
BÀI TẬP BỔ TRỢ TIẾNG ANH GLOBAL SUCCESS LỚP 3 - CẢ NĂM (CÓ FILE NGHE VÀ ĐÁP Á...
 
CLASS 11 CBSE B.St Project AIDS TO TRADE - INSURANCE
CLASS 11 CBSE B.St Project AIDS TO TRADE - INSURANCECLASS 11 CBSE B.St Project AIDS TO TRADE - INSURANCE
CLASS 11 CBSE B.St Project AIDS TO TRADE - INSURANCE
 
The approach at University of Liverpool.pptx
The approach at University of Liverpool.pptxThe approach at University of Liverpool.pptx
The approach at University of Liverpool.pptx
 
Phrasal Verbs.XXXXXXXXXXXXXXXXXXXXXXXXXX
Phrasal Verbs.XXXXXXXXXXXXXXXXXXXXXXXXXXPhrasal Verbs.XXXXXXXXXXXXXXXXXXXXXXXXXX
Phrasal Verbs.XXXXXXXXXXXXXXXXXXXXXXXXXX
 
Biological Screening of Herbal Drugs in detailed.
Biological Screening of Herbal Drugs in detailed.Biological Screening of Herbal Drugs in detailed.
Biological Screening of Herbal Drugs in detailed.
 
Language Across the Curriculm LAC B.Ed.
Language Across the  Curriculm LAC B.Ed.Language Across the  Curriculm LAC B.Ed.
Language Across the Curriculm LAC B.Ed.
 
Operation Blue Star - Saka Neela Tara
Operation Blue Star   -  Saka Neela TaraOperation Blue Star   -  Saka Neela Tara
Operation Blue Star - Saka Neela Tara
 
Sha'Carri Richardson Presentation 202345
Sha'Carri Richardson Presentation 202345Sha'Carri Richardson Presentation 202345
Sha'Carri Richardson Presentation 202345
 
The geography of Taylor Swift - some ideas
The geography of Taylor Swift - some ideasThe geography of Taylor Swift - some ideas
The geography of Taylor Swift - some ideas
 
Unit 8 - Information and Communication Technology (Paper I).pdf
Unit 8 - Information and Communication Technology (Paper I).pdfUnit 8 - Information and Communication Technology (Paper I).pdf
Unit 8 - Information and Communication Technology (Paper I).pdf
 
Instructions for Submissions thorugh G- Classroom.pptx
Instructions for Submissions thorugh G- Classroom.pptxInstructions for Submissions thorugh G- Classroom.pptx
Instructions for Submissions thorugh G- Classroom.pptx
 
678020731-Sumas-y-Restas-Para-Colorear.pdf
678020731-Sumas-y-Restas-Para-Colorear.pdf678020731-Sumas-y-Restas-Para-Colorear.pdf
678020731-Sumas-y-Restas-Para-Colorear.pdf
 
The Roman Empire A Historical Colossus.pdf
The Roman Empire A Historical Colossus.pdfThe Roman Empire A Historical Colossus.pdf
The Roman Empire A Historical Colossus.pdf
 
Digital Tools and AI for Teaching Learning and Research
Digital Tools and AI for Teaching Learning and ResearchDigital Tools and AI for Teaching Learning and Research
Digital Tools and AI for Teaching Learning and Research
 
The French Revolution Class 9 Study Material pdf free download
The French Revolution Class 9 Study Material pdf free downloadThe French Revolution Class 9 Study Material pdf free download
The French Revolution Class 9 Study Material pdf free download
 
Thesis Statement for students diagnonsed withADHD.ppt
Thesis Statement for students diagnonsed withADHD.pptThesis Statement for students diagnonsed withADHD.ppt
Thesis Statement for students diagnonsed withADHD.ppt
 
Lapbook sobre os Regimes TotalitĂĄrios.pdf
Lapbook sobre os Regimes TotalitĂĄrios.pdfLapbook sobre os Regimes TotalitĂĄrios.pdf
Lapbook sobre os Regimes TotalitĂĄrios.pdf
 
Mule 4.6 & Java 17 Upgrade | MuleSoft Mysore Meetup #46
Mule 4.6 & Java 17 Upgrade | MuleSoft Mysore Meetup #46Mule 4.6 & Java 17 Upgrade | MuleSoft Mysore Meetup #46
Mule 4.6 & Java 17 Upgrade | MuleSoft Mysore Meetup #46
 

Confidence Interval for Mean and Proportion (Methodology)

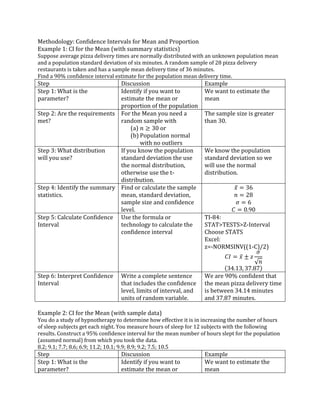
  • 1. Methodology: Confidence Intervals for Mean and Proportion Example 1: CI for the Mean (with summary statistics) Suppose average pizza delivery times are normally distributed with an unknown population mean and a population standard deviation of six minutes. A random sample of 28 pizza delivery restaurants is taken and has a sample mean delivery time of 36 minutes. Find a 90% confidence interval estimate for the population mean delivery time. Step Discussion Example Step 1: What is the parameter? Identify if you want to estimate the mean or proportion of the population We want to estimate the mean Step 2: Are the requirements met? For the Mean you need a random sample with (a) or (b) Population normal with no outliers The sample size is greater than 30. Step 3: What distribution will you use? If you know the population standard deviation the use the normal distribution, otherwise use the t- distribution. We know the population standard deviation so we will use the normal distribution. Step 4: Identify the summary statistics. Find or calculate the sample mean, standard deviation, sample size and confidence level. ̅ Step 5: Calculate Confidence Interval Use the formula or technology to calculate the confidence interval TI-84: STAT>TESTS>Z-Interval Choose STATS Excel: z=-NORMSINV((1-C)/2) ̅ √ ( ) Step 6: Interpret Confidence Interval Write a complete sentence that includes the confidence level, limits of interval, and units of random variable. We are 90% confident that the mean pizza delivery time is between 34.14 minutes and 37.87 minutes. Example 2: CI for the Mean (with sample data) You do a study of hypnotherapy to determine how effective it is in increasing the number of hours of sleep subjects get each night. You measure hours of sleep for 12 subjects with the following results. Construct a 95% confidence interval for the mean number of hours slept for the population (assumed normal) from which you took the data. 8.2; 9.1; 7.7; 8.6; 6.9; 11.2; 10.1; 9.9; 8.9; 9.2; 7.5; 10.5 Step Discussion Example Step 1: What is the parameter? Identify if you want to estimate the mean or We want to estimate the mean
  • 2. proportion of the population Step 2: Are the requirements met? For the Mean you need a random sample with (a) or (b) Population normal with no outliers The population is normal. Step 3: What distribution will you use? If you know the population standard deviation the use the normal distribution, otherwise use the t- distribution. We do not know the population standard deviation so we will use the t-distribution. Step 4:Identify the summary statistics. Find or calculate the sample mean, standard deviation, sample size and confidence level. TI-84: STAT>EDIT Enter Data in L1 ̅ Step 5: Calculate Confidence Interval Use the formula or technology to calculate the confidence interval TI-84: STAT>TESTS>T-Interval Choose DATA Excel: t=TINV(1-C) ̅ √ ( ) Step 6: Interpret Confidence Interval Write a complete sentence that includes the confidence level, limits of interval, and units of random variable. We are 95% confident that the mean amount of sleep for patients undergoing hypnotherapy is between 8.96 hours and 9.01 hours. Example 3: CI for the Proportion Suppose 250 randomly selected people are surveyed to determine if they own a tablet. Of the 250 surveyed, 98 reported owning a tablet. Using a 95% confidence level, compute a confidence interval estimate for the true proportion of people who own tablets. Step Discussion Example Step 1: What is the parameter? Identify if you want to estimate the mean or proportion of the population We want to estimate the proportion Step 2: Are the requirements met? For the proportion you need a random sample with (a) ( ) and (b) ( ) Step 3: What distribution will you use? If the sample size is sufficiently large then the We will use the normal distribution.
  • 3. normal distribution approximates the binomial distribution quite well. Step 4:Identify the summary statistics. Find or calculate the sample proportion, sample size and confidence level. Step 5: Calculate Confidence Interval Use the formula or technology to calculate the confidence interval TI-84: STAT>TESTS>1- PropZInterval Excel: z=-NORMSINV((1-C)/2) √ ( ) ( ) Step 6: Interpret Confidence Interval Write a complete sentence that includes the confidence level, limits of interval, and units of random variable. We are 95% confident that the proportion of people who own tablets between 33% and 45%