Downloaded 38 times


![559966
17–12 Concluded
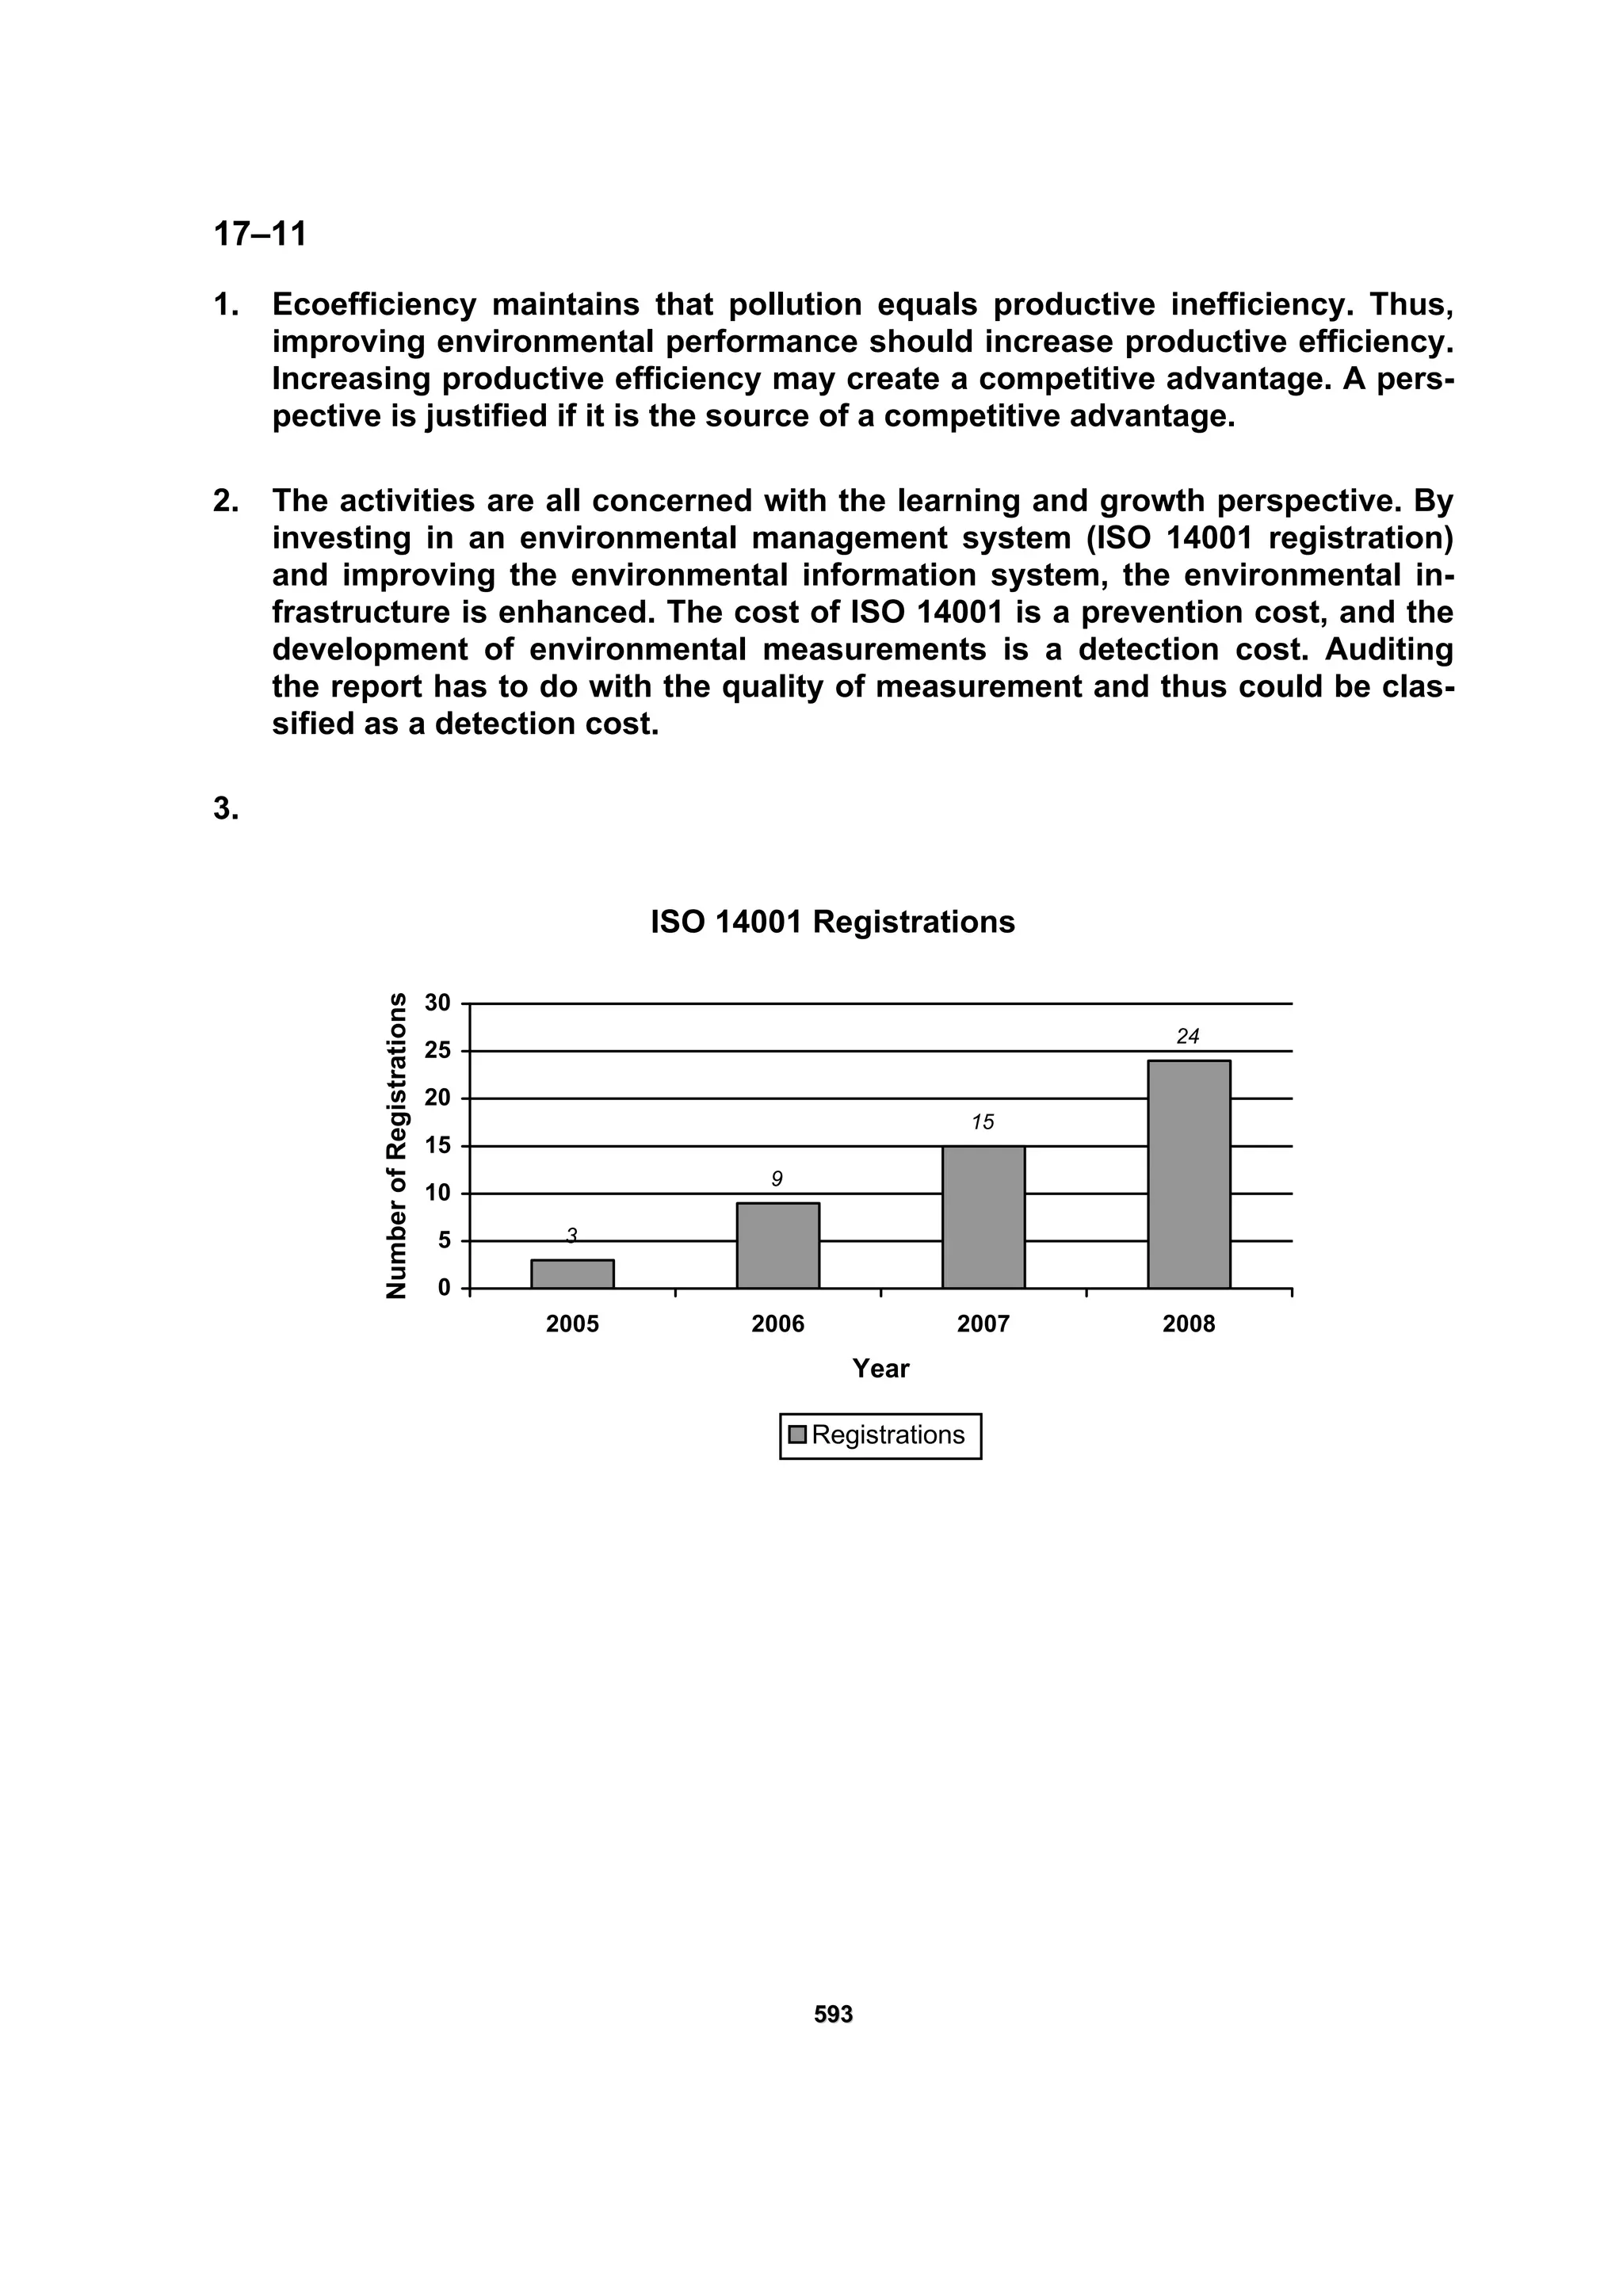
2.
Normalized Energy Consumption
12,000
11,800
10,545
10,364
9,500
10,000
10,500
11,000
11,500
12,000
12,500
2005 2006 2007 2008
Year
BTUs/Sales
BTUs/Sales
Energy consumption has dropped from 12,000 BTUs per sales dollar to 10,364
BTUs per sales dollar, a 13.63 percent improvement [(12,000 – 10,364)/12,000].
This compares with a 5 percent improvement for the measure that is not nor-
malized. The 13.63 percent is a more meaningful measure because it reflects
the need to increase energy consumption as output increases.](https://image.slidesharecdn.com/ch17-171016223541/75/Chapter-17-Environmental-Cost-Management-16-2048.jpg)


This document discusses environmental cost management and eco-efficiency. It provides examples of how to calculate activity rates and assign environmental costs to products using activity-based costing. It shows how improving environmental performance through reducing materials usage and emissions can lower production costs. Tracking environmental costs can identify opportunities to lower costs while reducing impacts. Assigning full environmental costs provides the most complete picture, though firms often only report private costs.


