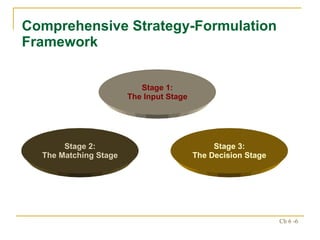
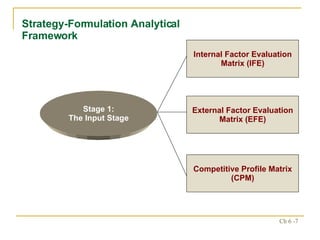
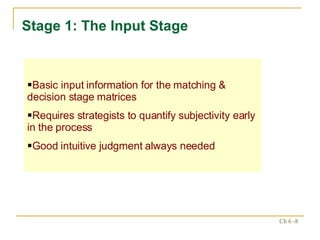
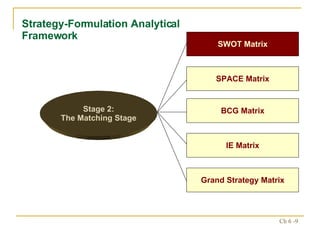
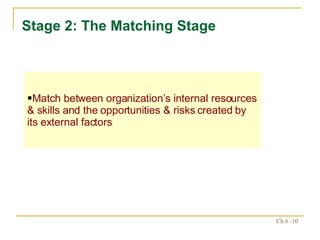
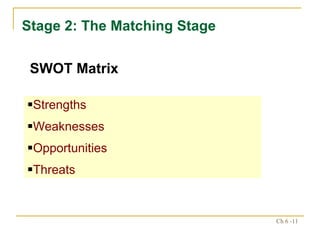
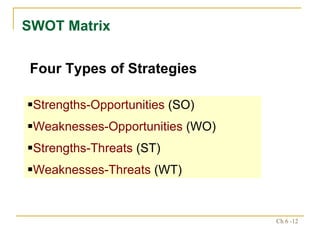
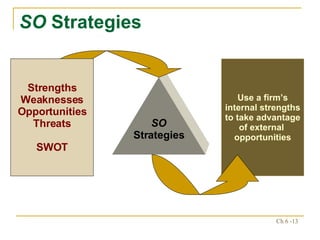
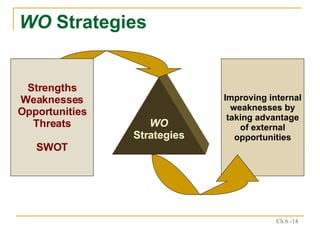
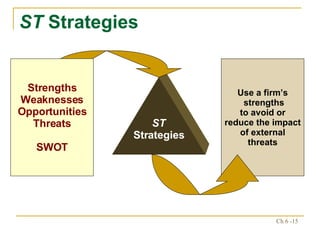
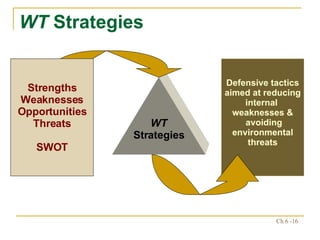
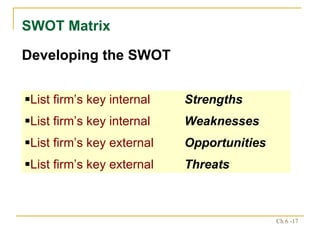
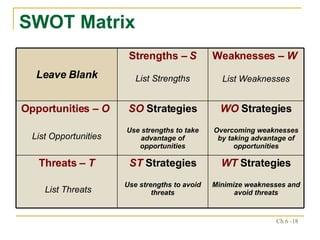
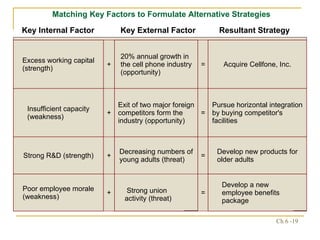
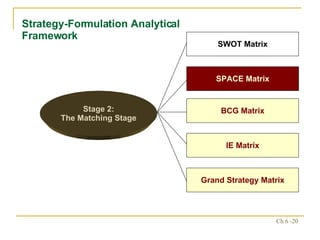
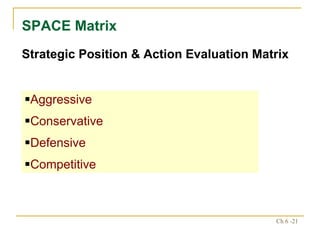
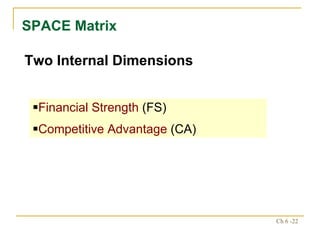
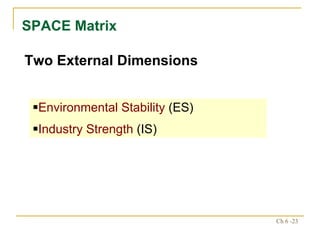
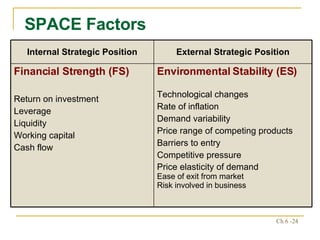
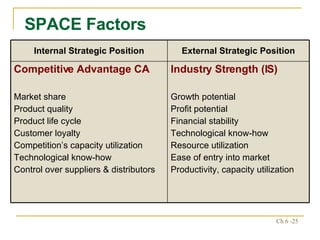
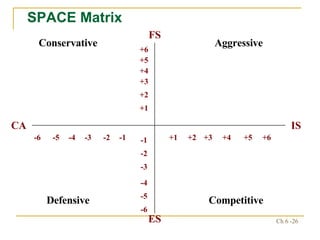
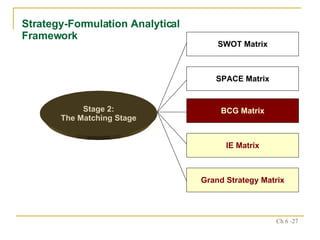
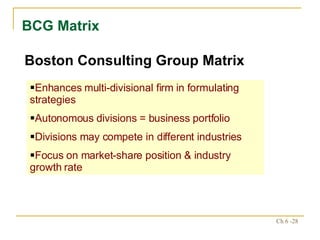
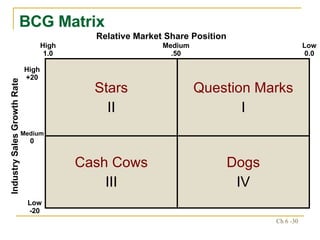
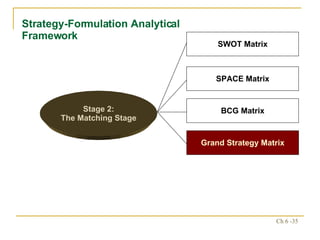
Chapter 6 Strategy Analysis & Choice
To acquire or not to acquire, that is the question – Robert J. Terry Strategy Analysis & Choice Life is full of lousy options --  General P.X. Kelley
--   Establishing long-term objectives -- Generating alternative strategies -- Selecting strategies to pursue -- Best alternative - achieve mission & objectives Nature of Strategy Analysis & Choice Strategy Analysis & Choice
Vision Mission Objectives External audit Internal audit Past successful strategies Strategy Analysis & Choice Alternative Strategies Derive From --
Strategy Analysis & Choice Generating Alternatives -- Participation in generating alternative strategies should be as broad as possible
Comprehensive Strategy-Formulation Framework Stage 1: The Input Stage Stage 2: The Matching Stage Stage 3: The Decision Stage
Strategy-Formulation Analytical Framework Internal Factor Evaluation Matrix (IFE) External Factor Evaluation Matrix (EFE) Competitive Profile Matrix (CPM) Stage 1: The Input Stage
Stage 1: The Input Stage Basic input information for the matching & decision stage matrices Requires strategists to quantify subjectivity early in the process Good intuitive judgment always needed
Strategy-Formulation Analytical Framework SWOT Matrix SPACE Matrix BCG Matrix IE Matrix Grand Strategy Matrix Stage 2: The Matching Stage
Stage 2: The Matching Stage Match between organization’s internal resources & skills and the opportunities & risks created by its external factors
Stage 2: The Matching Stage Strengths Weaknesses Opportunities Threats SWOT Matrix
SWOT Matrix Strengths-Opportunities  (SO) Weaknesses-Opportunities  (WO) Strengths-Threats  (ST) Weaknesses-Threats  (WT) Four Types of Strategies
SO  Strategies Use a firm’s internal strengths to take advantage of external  opportunities SO Strategies Strengths Weaknesses Opportunities Threats SWOT
WO  Strategies Improving internal weaknesses by taking advantage of external opportunities WO Strategies Strengths Weaknesses Opportunities Threats SWOT
ST  Strategies Use a firm’s  strengths to avoid or reduce the impact of external threats ST Strategies Strengths Weaknesses Opportunities Threats SWOT
WT  Strategies Defensive tactics aimed at reducing internal  weaknesses &  avoiding environmental threats WT Strategies Strengths Weaknesses Opportunities Threats SWOT
SWOT Matrix Developing the SWOT  List firm’s key internal  Strengths List firm’s key internal  Weaknesses List firm’s key external  Opportunities List firm’s key external  Threats
SWOT Matrix WT   Strategies   Minimize weaknesses and avoid threats ST   Strategies Use strengths to avoid threats Threats –  T List Threats WO  Strategies Overcoming weaknesses by taking advantage of opportunities SO  Strategies Use strengths to take advantage of opportunities Opportunities –  O   List Opportunities Weaknesses –  W   List Weaknesses Strengths –  S List Strengths Leave Blank
Key Internal Factor Key External Factor Resultant Strategy Matching Key Factors to Formulate Alternative Strategies Develop a new employee benefits package = Strong union activity (threat) + Poor employee morale (weakness) Develop new products for older adults = Decreasing numbers of young adults (threat) + Strong R&D (strength) Pursue horizontal integration by buying competitor's facilities = Exit of two major foreign competitors form the industry (opportunity) + Insufficient capacity (weakness) Acquire Cellfone, Inc. = 20% annual growth in the cell phone industry (opportunity) + Excess working capital (strength)
Strategy-Formulation Analytical Framework SWOT Matrix SPACE Matrix BCG Matrix IE Matrix Grand Strategy Matrix Stage 2: The Matching Stage
SPACE Matrix Strategic Position & Action Evaluation Matrix Aggressive Conservative Defensive Competitive
SPACE Matrix Two Internal Dimensions Financial Strength  (FS) Competitive Advantage  (CA)
SPACE Matrix Two External Dimensions Environmental Stability  (ES) Industry Strength  (IS)
SPACE Factors Environmental Stability (ES) Technological changes Rate of inflation Demand variability Price range of competing products Barriers to entry Competitive pressure Price elasticity of demand Ease of exit from market  Risk involved in business Financial Strength (FS) Return on investment Leverage Liquidity Working capital Cash flow External Strategic Position Internal Strategic Position
SPACE Factors Industry Strength (IS) Growth potential Profit potential Financial stability Technological know-how Resource utilization Ease of entry into market Productivity, capacity utilization Competitive Advantage CA Market share Product quality Product life cycle Customer loyalty Competition’s capacity utilization Technological know-how Control over suppliers & distributors External Strategic Position Internal Strategic Position
SPACE Matrix FS +6 +1 +5 +4 +3 +2 -6 -5 -4 -3 -2 -1 -6 -5 -4 -3 -2 -1 +1 +2 +3 +4 +5 +6 ES CA IS Conservative Aggressive Defensive Competitive
Strategy-Formulation Analytical Framework SWOT Matrix SPACE Matrix BCG Matrix IE Matrix Grand Strategy Matrix Stage 2: The Matching Stage
BCG Matrix Boston Consulting Group Matrix Enhances multi-divisional firm in formulating strategies Autonomous divisions = business portfolio Divisions may compete in different industries Focus on market-share position & industry growth rate
BCG Matrix Relative Market Share Position Ratio of a division’s own market share in an industry to the market share held by the largest rival firm in that industry.
BCG Matrix Relative Market Share Position High 1.0 Medium .50 Low 0.0 Industry Sales Growth Rate High +20 Low -20 Medium 0 Dogs IV Cash Cows III Question Marks I Stars II
BCG Matrix Question Marks Low relative market share – compete in high-growth industry Cash needs are high Case generation is low Decision to strengthen (intensive strategies) or divest
BCG Matrix Stars High relative market share and high growth rate Best long-run opportunities for growth & profitability Substantial investment to maintain or strengthen dominant position Integration strategies, intensive strategies, joint ventures
BCG Matrix Cash Cows High relative market share, competes in low-growth industry Generate cash in excess of their needs Milked for other purposes Maintain strong position as long as possible Product development, concentric diversification If weakens—retrenchment or divestiture
BCG Matrix Dogs Low relative market share & compete in slow or no market growth Weak internal & external position Liquidation, divestiture, retrenchment
Strategy-Formulation Analytical Framework SWOT Matrix SPACE Matrix BCG Matrix Grand Strategy Matrix Stage 2: The Matching Stage
Grand Strategy Matrix Tool for formulating alternative strategies Based on two dimensions Competitive position Market growth
Quadrant IV Concentric diversification Horizontal diversification Conglomerate diversification Joint ventures Quadrant III Retrenchment Concentric diversification Horizontal diversification Conglomerate diversification Liquidation Quadrant I Market development Market penetration Product development Forward integration Backward integration Horizontal integration Concentric diversification Quadrant II Market development Market penetration Product development Horizontal integration Divestiture Liquidation RAPID MARKET GROWTH SLOW MARKET GROWTH WEAK  COMPETITIVE  POSITION STRONG COMPETITIVE  POSITION
Grand Strategy Matrix Excellent strategic position Concentration on current markets/products Take risks aggressively when necessary Quadrant I
Grand Strategy Matrix Evaluate present approach How to improve competitiveness Rapid market growth requires intensive strategy Quadrant II
Grand Strategy Matrix Compete in slow-growth industries Weak competitive position Drastic changes quickly Cost & asset reduction (retrenchment) Quadrant III
Grand Strategy Matrix Strong competitive position Slow-growth industry Diversification to more promising growth areas Quadrant IV
Strategy-Formulation Analytical Framework Stage 3: The Decision Stage Quantitative Strategic Planning Matrix (QSPM)
QSPM Technique designed to determine the relative attractiveness of feasible alternative actions Quantitative Strategic Planning Matrix
QSPM Strategic Alternatives Key Internal Factors Management Marketing Finance/Accounting Production/Operations Research and Development Computer Information Systems Strategy 3 Strategy 2 Strategy 1 Weight Key External Factors Economy Political/Legal/Governmental Social/Cultural/Demographic/Environmental Technological Competitive
QSPM Requires intuitive judgments & educated assumptions Only as good as the prerequisite inputs Limitations
QSPM Sets of strategies considered simultaneously or sequentially Integration of pertinent external & internal factors in the decision making process Advantages
Cultural Aspects of Strategy Choice Successful strategies depend on the degree of consistency with the firm’s culture Organization Culture
Politics of Strategy Choice Management hierarchy Career aspirations Allocation of scarce resources Politics in Organizations
Politics of Strategy Choice Equifinality Satisfying Generalization Higher-order issues Political access on important issues Political tactics for strategists

Chap06exp

  • 1.
    Chapter 6 StrategyAnalysis & Choice
  • 2.
    To acquire ornot to acquire, that is the question – Robert J. Terry Strategy Analysis & Choice Life is full of lousy options -- General P.X. Kelley
  • 3.
    -- Establishing long-term objectives -- Generating alternative strategies -- Selecting strategies to pursue -- Best alternative - achieve mission & objectives Nature of Strategy Analysis & Choice Strategy Analysis & Choice
  • 4.
    Vision Mission ObjectivesExternal audit Internal audit Past successful strategies Strategy Analysis & Choice Alternative Strategies Derive From --
  • 5.
    Strategy Analysis &Choice Generating Alternatives -- Participation in generating alternative strategies should be as broad as possible
  • 6.
    Comprehensive Strategy-Formulation FrameworkStage 1: The Input Stage Stage 2: The Matching Stage Stage 3: The Decision Stage
  • 7.
    Strategy-Formulation Analytical FrameworkInternal Factor Evaluation Matrix (IFE) External Factor Evaluation Matrix (EFE) Competitive Profile Matrix (CPM) Stage 1: The Input Stage
  • 8.
    Stage 1: TheInput Stage Basic input information for the matching & decision stage matrices Requires strategists to quantify subjectivity early in the process Good intuitive judgment always needed
  • 9.
    Strategy-Formulation Analytical FrameworkSWOT Matrix SPACE Matrix BCG Matrix IE Matrix Grand Strategy Matrix Stage 2: The Matching Stage
  • 10.
    Stage 2: TheMatching Stage Match between organization’s internal resources & skills and the opportunities & risks created by its external factors
  • 11.
    Stage 2: TheMatching Stage Strengths Weaknesses Opportunities Threats SWOT Matrix
  • 12.
    SWOT Matrix Strengths-Opportunities (SO) Weaknesses-Opportunities (WO) Strengths-Threats (ST) Weaknesses-Threats (WT) Four Types of Strategies
  • 13.
    SO StrategiesUse a firm’s internal strengths to take advantage of external opportunities SO Strategies Strengths Weaknesses Opportunities Threats SWOT
  • 14.
    WO StrategiesImproving internal weaknesses by taking advantage of external opportunities WO Strategies Strengths Weaknesses Opportunities Threats SWOT
  • 15.
    ST StrategiesUse a firm’s strengths to avoid or reduce the impact of external threats ST Strategies Strengths Weaknesses Opportunities Threats SWOT
  • 16.
    WT StrategiesDefensive tactics aimed at reducing internal weaknesses & avoiding environmental threats WT Strategies Strengths Weaknesses Opportunities Threats SWOT
  • 17.
    SWOT Matrix Developingthe SWOT List firm’s key internal Strengths List firm’s key internal Weaknesses List firm’s key external Opportunities List firm’s key external Threats
  • 18.
    SWOT Matrix WT Strategies Minimize weaknesses and avoid threats ST Strategies Use strengths to avoid threats Threats – T List Threats WO Strategies Overcoming weaknesses by taking advantage of opportunities SO Strategies Use strengths to take advantage of opportunities Opportunities – O List Opportunities Weaknesses – W List Weaknesses Strengths – S List Strengths Leave Blank
  • 19.
    Key Internal FactorKey External Factor Resultant Strategy Matching Key Factors to Formulate Alternative Strategies Develop a new employee benefits package = Strong union activity (threat) + Poor employee morale (weakness) Develop new products for older adults = Decreasing numbers of young adults (threat) + Strong R&D (strength) Pursue horizontal integration by buying competitor's facilities = Exit of two major foreign competitors form the industry (opportunity) + Insufficient capacity (weakness) Acquire Cellfone, Inc. = 20% annual growth in the cell phone industry (opportunity) + Excess working capital (strength)
  • 20.
    Strategy-Formulation Analytical FrameworkSWOT Matrix SPACE Matrix BCG Matrix IE Matrix Grand Strategy Matrix Stage 2: The Matching Stage
  • 21.
    SPACE Matrix StrategicPosition & Action Evaluation Matrix Aggressive Conservative Defensive Competitive
  • 22.
    SPACE Matrix TwoInternal Dimensions Financial Strength (FS) Competitive Advantage (CA)
  • 23.
    SPACE Matrix TwoExternal Dimensions Environmental Stability (ES) Industry Strength (IS)
  • 24.
    SPACE Factors EnvironmentalStability (ES) Technological changes Rate of inflation Demand variability Price range of competing products Barriers to entry Competitive pressure Price elasticity of demand Ease of exit from market Risk involved in business Financial Strength (FS) Return on investment Leverage Liquidity Working capital Cash flow External Strategic Position Internal Strategic Position
  • 25.
    SPACE Factors IndustryStrength (IS) Growth potential Profit potential Financial stability Technological know-how Resource utilization Ease of entry into market Productivity, capacity utilization Competitive Advantage CA Market share Product quality Product life cycle Customer loyalty Competition’s capacity utilization Technological know-how Control over suppliers & distributors External Strategic Position Internal Strategic Position
  • 26.
    SPACE Matrix FS+6 +1 +5 +4 +3 +2 -6 -5 -4 -3 -2 -1 -6 -5 -4 -3 -2 -1 +1 +2 +3 +4 +5 +6 ES CA IS Conservative Aggressive Defensive Competitive
  • 27.
    Strategy-Formulation Analytical FrameworkSWOT Matrix SPACE Matrix BCG Matrix IE Matrix Grand Strategy Matrix Stage 2: The Matching Stage
  • 28.
    BCG Matrix BostonConsulting Group Matrix Enhances multi-divisional firm in formulating strategies Autonomous divisions = business portfolio Divisions may compete in different industries Focus on market-share position & industry growth rate
  • 29.
    BCG Matrix RelativeMarket Share Position Ratio of a division’s own market share in an industry to the market share held by the largest rival firm in that industry.
  • 30.
    BCG Matrix RelativeMarket Share Position High 1.0 Medium .50 Low 0.0 Industry Sales Growth Rate High +20 Low -20 Medium 0 Dogs IV Cash Cows III Question Marks I Stars II
  • 31.
    BCG Matrix QuestionMarks Low relative market share – compete in high-growth industry Cash needs are high Case generation is low Decision to strengthen (intensive strategies) or divest
  • 32.
    BCG Matrix StarsHigh relative market share and high growth rate Best long-run opportunities for growth & profitability Substantial investment to maintain or strengthen dominant position Integration strategies, intensive strategies, joint ventures
  • 33.
    BCG Matrix CashCows High relative market share, competes in low-growth industry Generate cash in excess of their needs Milked for other purposes Maintain strong position as long as possible Product development, concentric diversification If weakens—retrenchment or divestiture
  • 34.
    BCG Matrix DogsLow relative market share & compete in slow or no market growth Weak internal & external position Liquidation, divestiture, retrenchment
  • 35.
    Strategy-Formulation Analytical FrameworkSWOT Matrix SPACE Matrix BCG Matrix Grand Strategy Matrix Stage 2: The Matching Stage
  • 36.
    Grand Strategy MatrixTool for formulating alternative strategies Based on two dimensions Competitive position Market growth
  • 37.
    Quadrant IV Concentricdiversification Horizontal diversification Conglomerate diversification Joint ventures Quadrant III Retrenchment Concentric diversification Horizontal diversification Conglomerate diversification Liquidation Quadrant I Market development Market penetration Product development Forward integration Backward integration Horizontal integration Concentric diversification Quadrant II Market development Market penetration Product development Horizontal integration Divestiture Liquidation RAPID MARKET GROWTH SLOW MARKET GROWTH WEAK COMPETITIVE POSITION STRONG COMPETITIVE POSITION
  • 38.
    Grand Strategy MatrixExcellent strategic position Concentration on current markets/products Take risks aggressively when necessary Quadrant I
  • 39.
    Grand Strategy MatrixEvaluate present approach How to improve competitiveness Rapid market growth requires intensive strategy Quadrant II
  • 40.
    Grand Strategy MatrixCompete in slow-growth industries Weak competitive position Drastic changes quickly Cost & asset reduction (retrenchment) Quadrant III
  • 41.
    Grand Strategy MatrixStrong competitive position Slow-growth industry Diversification to more promising growth areas Quadrant IV
  • 42.
    Strategy-Formulation Analytical FrameworkStage 3: The Decision Stage Quantitative Strategic Planning Matrix (QSPM)
  • 43.
    QSPM Technique designedto determine the relative attractiveness of feasible alternative actions Quantitative Strategic Planning Matrix
  • 44.
    QSPM Strategic AlternativesKey Internal Factors Management Marketing Finance/Accounting Production/Operations Research and Development Computer Information Systems Strategy 3 Strategy 2 Strategy 1 Weight Key External Factors Economy Political/Legal/Governmental Social/Cultural/Demographic/Environmental Technological Competitive
  • 45.
    QSPM Requires intuitivejudgments & educated assumptions Only as good as the prerequisite inputs Limitations
  • 46.
    QSPM Sets ofstrategies considered simultaneously or sequentially Integration of pertinent external & internal factors in the decision making process Advantages
  • 47.
    Cultural Aspects ofStrategy Choice Successful strategies depend on the degree of consistency with the firm’s culture Organization Culture
  • 48.
    Politics of StrategyChoice Management hierarchy Career aspirations Allocation of scarce resources Politics in Organizations
  • 49.
    Politics of StrategyChoice Equifinality Satisfying Generalization Higher-order issues Political access on important issues Political tactics for strategists