Download to read offline


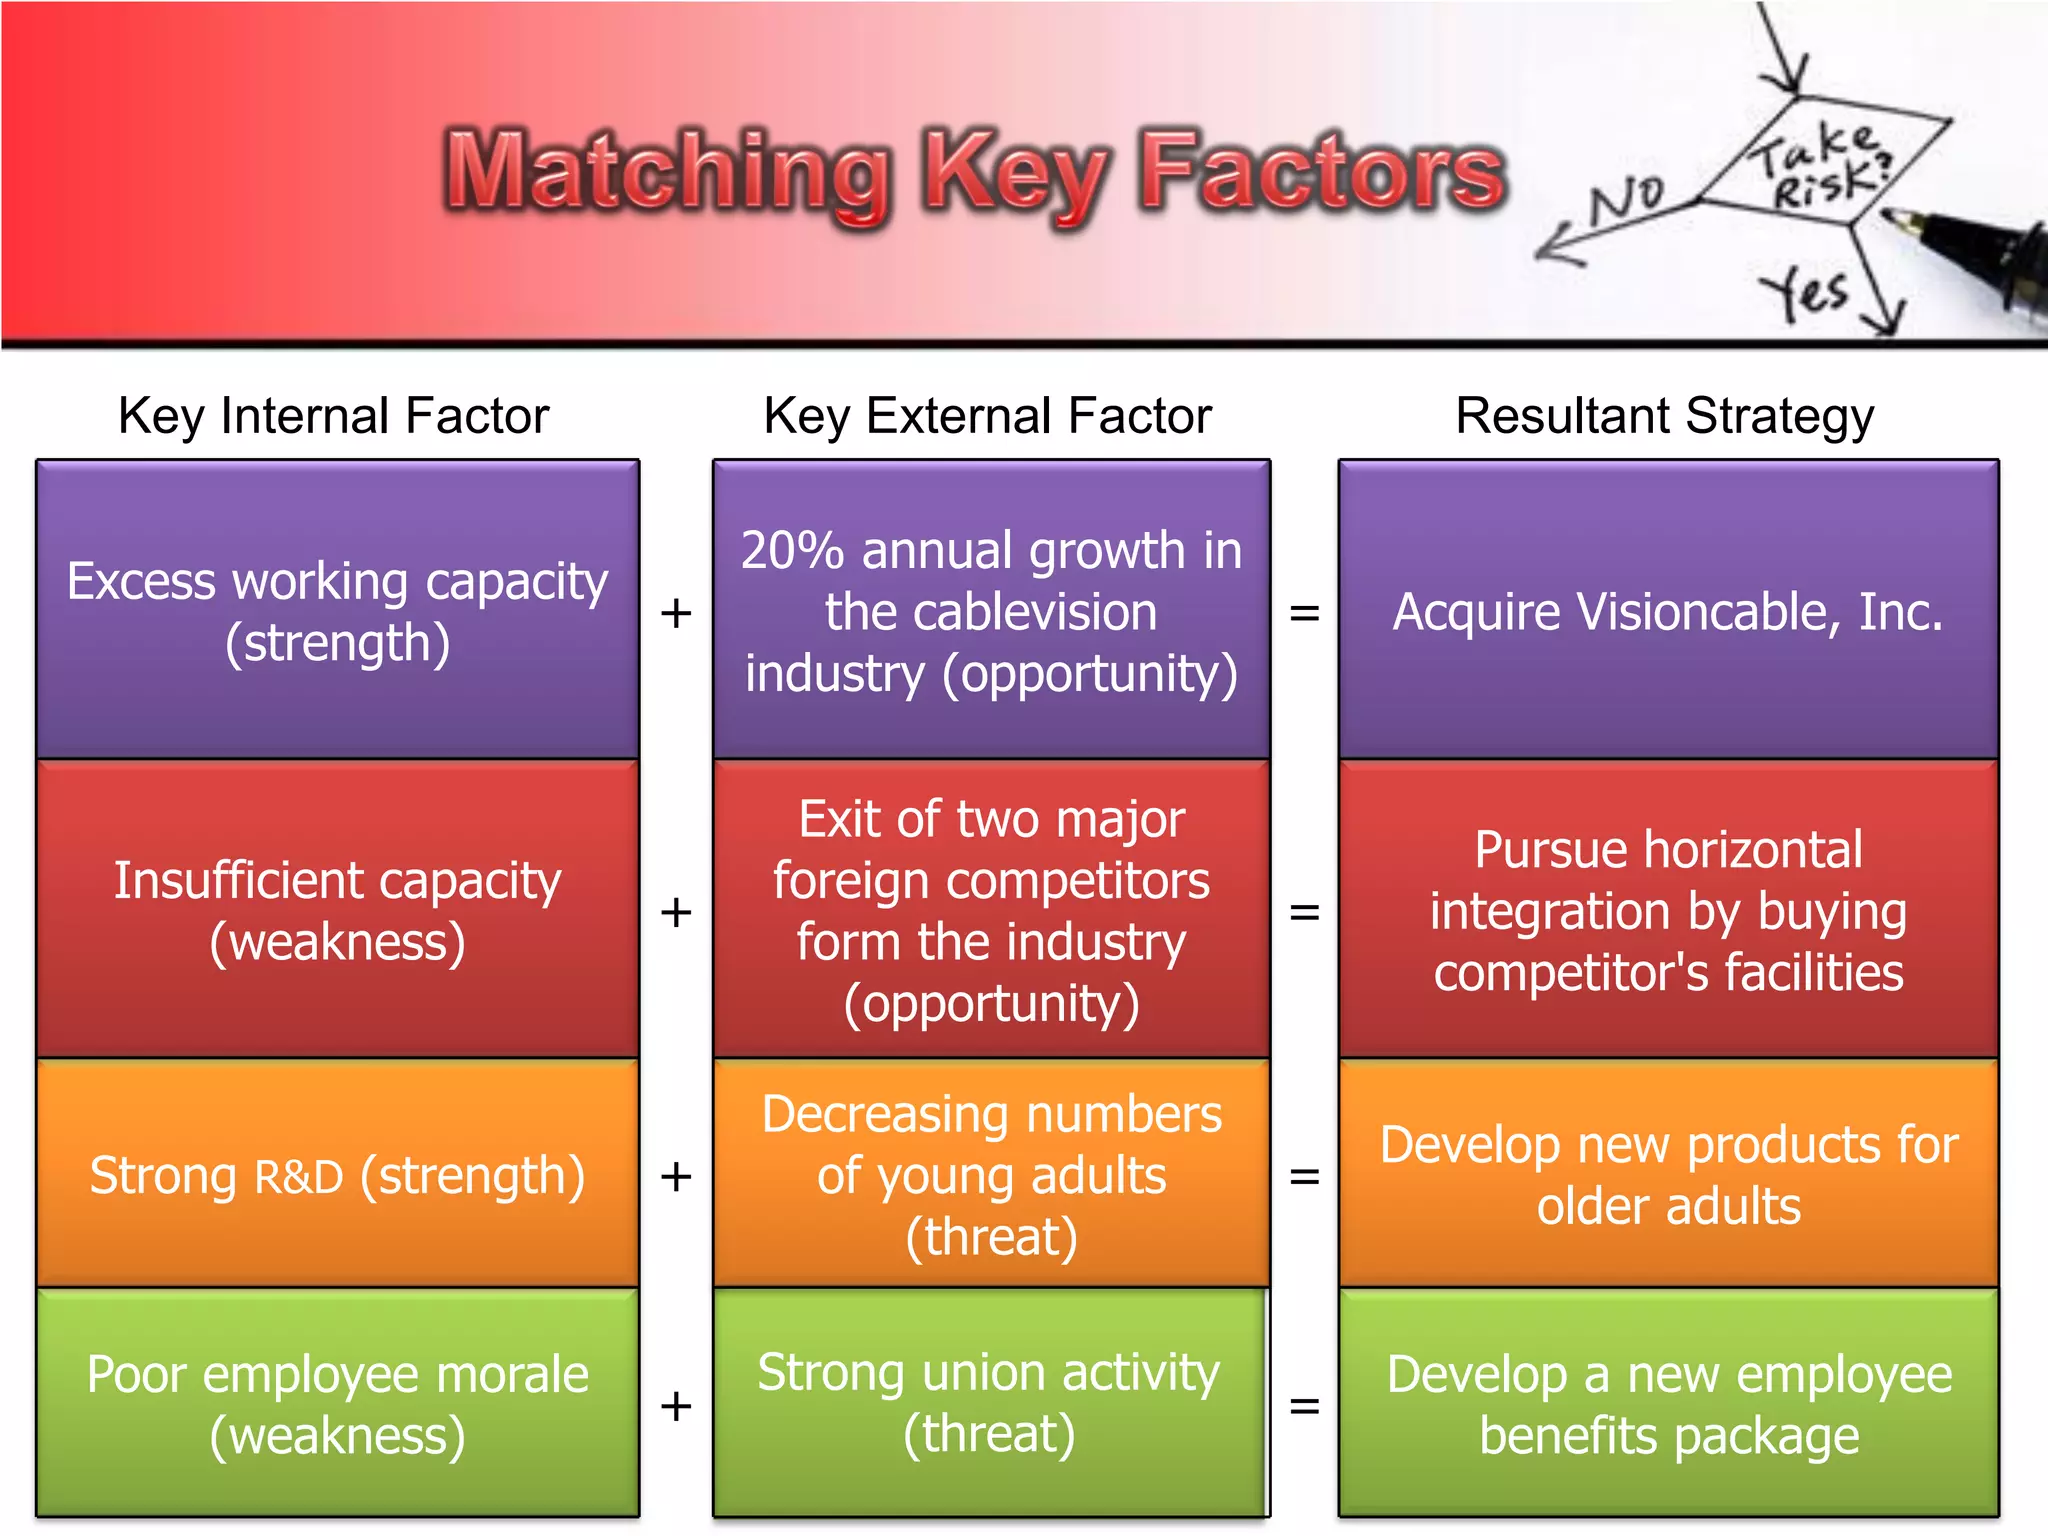


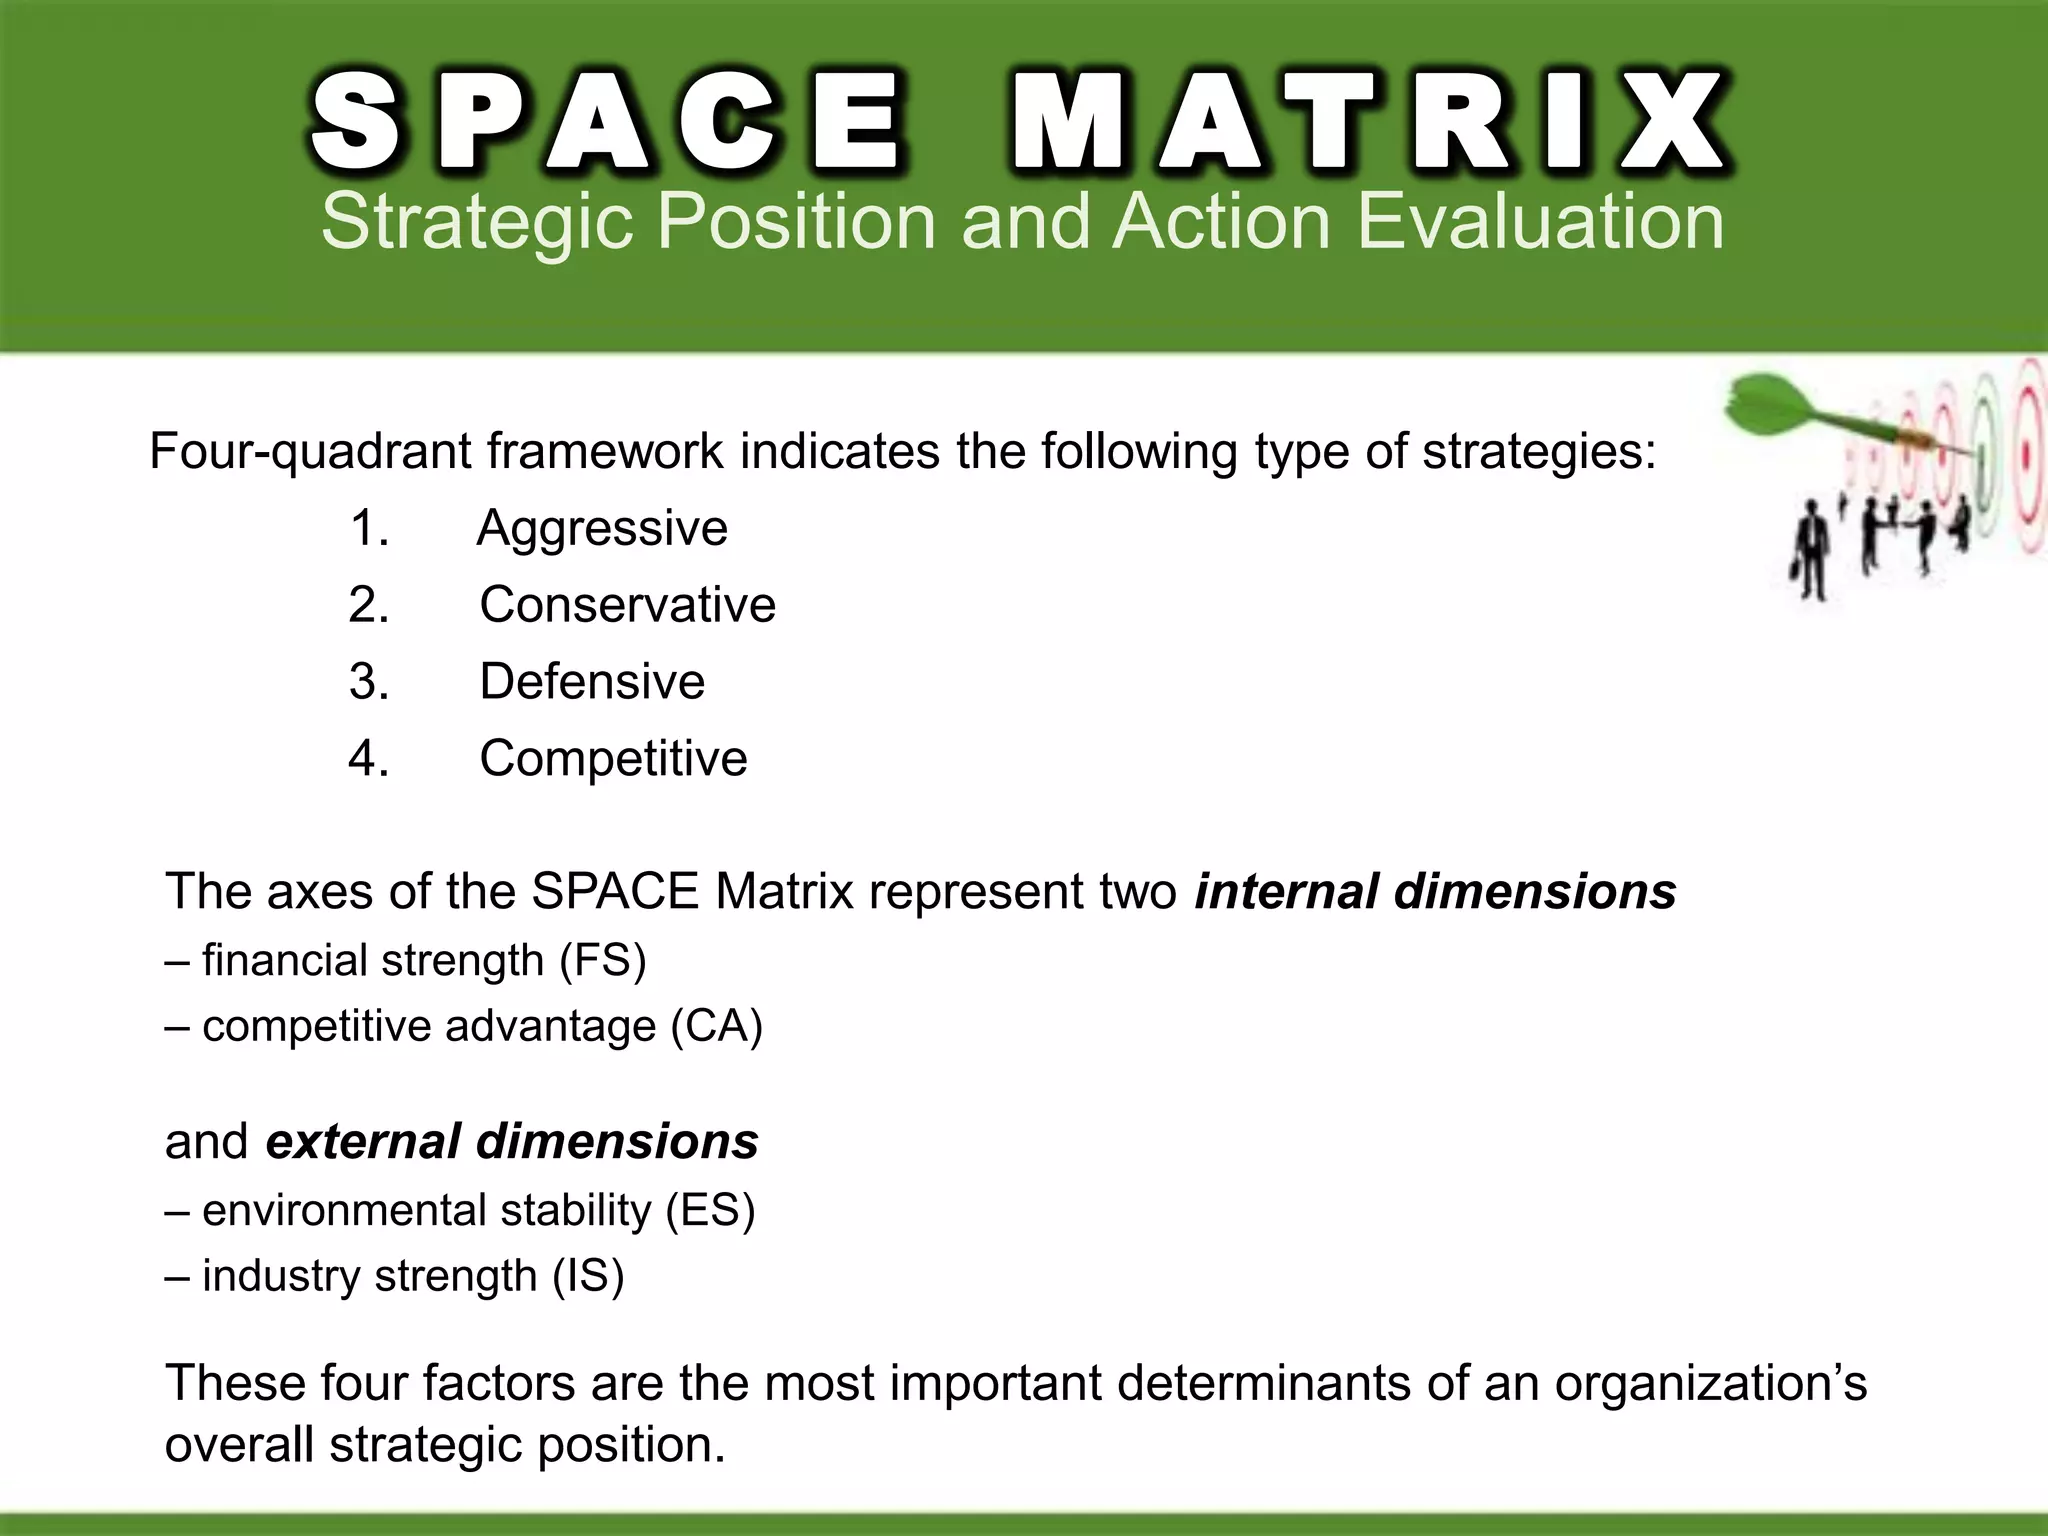
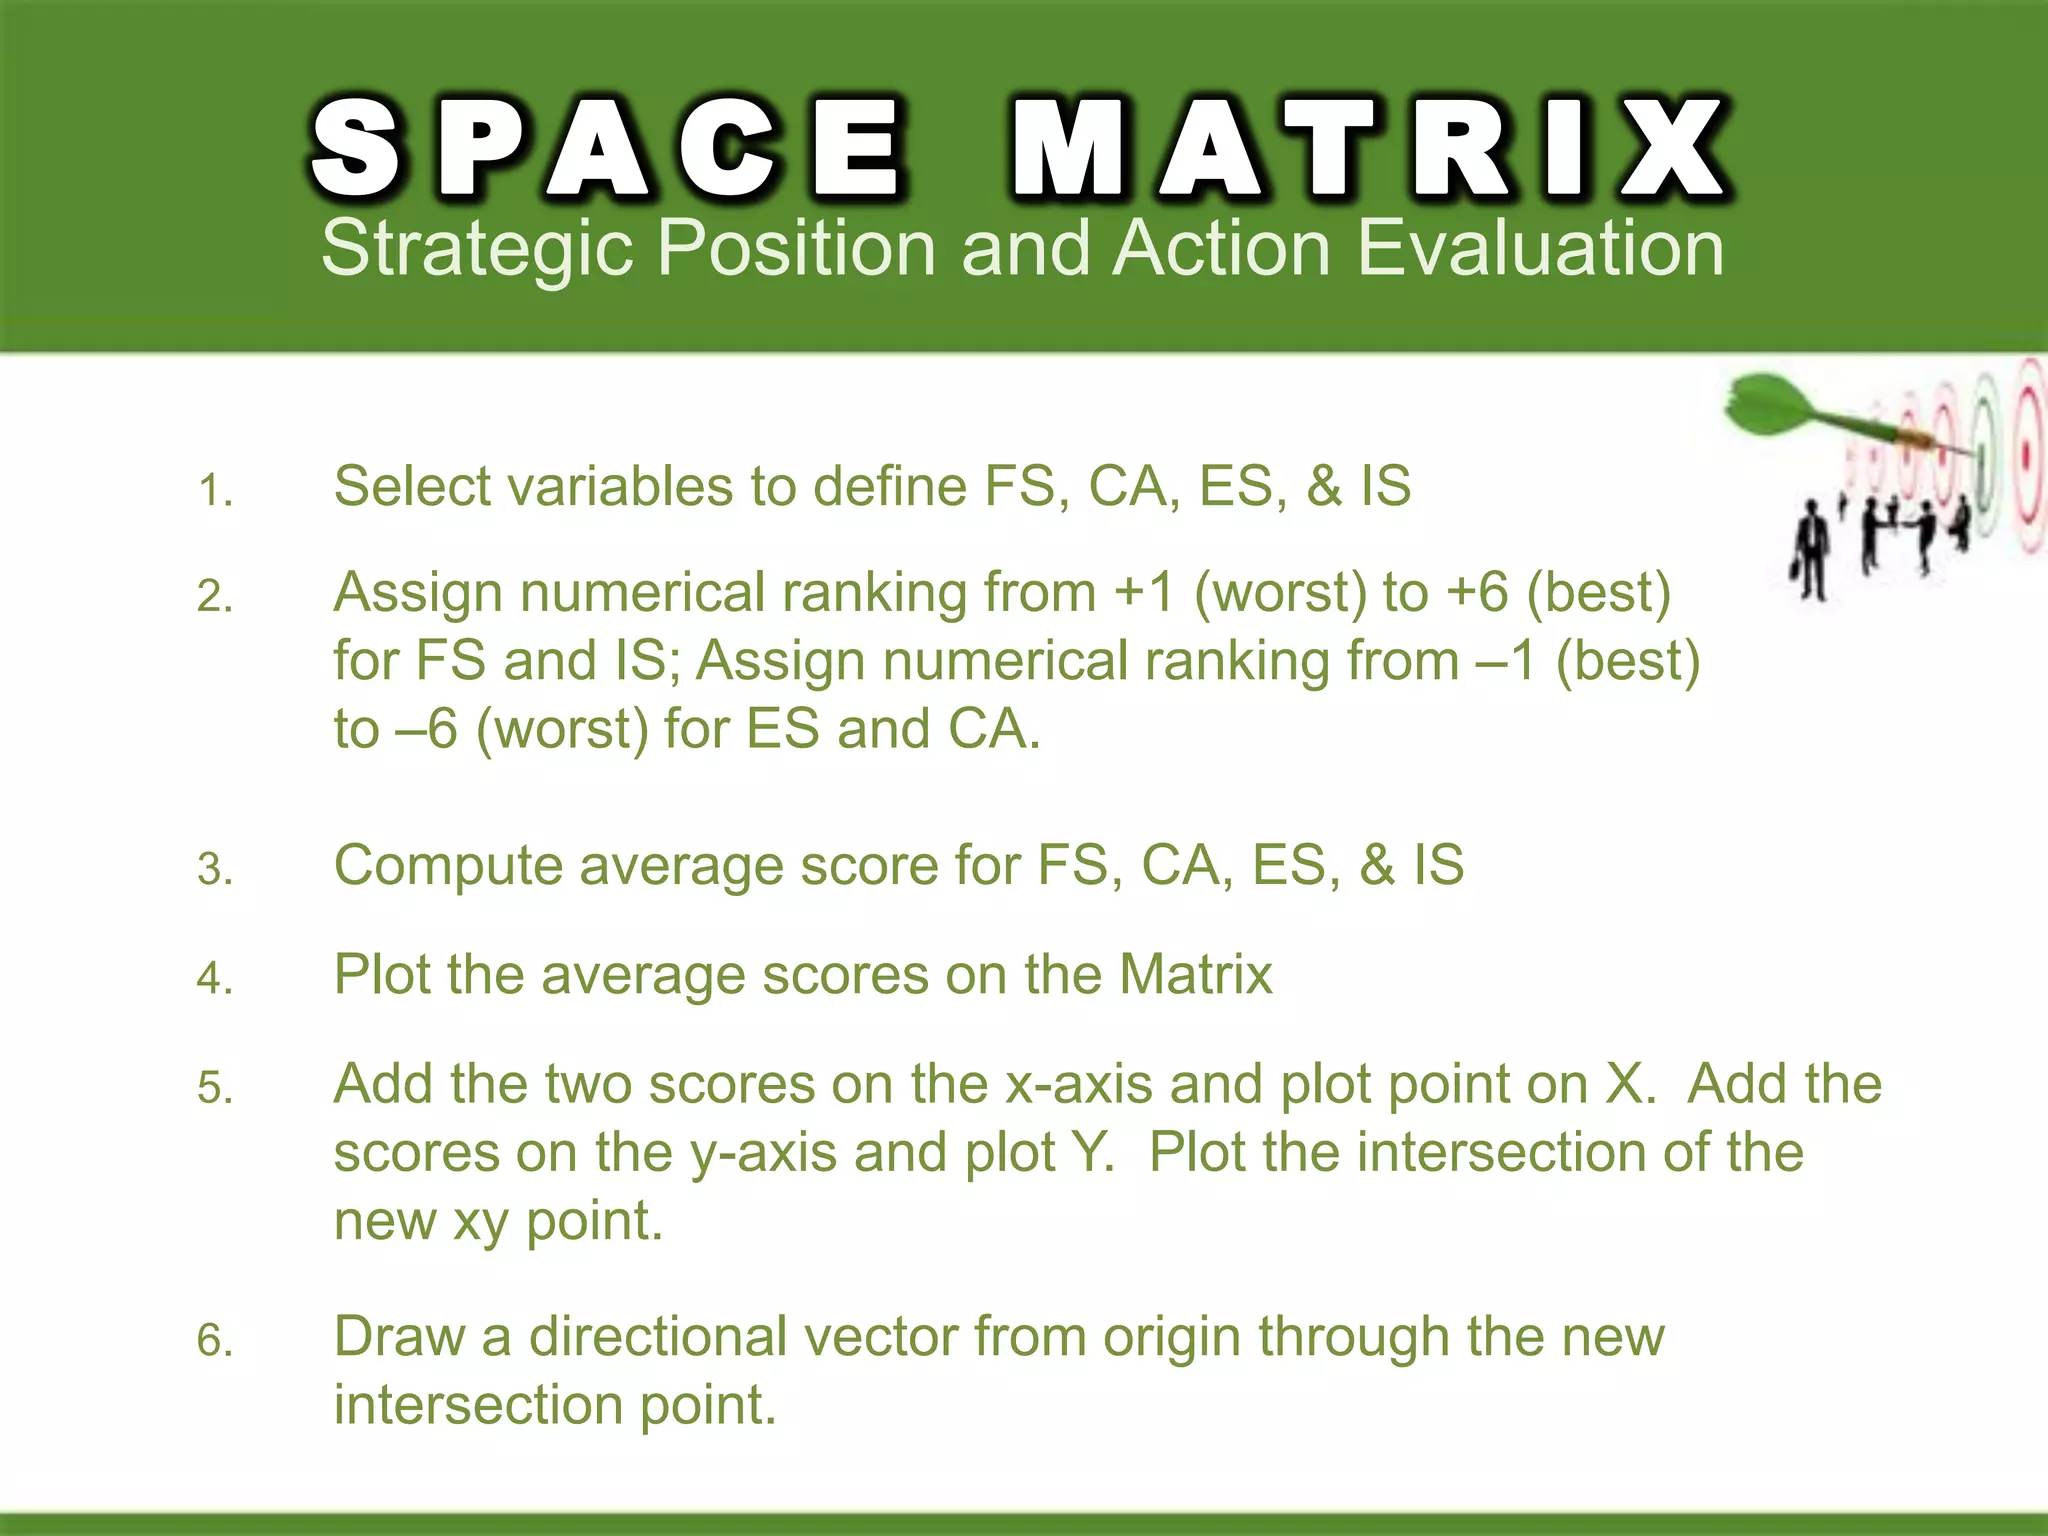

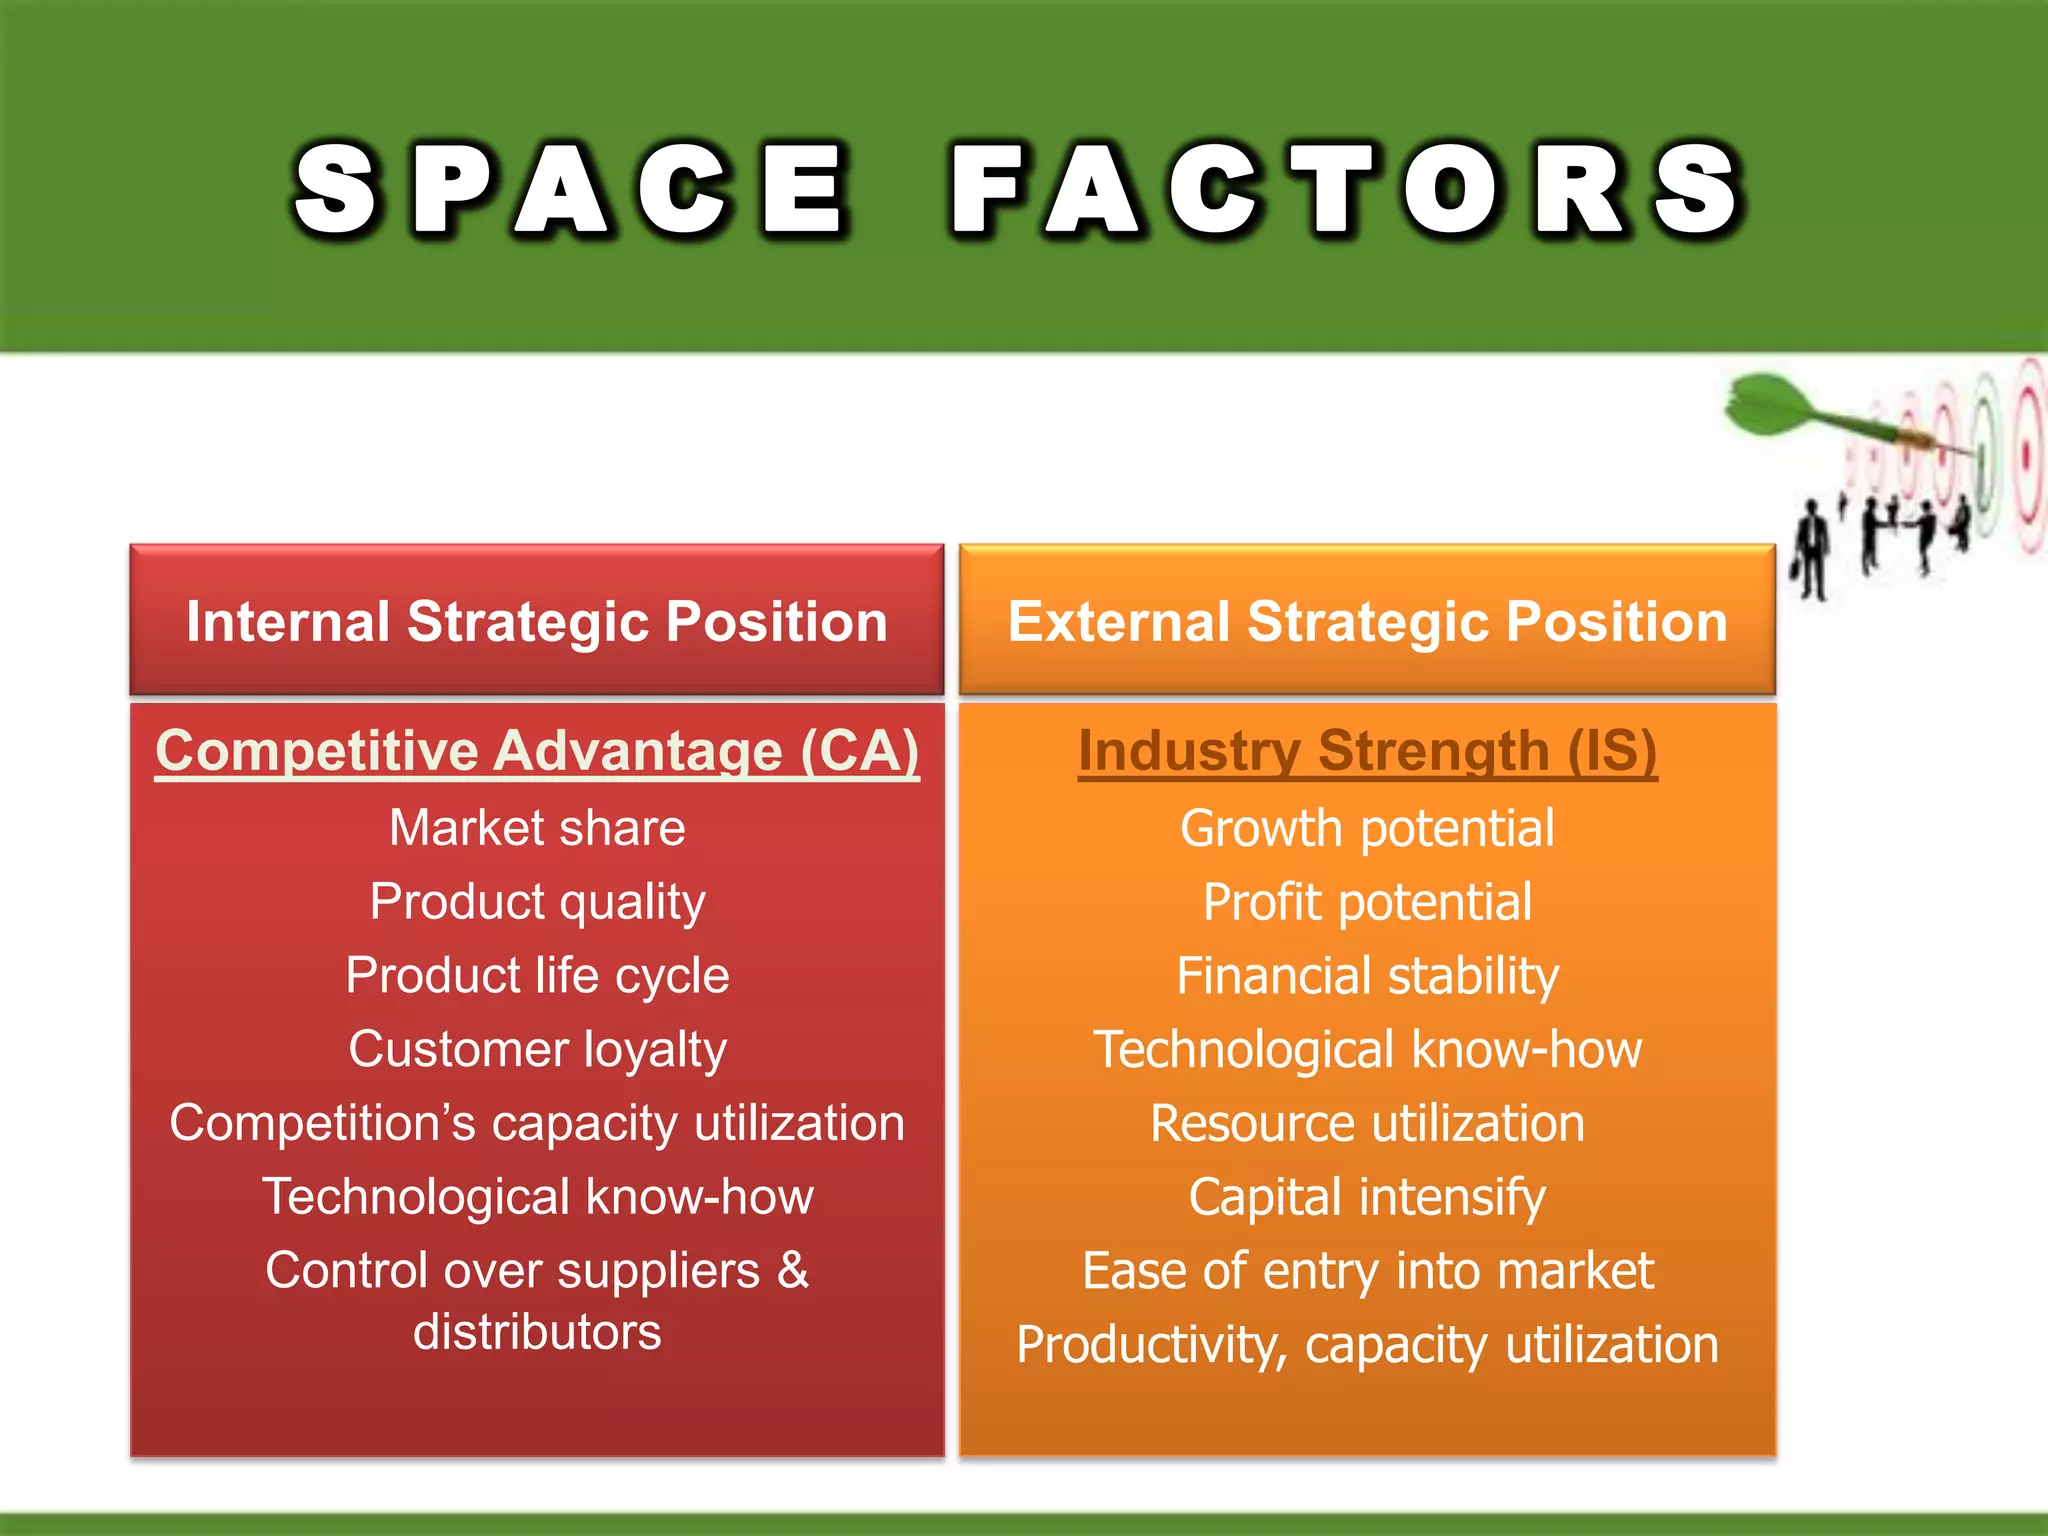


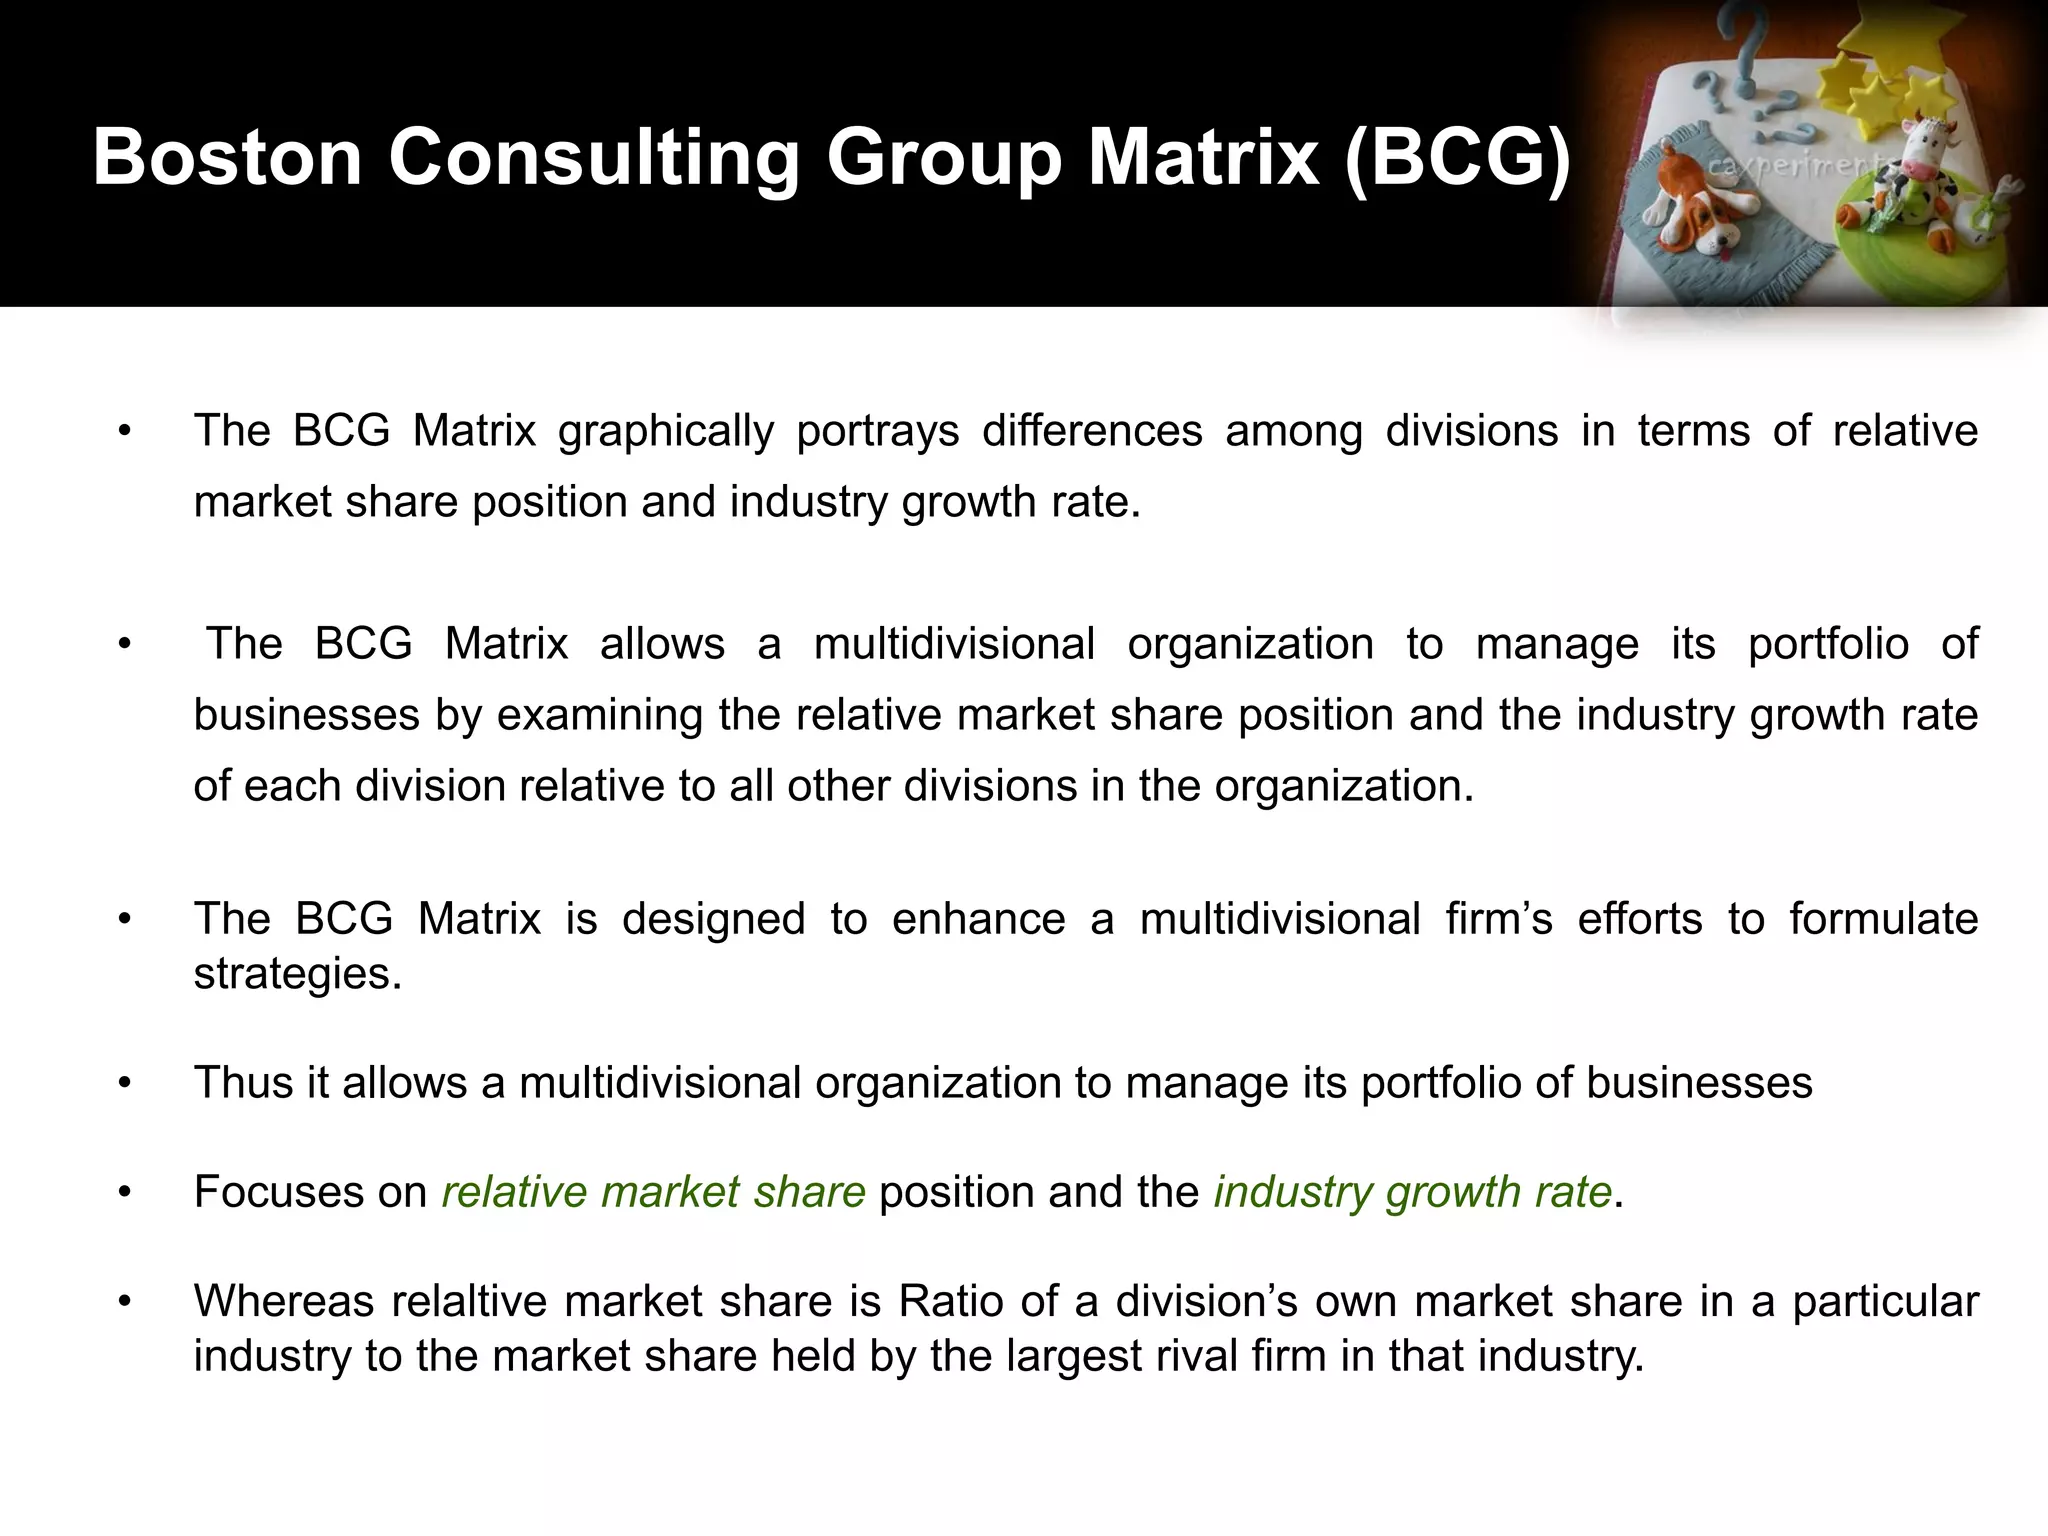
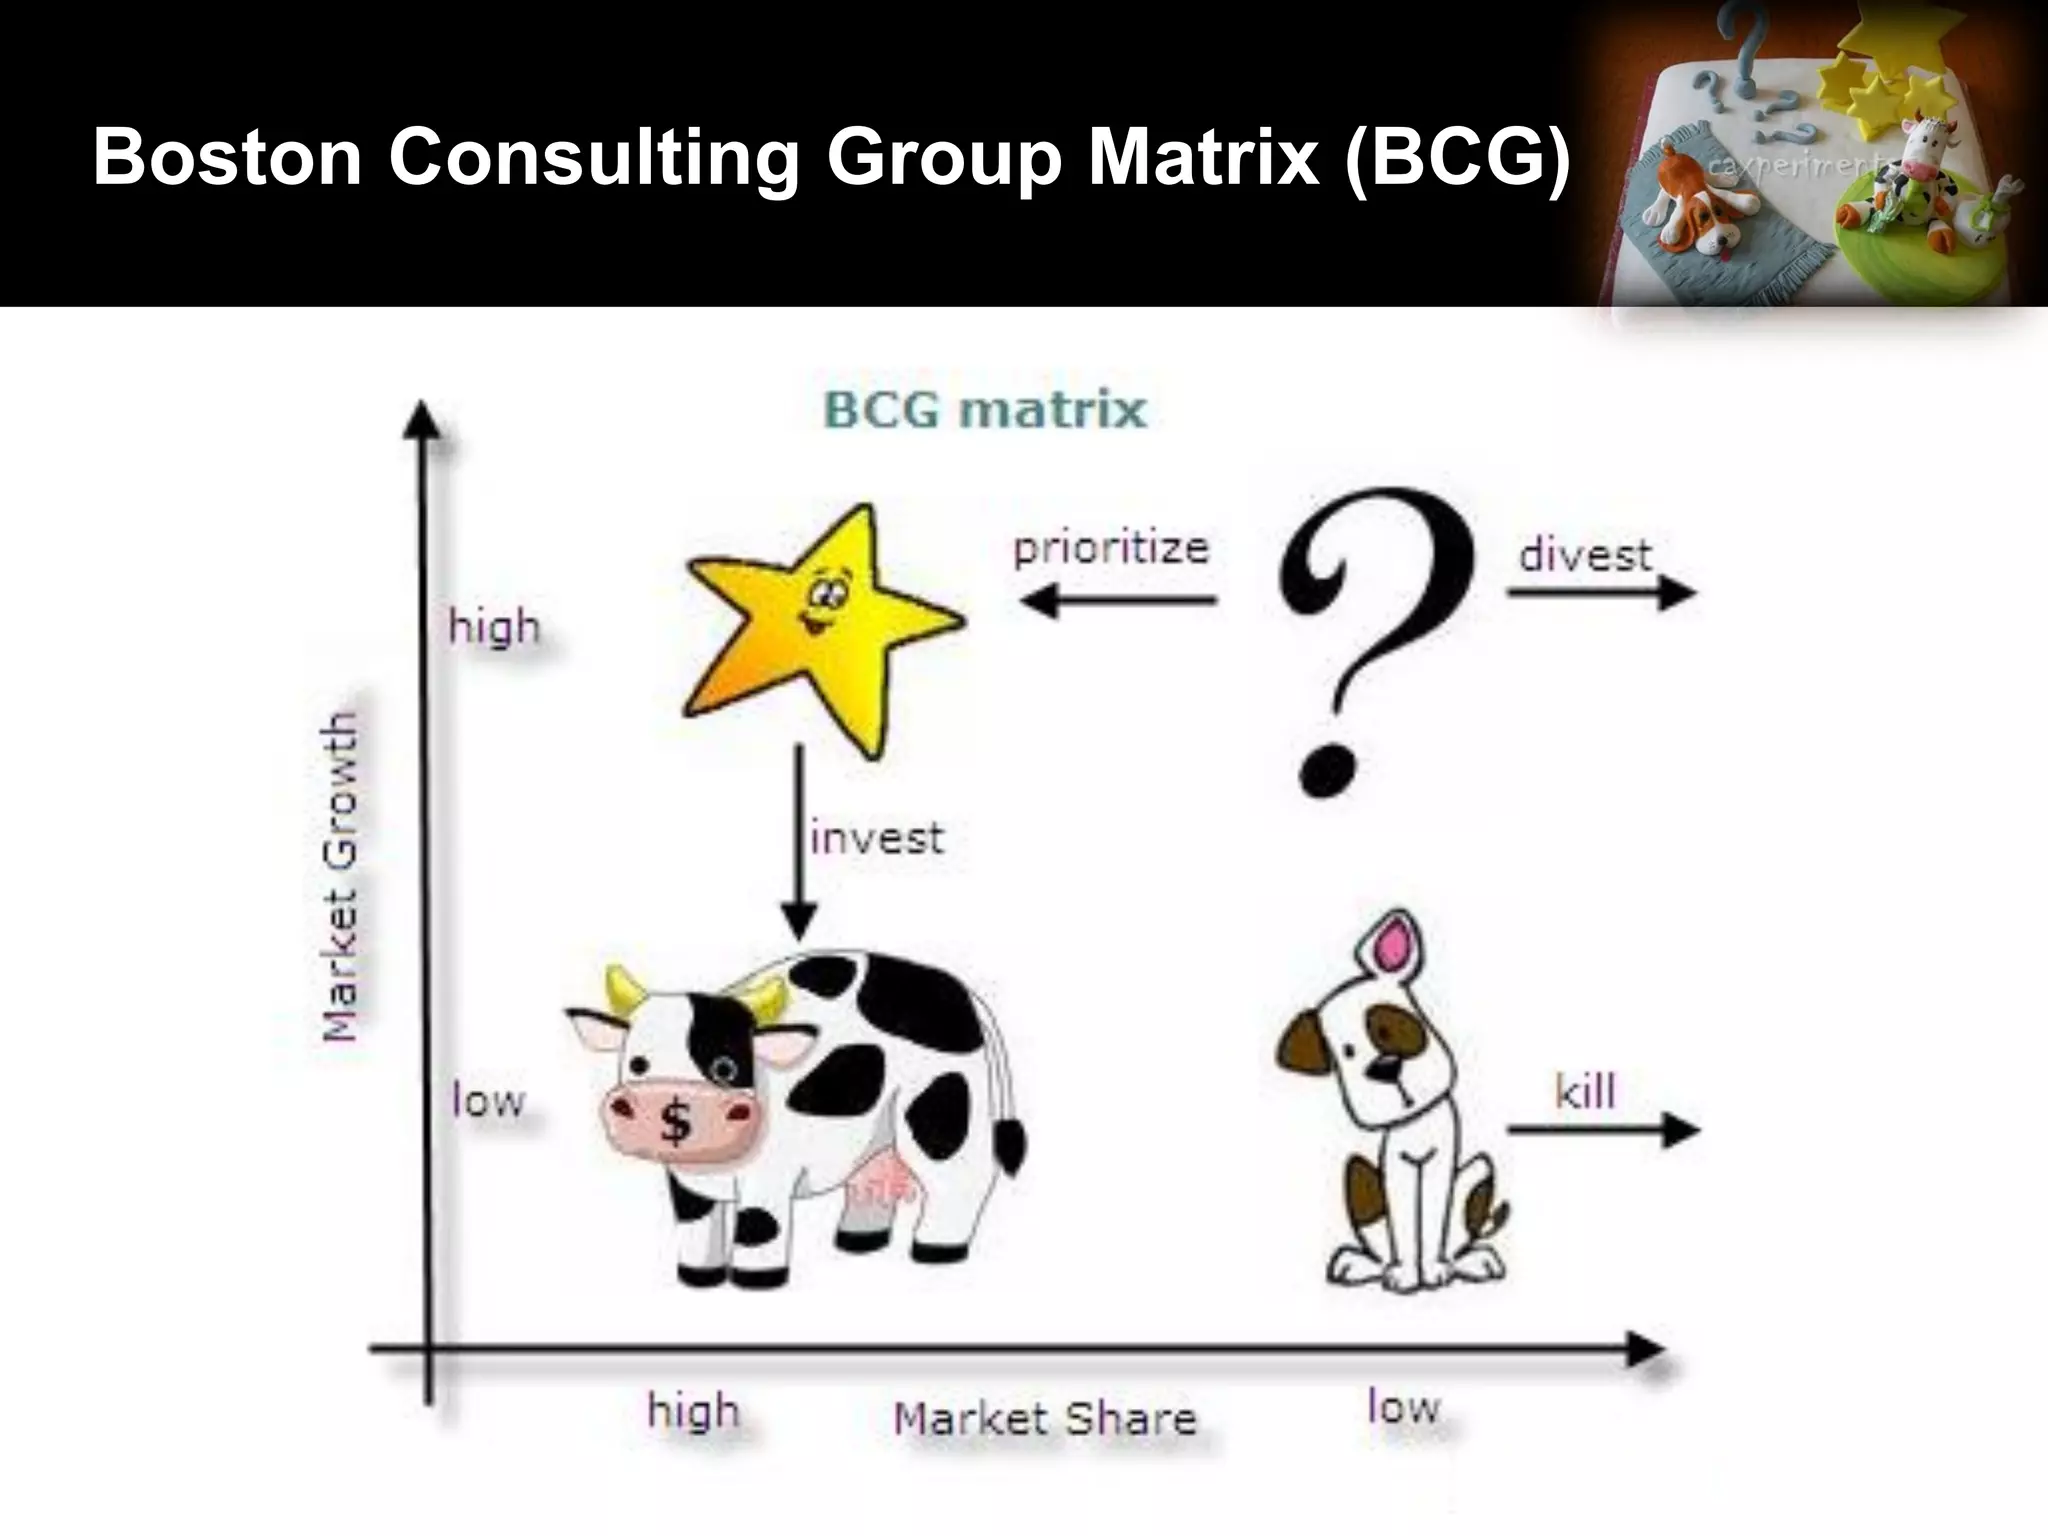


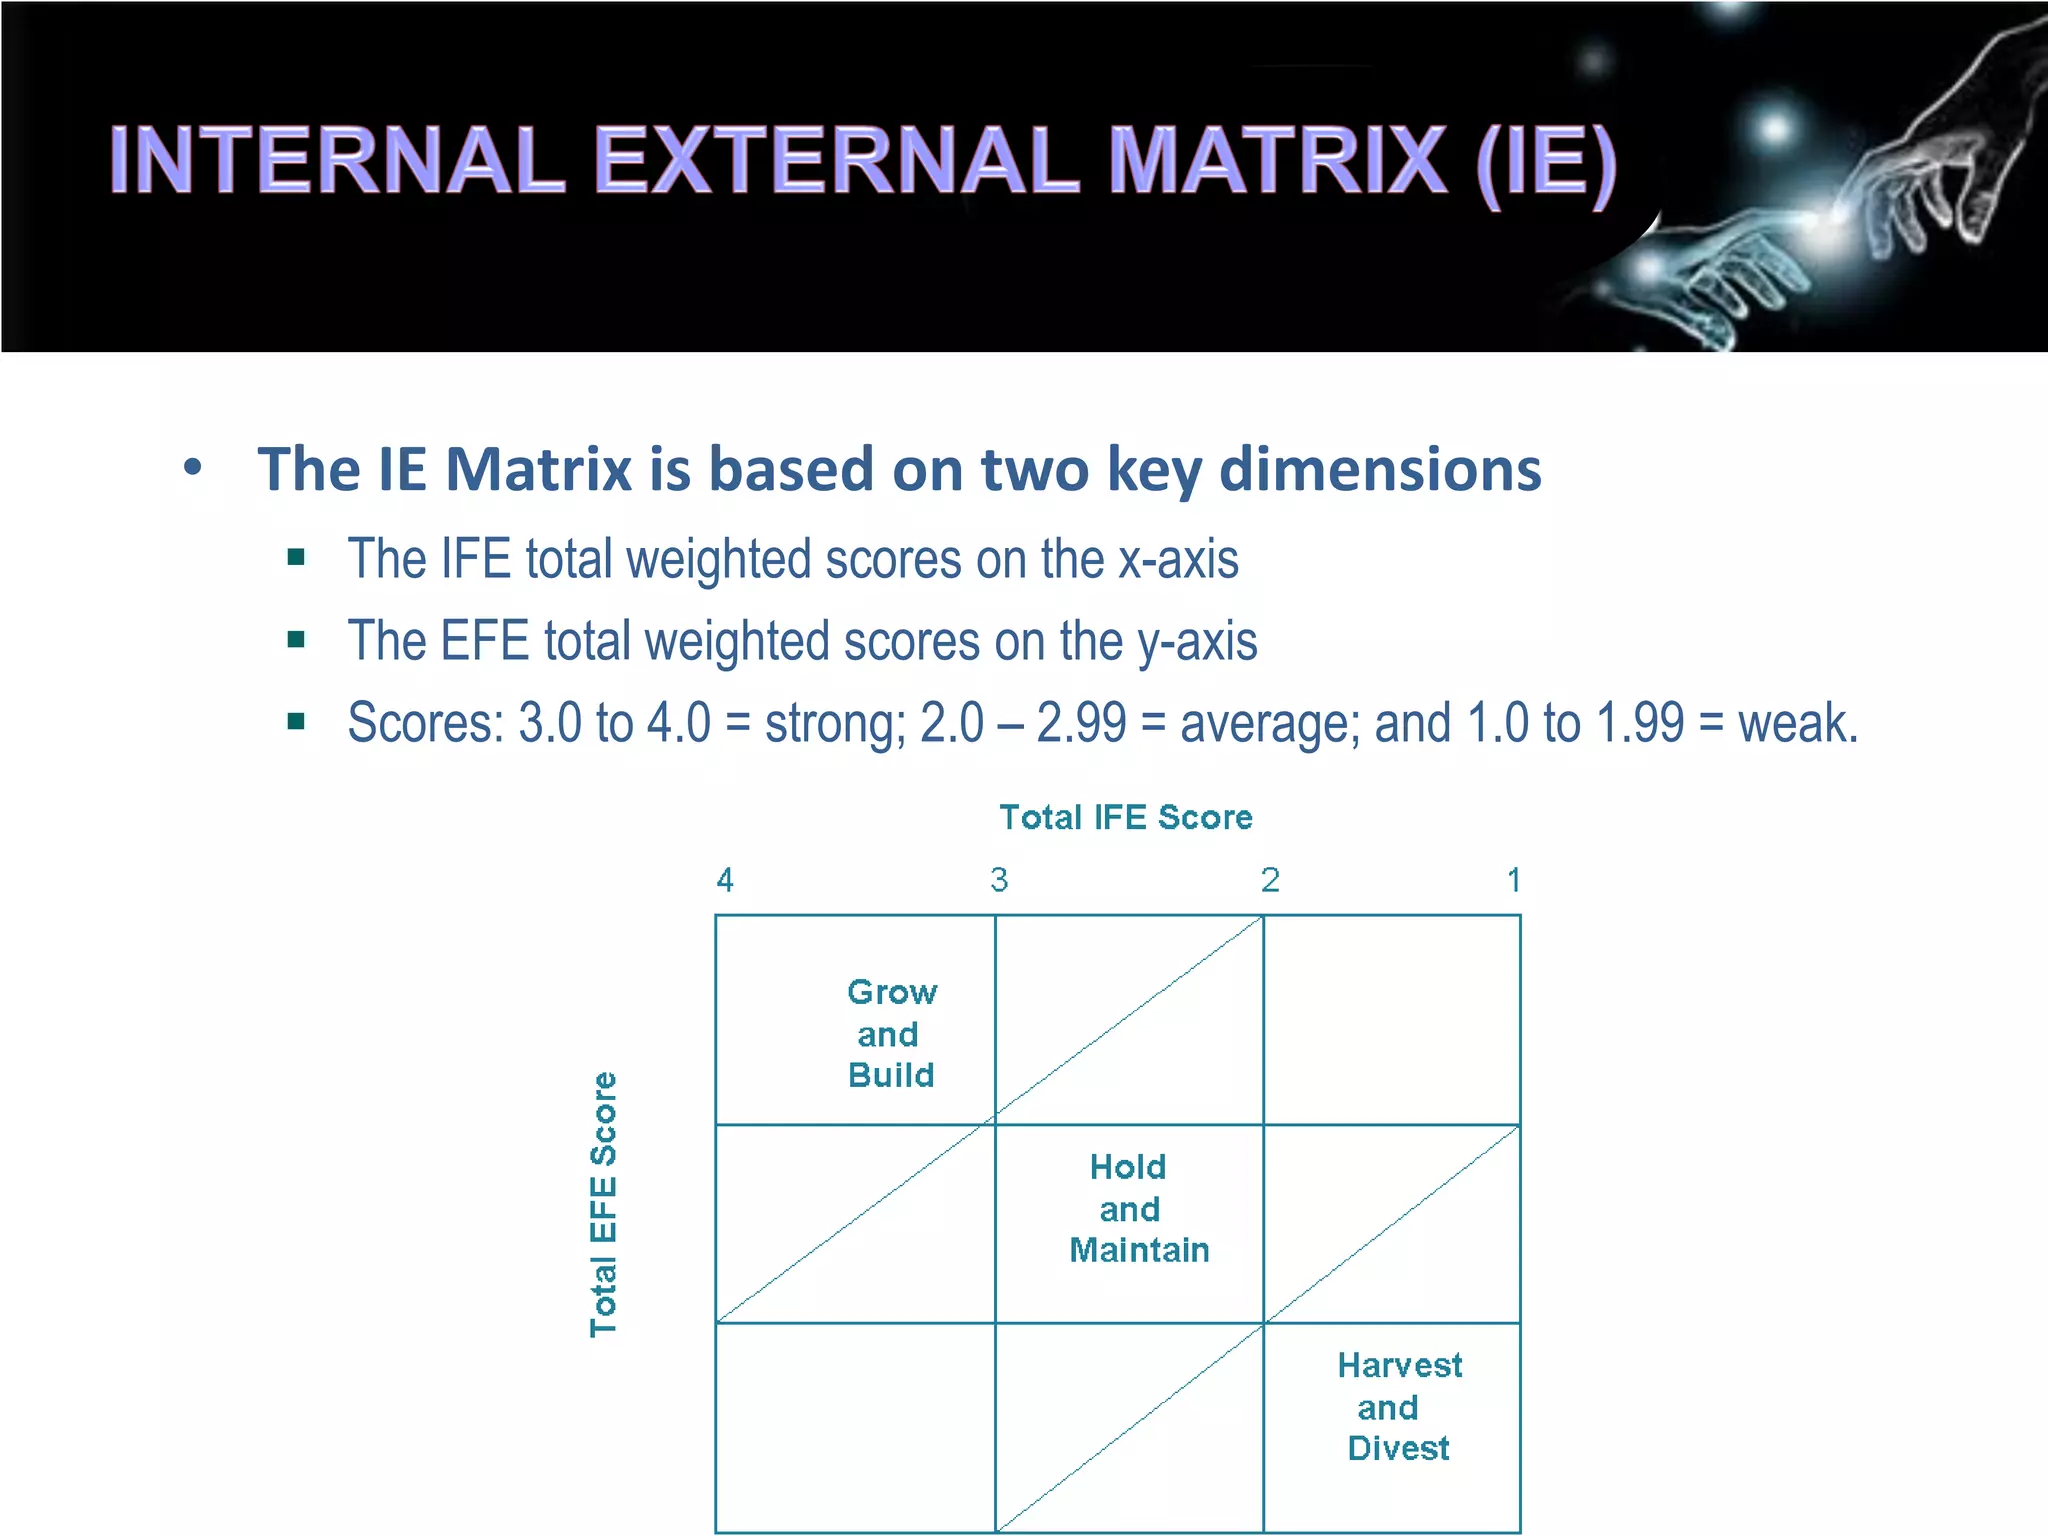

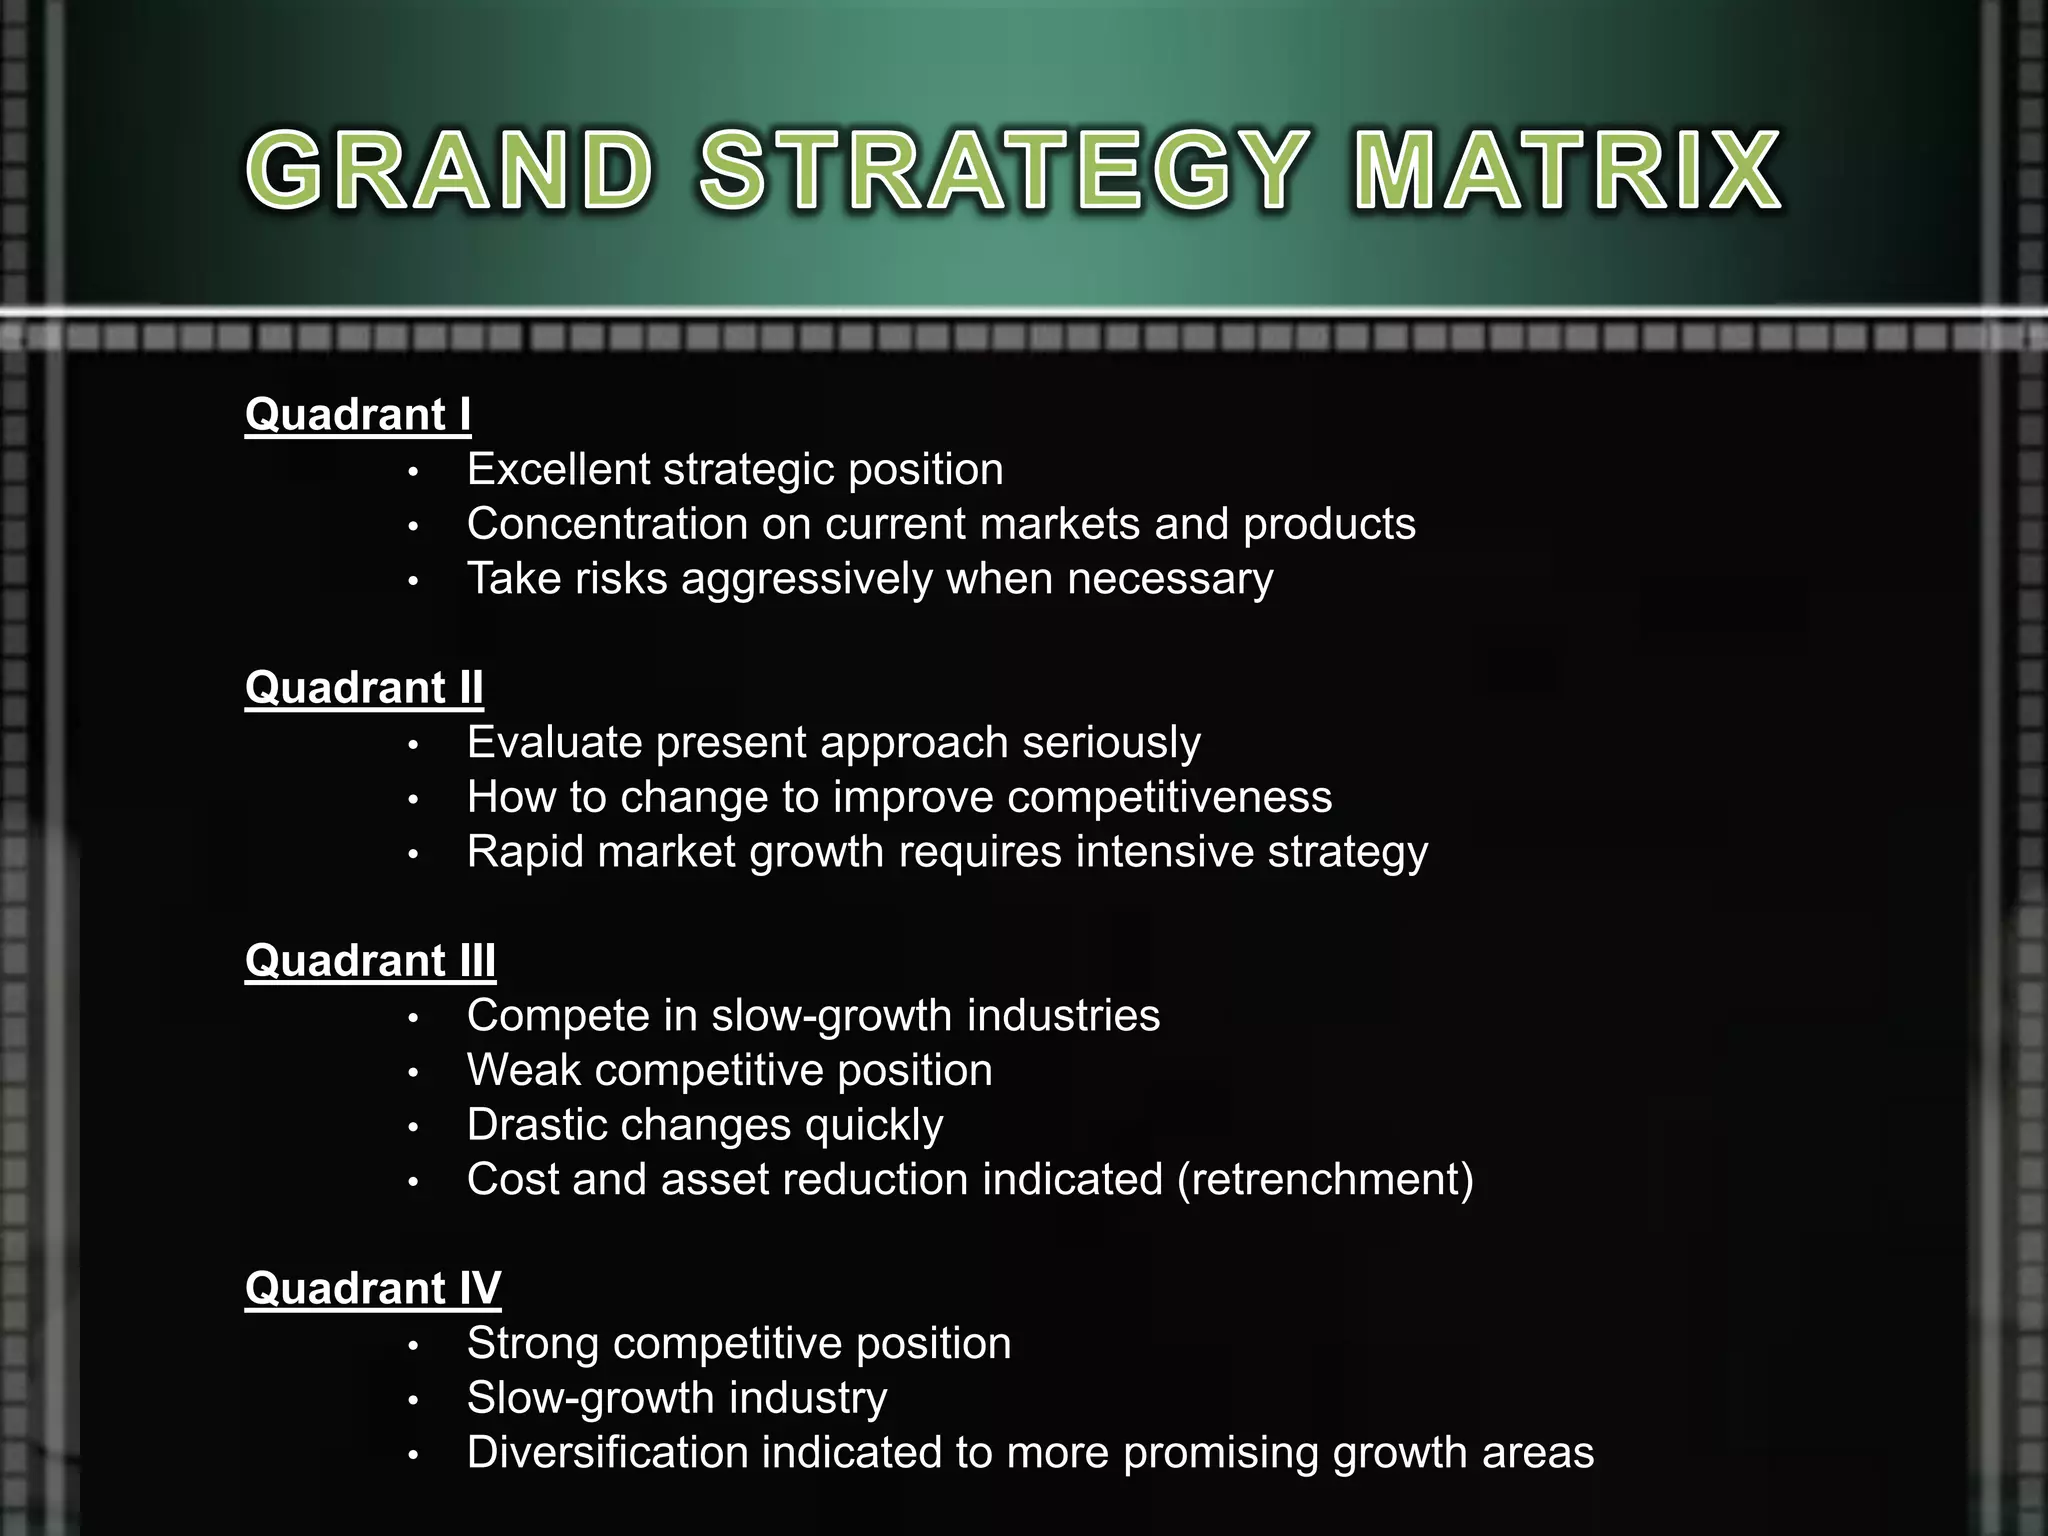


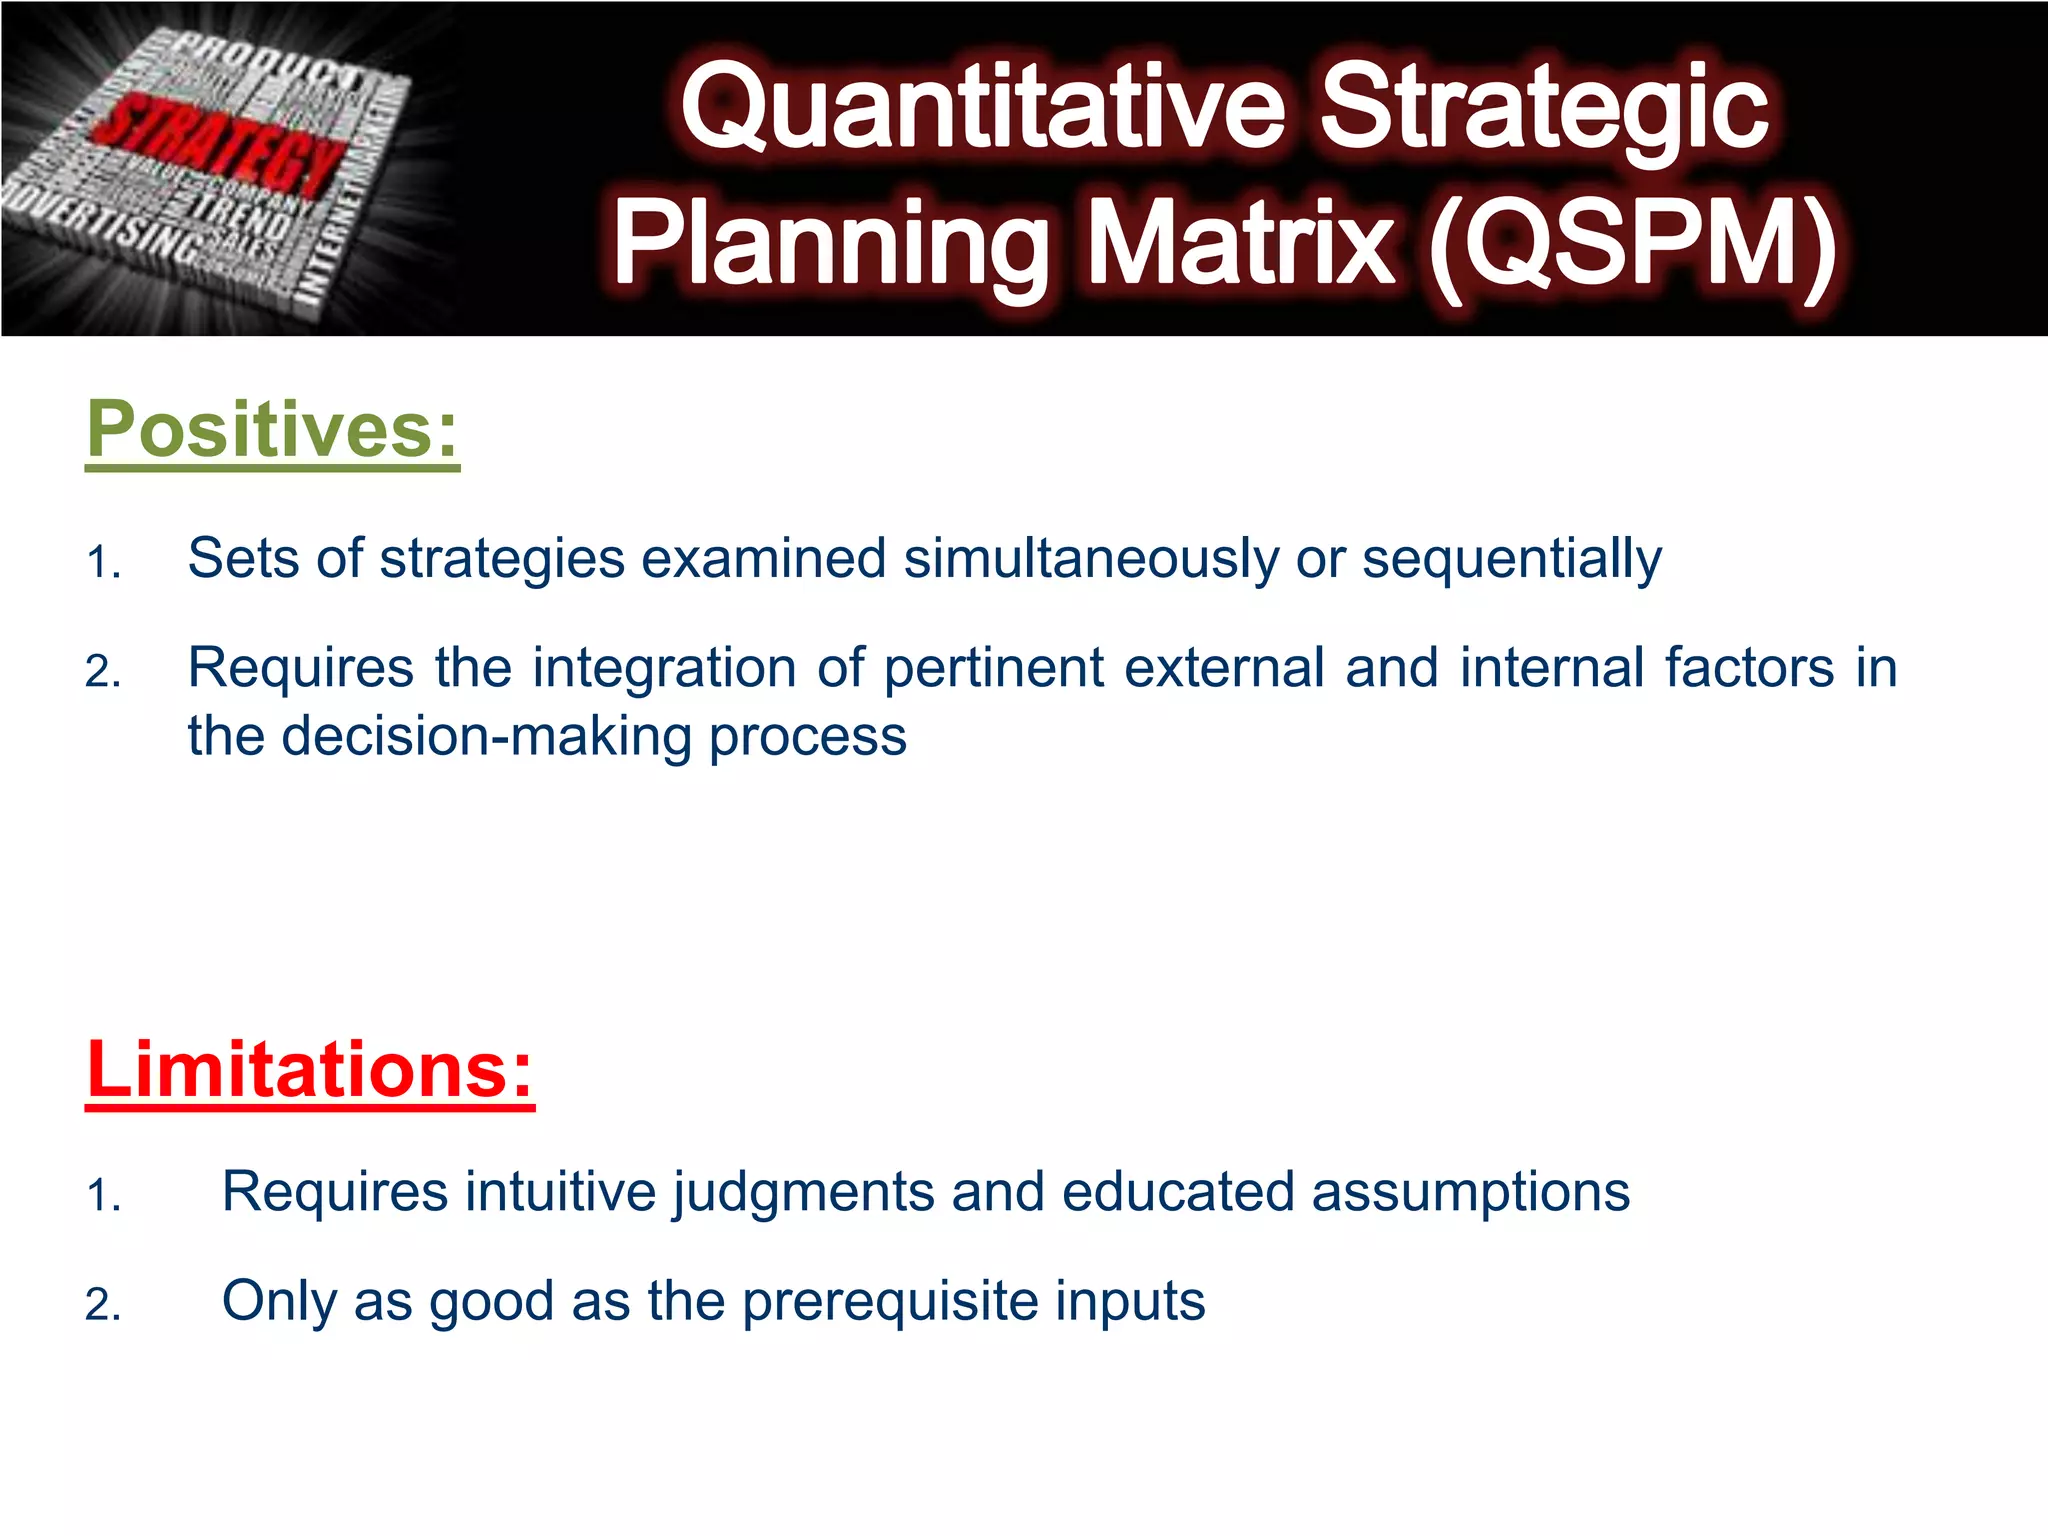

The document outlines several strategic planning and analysis tools including: 1. Developing alternative strategies and evaluating their advantages, disadvantages, and costs/benefits. 2. Using matrices like TOWS, SPACE, BCG, and IE to match internal strengths/weaknesses with external opportunities/threats and determine appropriate strategies. 3. Evaluating strategies using the Grand Strategy Matrix based on competitive position and market growth to identify strategies like market penetration, product development, divestment.


