Download as PDF, PPTX


![
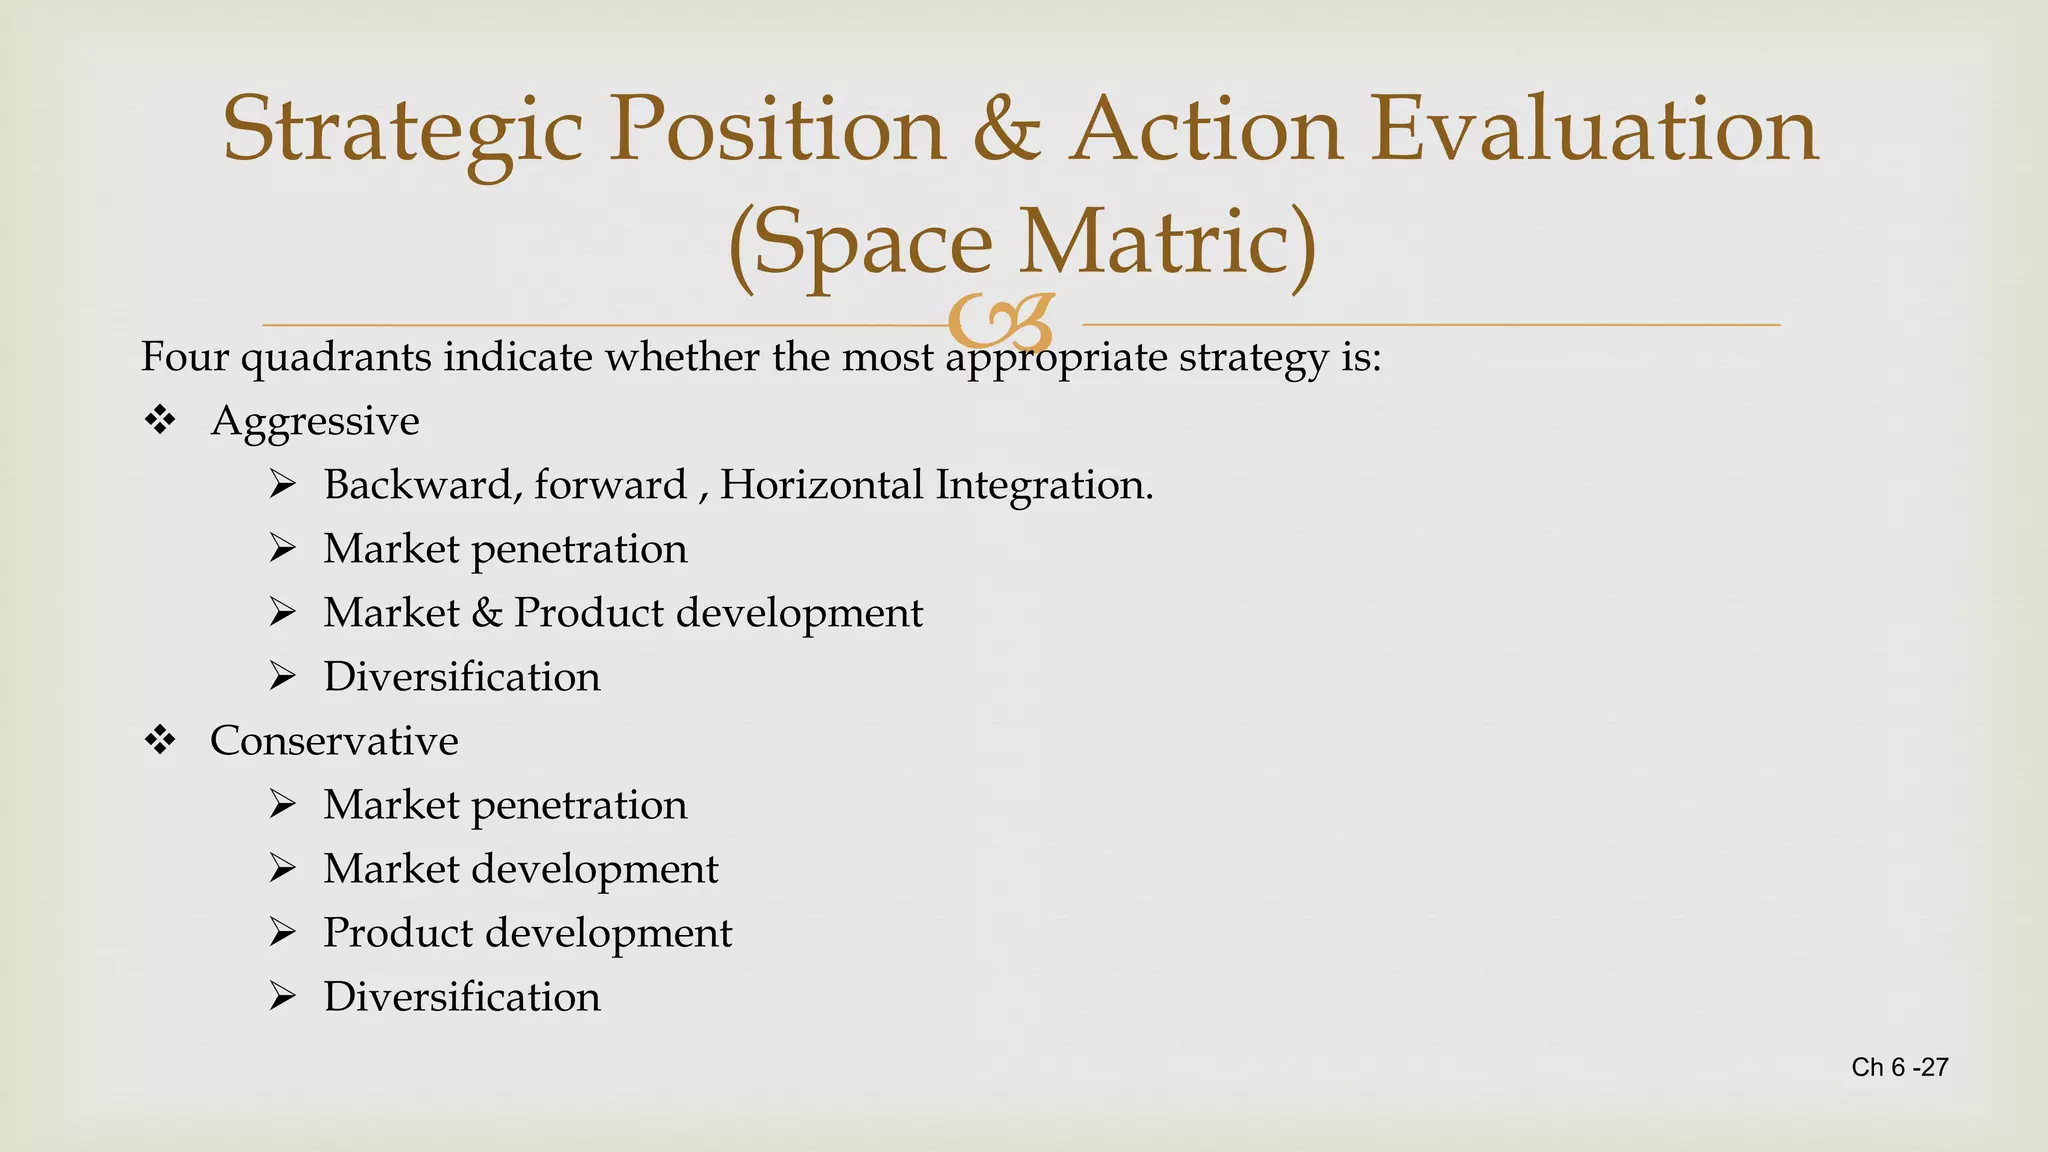
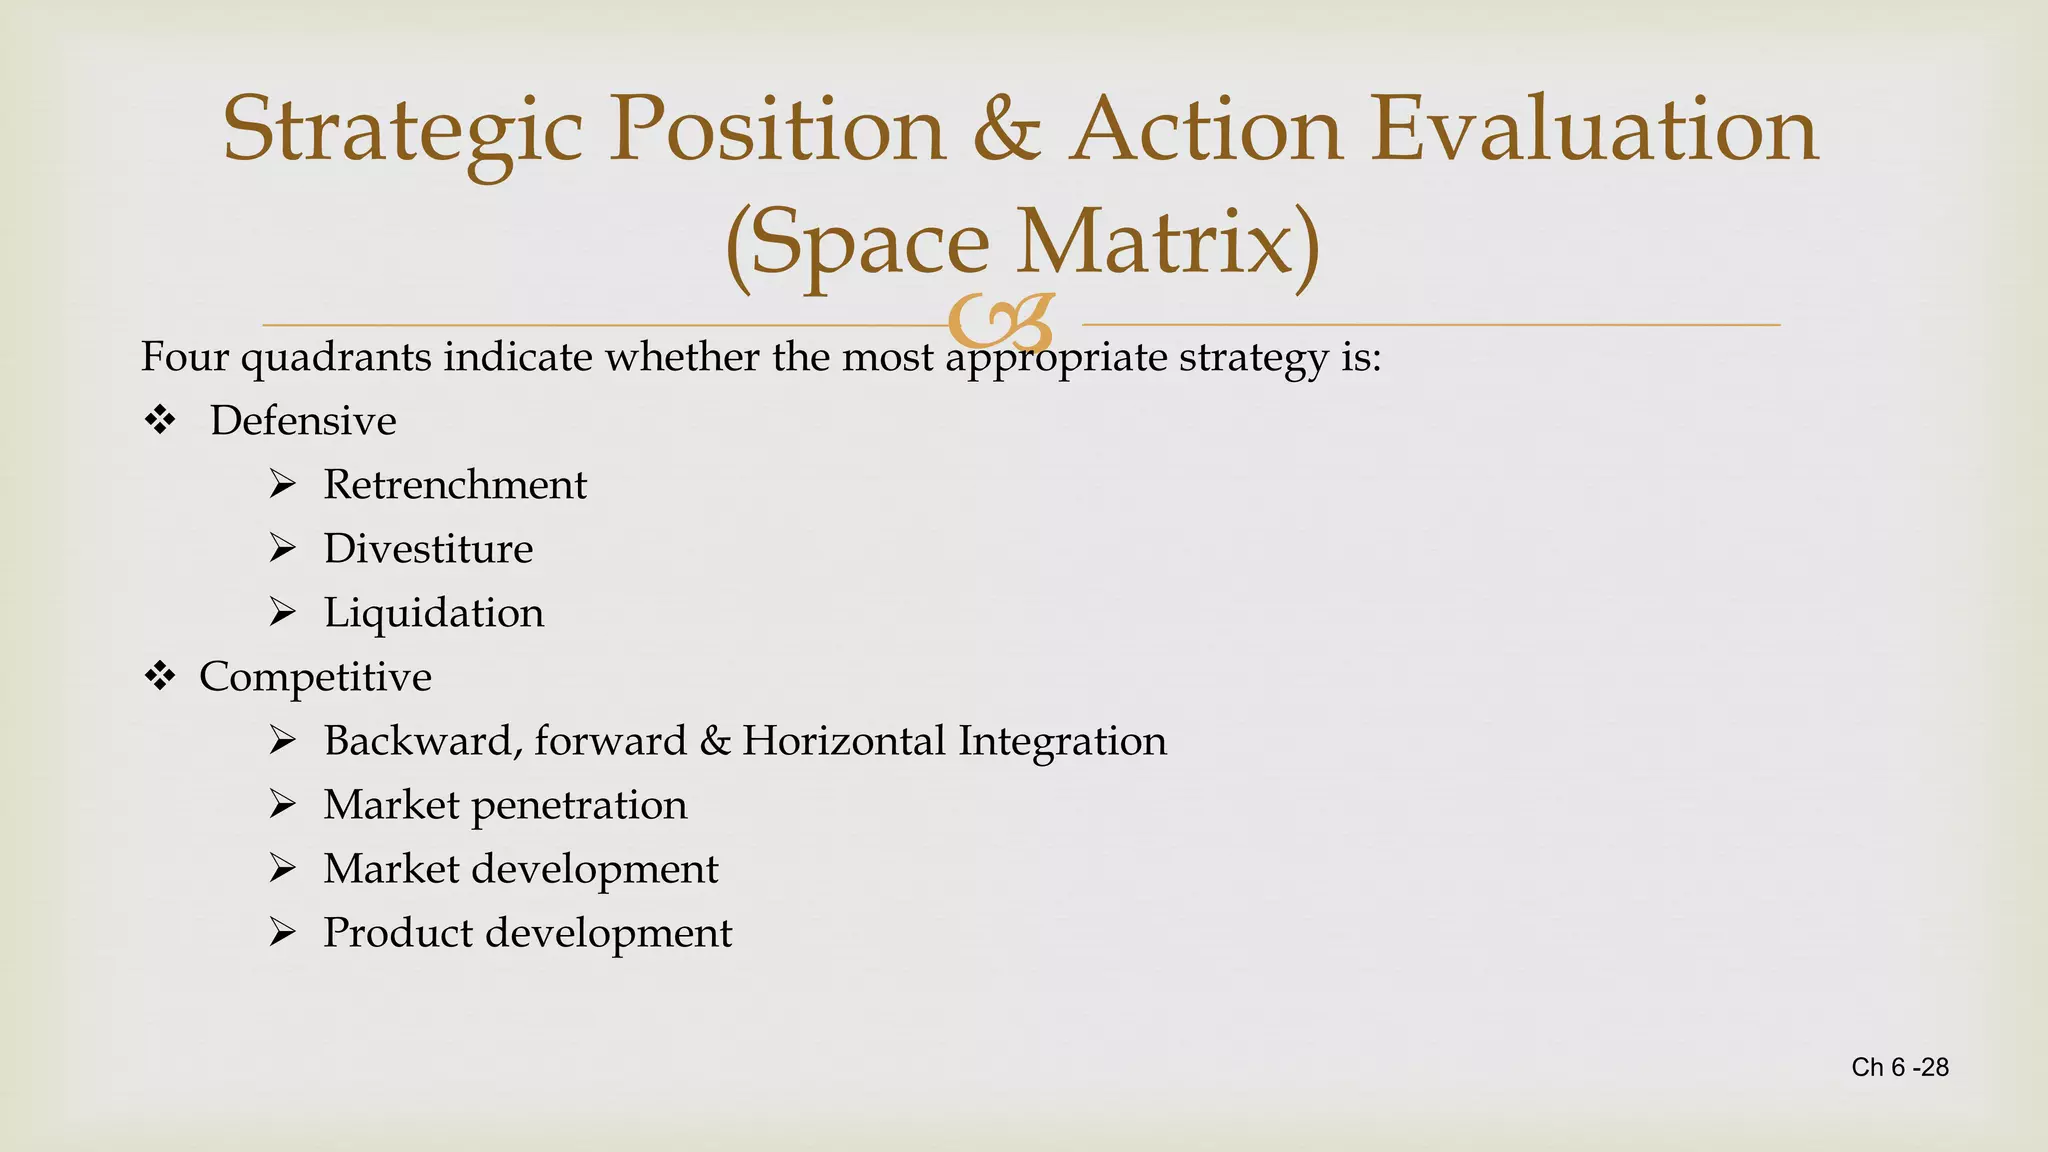
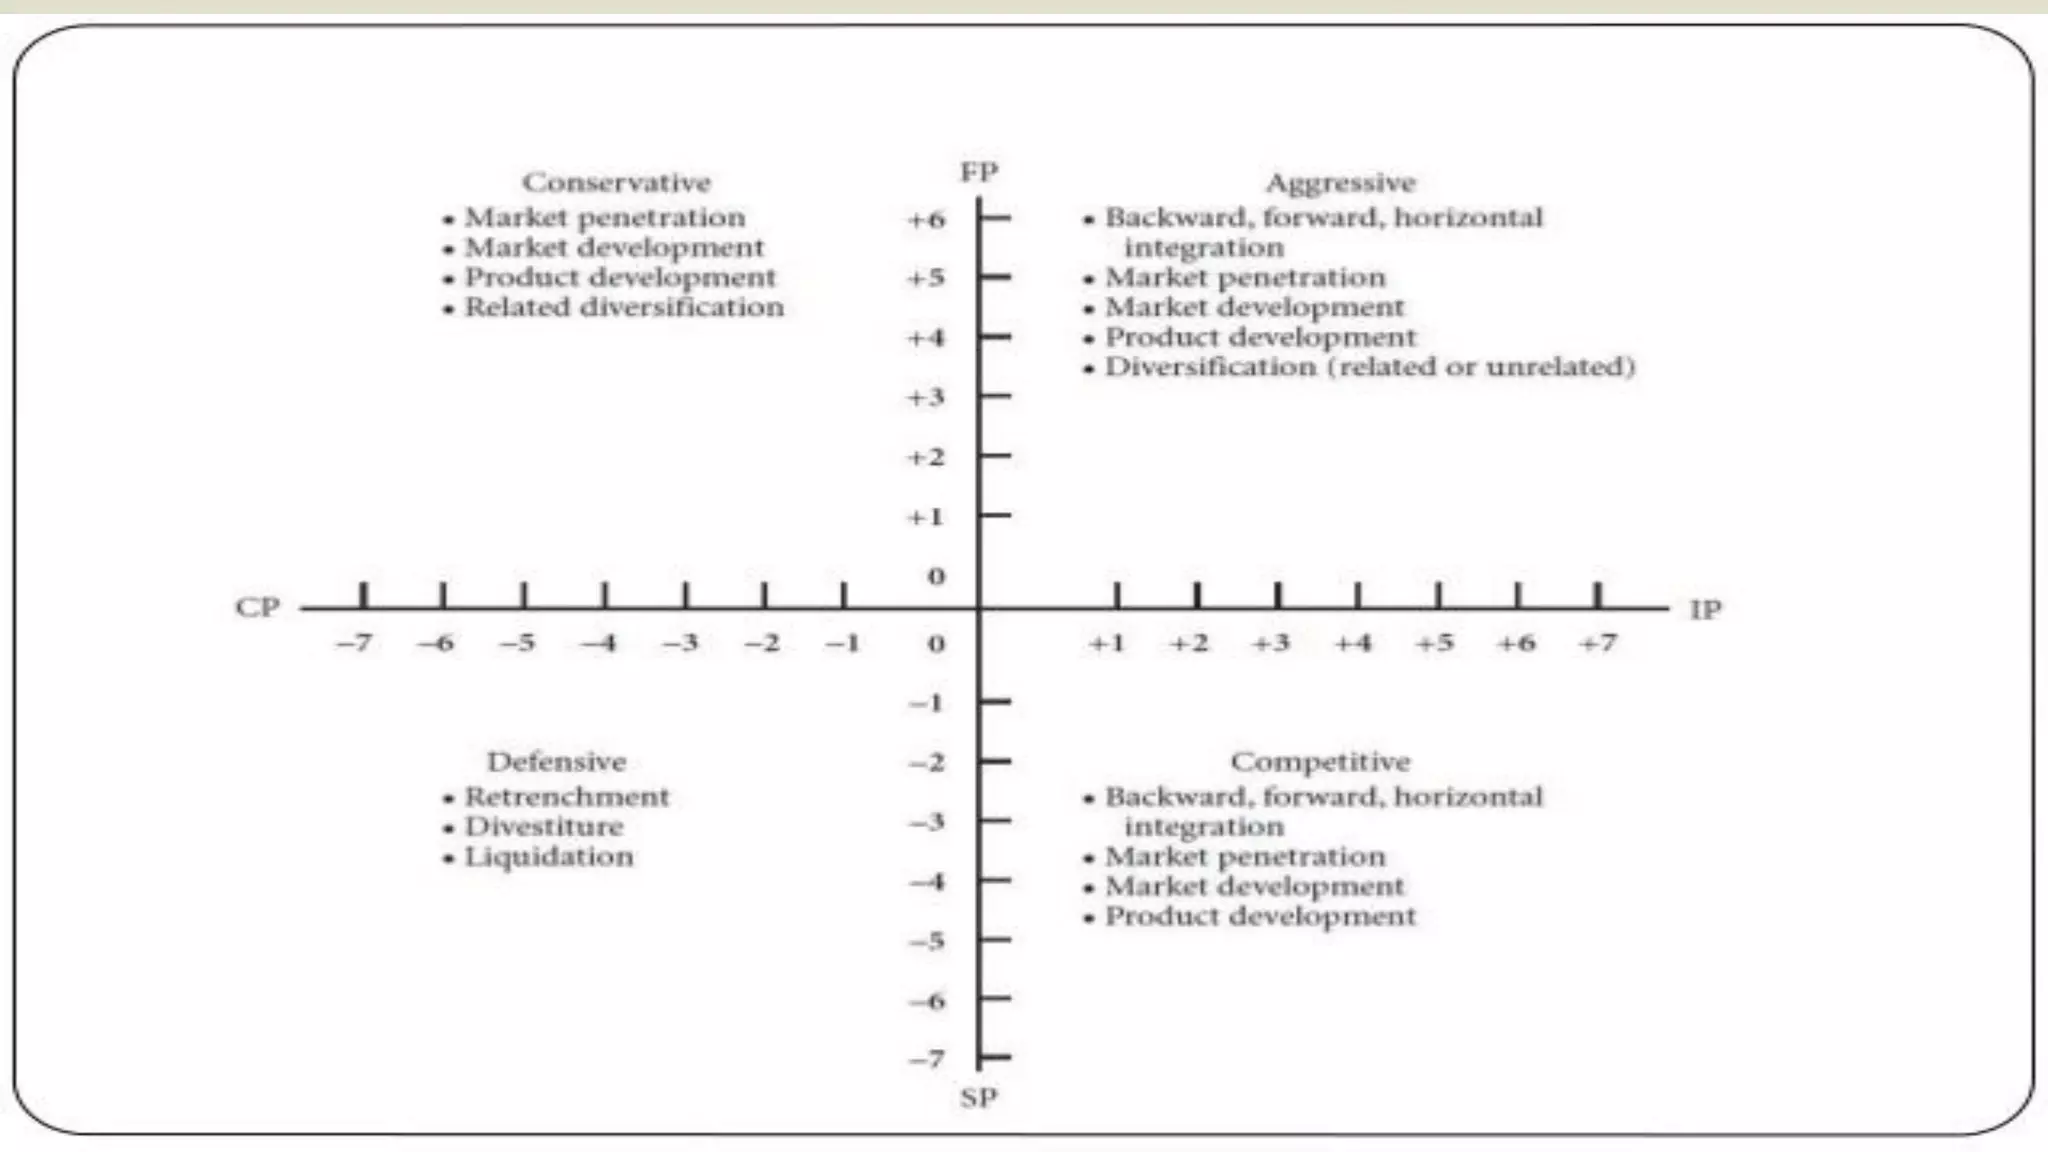
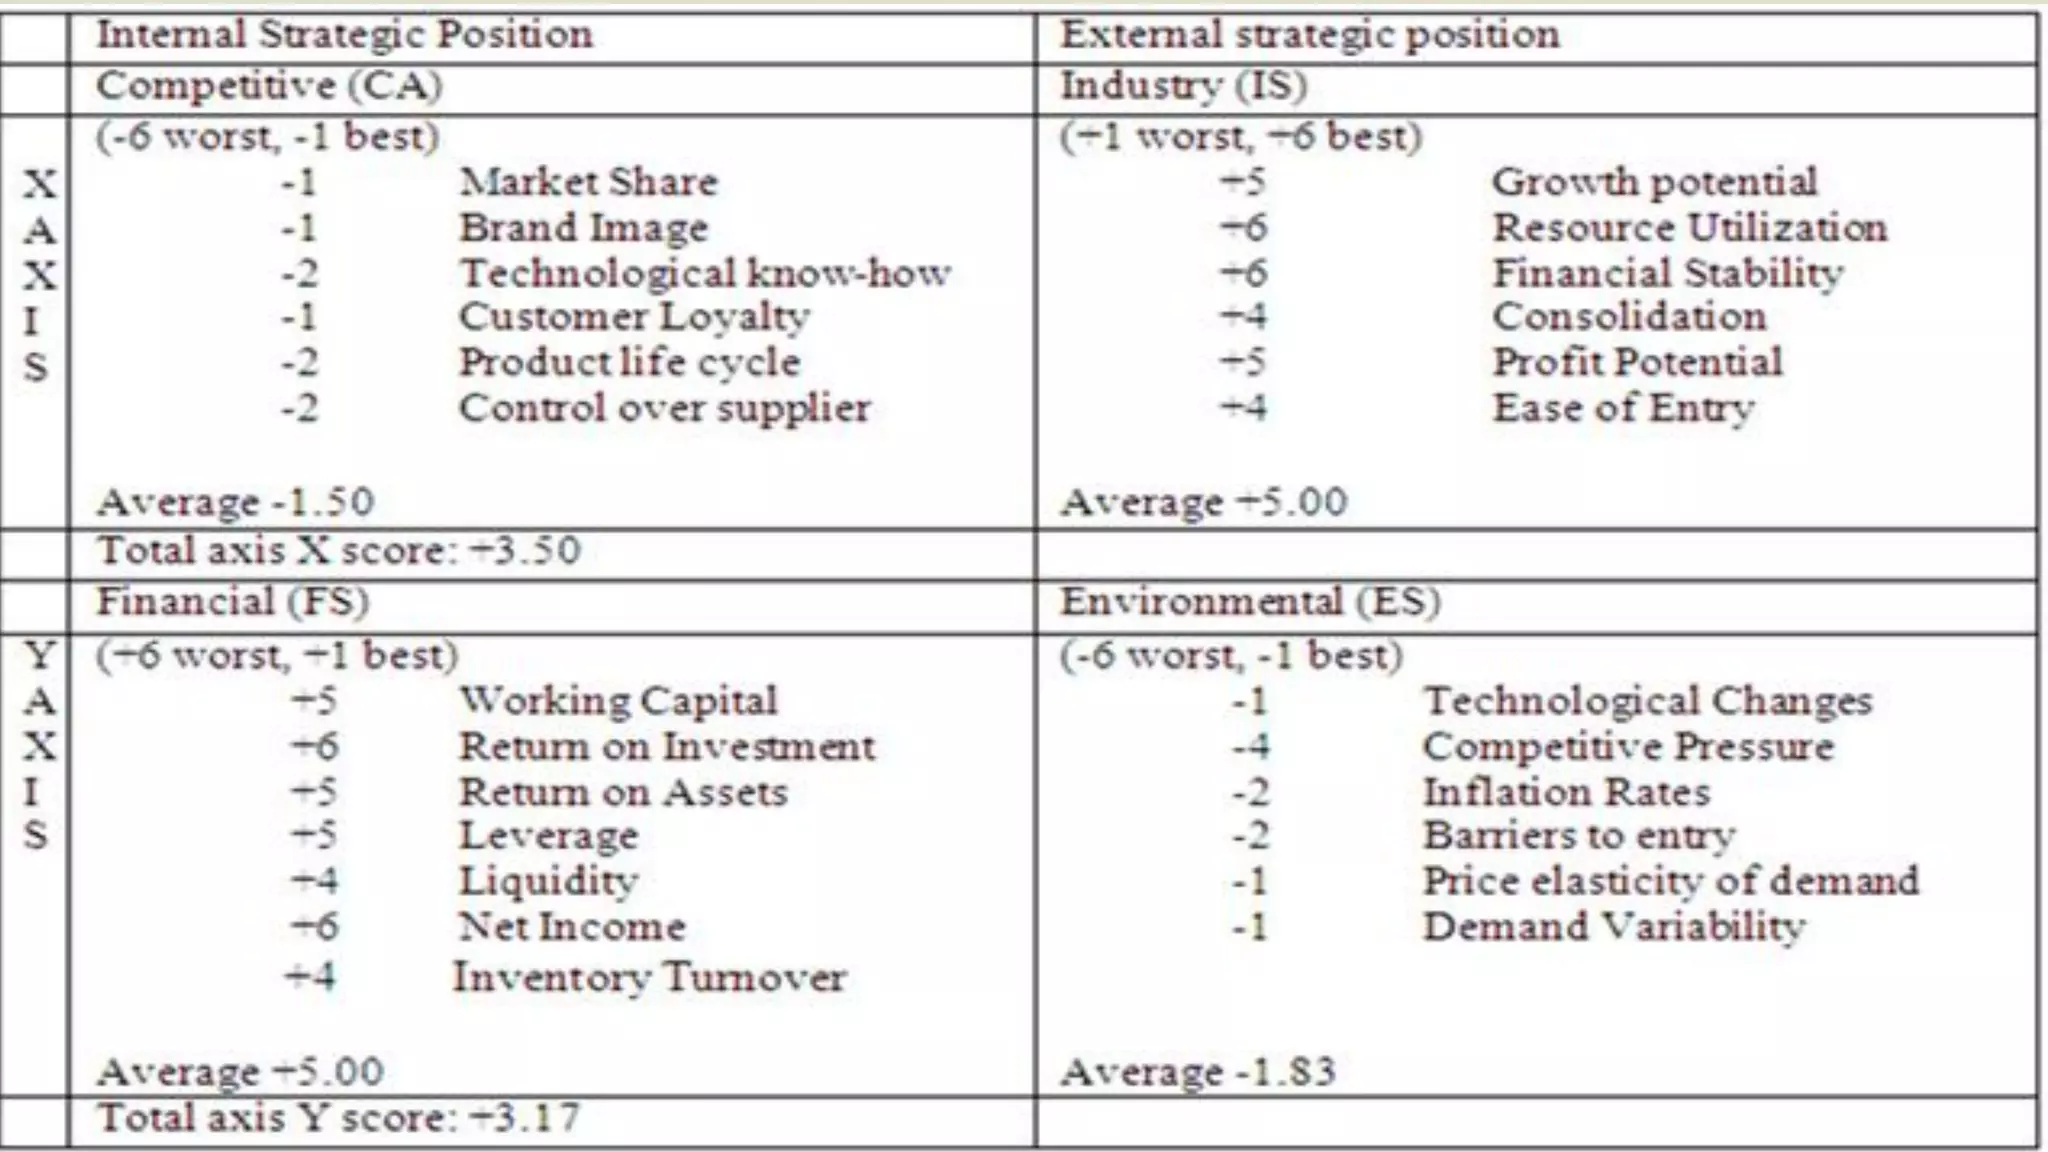
Strategic Position & Action Evaluation
(Space Matrix)
Two internal dimensions (financial position) [FP] and competitive
position [CP])
Two external dimensions (stability position [SP] and industry position
[IP])
Most important determinants of an organization’s overall strategic
position](https://image.slidesharecdn.com/presentationonch6finalslides-200615195445/75/Principles-of-management-30-2048.jpg)


The document summarizes key topics from a presentation on chapter 6 about strategy analysis and choice. It discusses the strategy formulation process including the input, matching, and decision stages. Matrices used in strategy analysis are described such as EFE, CPM, IFE, SWOT, SPACE, BCG, IE, and QSPM. Governance issues and principles of good governance for boards of directors are also covered.


