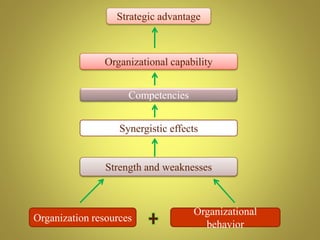
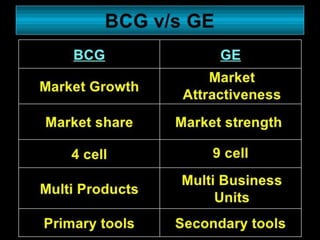
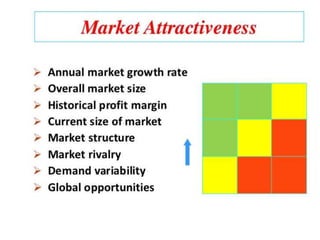
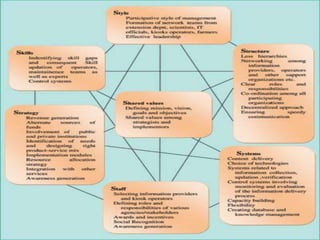
Organizational
Capability
Profile
Strategic advantage
Organizational capability
Competencies
Synergistic effects
Strength and weaknesses
Organizational
behavior
Organization resources
ORGANIZATIONAL APPRAISAL
•Internal Environment - strength & weakness in
different functional areas
Organization capability:
•Capacity & ability to use unique competencies to excel in a
particular field.
• Ability to use its ‘S’ & ‘W’ to exploit ‘O’ & face ‘T’ in its
external environment.
Organization resources
•Physical & human cost, availability - strength / weakness
Organization behavior:
•Identity & character of an organization leadership, Mgt.
Philosophy, values, culture, Quality of work
environment, Organization climate, organization politics
etc.
Resource Behavior
Distinctive competence
Any advantage a company has over its
competitor - it can do something which
they cannot or can do better –
Opportunity for an organization to
capitalize - low cost, Superior Quality, R&D
skills etc.
METHODS & TECHNIQUES
Inclusive, long term:
Financial Analysis - Ratio Analysis, EVA, ABC
Key factor rating - Rating of different factors through
different questions
Value chain analysis
VRIO framework
METHODS & TECHNIQUES
BCG, GE Matrix , PIMS, McKinsey7S
Balanced Scorecard
Competitive Advantage Profile
Strategic Advantage profile
Internal Factor Analysis Summary
SWOT ANALYSIS
• Identify & classify firm’s resources-S&W
• Combine firm’s strength into specific capabilities –
Corporate capability- may be distinctive competence
• Strategy that best exploits the firms resources
• Identify resource gaps & Invest in upgrading
Organizational Capability Profile (OCP)
Financial Capability Profile
(a) Sources of funds
(b) Usage of funds
(c) Management of funds
Marketing Capability Profile
(a) Product related
(b) Price related
(c) Promotion related
(d) Integrative & Systematic
Operations Capability Factor
(a) Production system
(b) Operation & Control system
(c) R&D system
Personnel Capability Factor
(a) Personnel system
(b) Organization & employee characteristics
(c) Industrial Relations
General Management Capability
(a) General Management Systems
(b) External Relations
(c) Organization climate
EXAMPLES OF ORGANIZATIONAL CAPABILITY PROFILE
Financial Capability
Bajaj - Cash Management
LIC - Centralized payment, decentralized collection
Reliance - high investor confidence
Escorts - Amicable relation with FIS (world's top-ranked technology
provider to the banking industry)
Marketing Capability
Hindustan Lever - Distribution Channel
IDBI/ICICI Bank - Wide variety of products
Tata - Company / Product Image
Operations Capability
Lakshmi machine works - absorb imported technology
Balmer & Lawrie - R&D - New specialty chemicals
Personnel Capability
Apollo tyres - Industrial relations problem
General management capability
Malayalam Manaroma - largest selling newspaper
Unchallenged leadership - Unified, stable Best edited & most
professionally produced
VRIO FRAMEWORK
Resource- asset, competency, skill, knowledge
e.g. patents, brand name,
• Value : Does it provide competitive advantage?
• Rarity: Do other competitors possess it?
• Imitability: Is it costly for others to reproduce?
• Organization : Is the firm organized to exploit the resource?
A resource is an asset, skill, competency or knowledge
controlled by the corporation.
A resource is a strength if it provides competitive
advantage e.g. patents, brand name, economies of scale,
idea-driven, standardized mass production
VRIO - STEPS
• Identify: firms resources- S&W.
• Combine: firms strength into specific capabilities.
• Appraise- profit potential, sustainable competitive
advantage, ability to convert it to a profitable
proposition
• Select strategy - firm’s resources& capability
relative to external opportunity.
• Identify: resource gaps and invest in upgrading
weaknesses
BALANCED SCORECARD- KAPLAN & NORTON
4 performance measures
• Customer perspective (View Point)
• Internal business perspective
• Innovation & learning perspective
• Financial perspective
Purpose of Balanced Scorecard:
A method of implementing a business strategy by
translating it into a set of performance.
Measures derived from strategic goals that allocate
rewards to executives and managers based on their
success at meeting or exceeding the performance
measures.
BSC: Causal Relationships
Internal
Process
Customer
Strategy
Financial
Learning
FINANCIAL ANALYSIS
• Ratio Analysis
• Economic value added
-NOPAT (Net Operating Profit After Tax)
-WACC (Weighted Average Cost Of Capital )
• Activity Based Costing
– activity in Value chain
_ specific activities
• COMPETITIVE ADVANTAGE PROFILE
• 50,00000 -India
• 66.05-USA
Competitive Advantage means
Something that places a company
or a person above the competition
Competitive
Advantage
Cost advantage
Differentiation
Advantage
A Model of Competitive advantage
Resources
Distinctive
Competencies
Capabilities
Cost advantage
Or
Differentiation advantage
Value
Creation
COMPETITIVE ADVANTAGE PROFILE: A Case of Berger Paints
Marketing Factors
Market leader - 35% share in organized sector.
Closest competitor - less than half of AP’s market share
>20 yrs - leader
Widest product range - product shades, pack sizes
40 diff. decorative paints - 150 shades, 8 different sizes in
packing, no. of brands-all segments
Brands - quite powerful
90% accuracy in forecasting, 00 fastest moving Stock
Keeping Units, monitored daily
Countrywide distribution - 13000 dealers - large
network- regional offices, company
depots
Physical distribution - far superior to competitors
strong in inventory control - (28 days) of sales (industry avg.51
days, service level - high, credit o/s –
<25 days (comp 40 days)
Manufacturing/Operations factors
Size advantage in relation to competitors
Skill in production planning, scheduling, matching with
marketing requirements
In – house production - no outsourcing – high reliability suppliers
- superior quality assurance
Four production location - spread benefits Human Resources
High caliber HR
Professionals - MBAs more
Finance factors
Leader in profits & operating margins, ROI 40%, rest of
industry 22%, Networth 204 cr, 58 cr - Nerolac, 41 cr – Berger
Cash rich
Corporate factors
Awards
High profile corporate image
Enviable track record in breaking away the position of MNCs in
the Indian paint Industry
PORTFOLIO ANALYSIS
 27% of fortune 500 companies use it in strategy formulation
 Top management views its product lines and business units as
a series of investment return
 Product lines/Business units - a portfolio of investment –
company constantly juggle - to get yield
BCG Matrix (Boston Consulting Group )
What is BCG
 Its portfolio planning model developed by Bruce
Henderson in 1970’s.
 Based on observation combination of market
growth and market share.
 BCG matrix is to evaluate the strategic position of
the business brand portfolio and its potential.
Star –
• Market leader,
• Peak of product life cycle,
• Enough cash to maintain high share (market),
• More resources
• Investment to support high growth
• No immediate profits
• Great potential – future
• Medium risk category
• If Growth rate slow - becomes cash cows
Strategic choices: Vertical integration, horizontal integration,
market penetration, market development, product
development
Question Marks
• (Problem children/wild cats)
• New products with potential for success
• More resources bit future uncertain
• High risk category
• Money taken from mature products & spent on ?
• Slow growth - becomes dogs
Strategic choices: Market penetration, market
development, product development, divestiture
Cash cows –
• More money needed for maintaining market
share
• Declining stage of life cycle
Strategic choices: Product development, diversification,
divestiture, retrenchment
Dogs –
• Weak market share,
• low growth market cash trap of the company
Strategic choices: Retrenchment, liquidation,
divestiture
BENEFITS OF THE MATRIX:
 Easy to perform;
 Helps to understand the strategic positions of
business portfolio;
 It’s a good starting point for further more thorough
analysis.
MAIN LIMITATIONS :
 Business can only be classified to four quadrants;
 Does not include other external factors that may
change the situation completely.
 It denies that synergies between different units
exist.
CELL MATRIX
General Electric Matrix (GE Cell Matrix)
• The GE Matrix overcomes a number of the disadvantages of the
BCG Box.
• Firstly, market attractiveness replaces market growth as the
dimension of industry attractiveness, and includes a broader range
of factors other than just the market growth rate.
• Secondly, competitive strength replaces market share as the
dimension by which the competitive position of each SBU is
assessed.
• The diagram below illustrates some of the possible elements that
determine market attractiveness and competitive strength by
applying the GE Matrix to the UK retailing market:
UK retailing market:
PIMS
The Profit Impact of Market Strategies (PIMS) is a
comprehensive, long-term study of the performance of strategic
business units (SBUs) in thousands of companies in all major
industries.
The PIMS project began at General Electric in the mid-1960s. It
was continued at Harvard University in the early 1970s, then was
taken over by the Strategic Planning Institute (SPI) in 1975.
Since then, SPI researchers and consultants have continued
working on the development and application of PIMS data.
• According to the SPI, the PIMS database is-
• "a collection of statistically documented experiences drawn
from thousands of businesses, designed to help understand
what kinds of strategies (e.g. quality, pricing, vertical
integration, innovation, advertising) work best in what kinds of
business environments.
• The data constitute a key resource for such critical
management tasks as evaluating business performance,
analyzing new business opportunities, evaluating and reality
testing new strategies, and screening business portfolios.”
• The main function of PIMS is to highlight the relationship
between a business's key strategic decisions and its results.
• Analyzed correctly, the data can help managers gain a better
understanding of their business environment, identify critical
factors in improving the position of their company, and
develop strategies that will enable them to create a sustainable
advantage.
• PIMS principles are taught in business schools, and the data
are widely used in academic research. As a result, PIMS has
influenced business strategy in companies around the world.
MCKINSEY’S 7S FRAMEWORK
Structure
Super ordinate
Goals
Strategy
Skills
System
Style
Staff
• McKinsey 7s model was developed in 1980s by McKinsey consultants Tom
Peters, Robert Waterman and Julien Philips with a help from Richard
Pascale and Anthony G. Athos.
• Since the introduction, the model has been widely used by academics and
practitioners and remains one of the most popular strategic planning tools.
• The goal of the model was to show how 7 elements of the company:
Structure, Strategy, Skills, Staff, Style, Systems, and Shared values, can be
aligned together to achieve effectiveness in a company.
• The key point of the model is that all the seven areas are interconnected and
a change in one area requires change in the rest of a firm for it to function
effectively.
The most common uses of the framework are:
• To facilitate organizational change.
• To help implement new strategy.
• To identify how each area may change in a future.
• To facilitate the merger of organizations.
MCKINSEY’S 7S FRAMEWORK
Style
One of the seven handles, which top management can use to bring
about organization Change with change of systems & procedures
- Style of functioning changes
- Culture of organization changes
Staff :
Update knowledge & skills to keep quickness with change
Strategy
Includes purpose, mission, objectives, goal, action plans &
policies,7S model emphasize - Development easy – execution
Systems
Procedures & methods framed by organization & followed by
operational personnel in the respective functional area.
Traditional systems Change in view of advanced technology &
processes developed
Structure
Relationship between/among various positions and activities,
Design of structure - critical task for top management.
Need based structural changes - to cope with specific strategic
tasks without abandoning basic structural divisions throughout
the organizations.
Skills
Acquainted with state of the art technology & improvised
methods & practices
MCKINSEY’S 7S FRAMEWORK - SKILLS
Procter & Gamble - Best known - Skills in product management
Hindustan Lever & Richardson Hindustan - Marketing skills
BHEL, TELCO, L&T - Engineering skills
DCL, Mecon & M.N. Dastur & Company - Project consulting skills
Super ordinate Goals
Fundamental ideas of business
Main values
Broad notions of future directions
In short MCKINSEY’S FRAMEWORK
“A set of values and aspirations that goes beyond the conventional
formal statement of corporate objectives.
All targets and attention of all activities and exercise of the other
six levers of any organization should be directed towards
accomplishment of the best possible goals” the ultimate & terminal
point - where organization will have to reach ultimately.
Effective organizational change
May be understood as a complex relationship between 7Ss.
TOWS
Matrix or Analysis
A TOWS analysis involves the same basic process of listing
strengths, weaknesses, opportunities and threats as a SWOT
analysis, but with a TOWS analysis, threats and opportunities are
examined first and weaknesses and strengths are examined last.
After creating a list of threats, opportunistic, weaknesses and
strengths, managers examine ways the company can take
advantage of opportunities and minimize threats by exploiting
strengths and overcoming weaknesses.
TOWS Matrix
Internal
External
(S)
List 5-10
Internal strengths
(W)
List 5-10
Internal Weakness
(O)
List 5-10
External
Opportunities
(T)
List 5-10
External Threats
SO Strategies
Use ‘S’ to take
advantage of ‘O’
WO Strategies
Take advantage of ‘O’
by overcoming ‘W’
ST Strategies
Use ‘S’ to avoid
‘T’
WT Strategies
Minimize ‘W’ and
avoid ‘T’
- Generate Alternative Strategies
Environmental
Threat
and
Opportunity
profile
(ETOP)
• Environment analysis results in a mass of information
related to forces in the environment.
• They deal with events, trends, issues, and expectations.
• Structuring of environmental issues is necessary to
make them meaning full for strategy formulation
• ETOP(Environmental Threat and Opportunity Profile)
is a technique to structure environmental issues.
ETOP involves:
• Dividing the environment into different sectors.
• Each sectors can be subdivided into sub sectors.
• Analyzing the impact of each sector and
subsector
on the organization.
• Describe the impact in the form of a statement
•.
Advantage of ETOP
• It provides a clear of which sector and sub sectors
have favorable impact on the organization. It helps
interpret the result of environment analysis.
• The organization can assess its competitive position.
• Appropriate strategies can be formulated to take
advantage of opportunities and counter the threat.
• SWOT analysis (Strategic weakness, opportunities
and threats.)
9 organisation capability & port folio

9 organisation capability & port folio

  • 1.
  • 2.
    Strategic advantage Organizational capability Competencies Synergisticeffects Strength and weaknesses Organizational behavior Organization resources
  • 3.
    ORGANIZATIONAL APPRAISAL •Internal Environment- strength & weakness in different functional areas Organization capability: •Capacity & ability to use unique competencies to excel in a particular field. • Ability to use its ‘S’ & ‘W’ to exploit ‘O’ & face ‘T’ in its external environment. Organization resources •Physical & human cost, availability - strength / weakness
  • 4.
    Organization behavior: •Identity &character of an organization leadership, Mgt. Philosophy, values, culture, Quality of work environment, Organization climate, organization politics etc. Resource Behavior Distinctive competence
  • 5.
    Any advantage acompany has over its competitor - it can do something which they cannot or can do better – Opportunity for an organization to capitalize - low cost, Superior Quality, R&D skills etc.
  • 6.
    METHODS & TECHNIQUES Inclusive,long term: Financial Analysis - Ratio Analysis, EVA, ABC Key factor rating - Rating of different factors through different questions Value chain analysis VRIO framework
  • 7.
    METHODS & TECHNIQUES BCG,GE Matrix , PIMS, McKinsey7S Balanced Scorecard Competitive Advantage Profile Strategic Advantage profile Internal Factor Analysis Summary
  • 8.
    SWOT ANALYSIS • Identify& classify firm’s resources-S&W • Combine firm’s strength into specific capabilities – Corporate capability- may be distinctive competence • Strategy that best exploits the firms resources • Identify resource gaps & Invest in upgrading
  • 10.
    Organizational Capability Profile(OCP) Financial Capability Profile (a) Sources of funds (b) Usage of funds (c) Management of funds Marketing Capability Profile (a) Product related (b) Price related (c) Promotion related (d) Integrative & Systematic
  • 11.
    Operations Capability Factor (a)Production system (b) Operation & Control system (c) R&D system Personnel Capability Factor (a) Personnel system (b) Organization & employee characteristics (c) Industrial Relations General Management Capability (a) General Management Systems (b) External Relations (c) Organization climate
  • 12.
    EXAMPLES OF ORGANIZATIONALCAPABILITY PROFILE Financial Capability Bajaj - Cash Management LIC - Centralized payment, decentralized collection Reliance - high investor confidence Escorts - Amicable relation with FIS (world's top-ranked technology provider to the banking industry) Marketing Capability Hindustan Lever - Distribution Channel IDBI/ICICI Bank - Wide variety of products Tata - Company / Product Image
  • 13.
    Operations Capability Lakshmi machineworks - absorb imported technology Balmer & Lawrie - R&D - New specialty chemicals Personnel Capability Apollo tyres - Industrial relations problem General management capability Malayalam Manaroma - largest selling newspaper Unchallenged leadership - Unified, stable Best edited & most professionally produced
  • 14.
    VRIO FRAMEWORK Resource- asset,competency, skill, knowledge e.g. patents, brand name, • Value : Does it provide competitive advantage? • Rarity: Do other competitors possess it? • Imitability: Is it costly for others to reproduce? • Organization : Is the firm organized to exploit the resource? A resource is an asset, skill, competency or knowledge controlled by the corporation. A resource is a strength if it provides competitive advantage e.g. patents, brand name, economies of scale, idea-driven, standardized mass production
  • 16.
    VRIO - STEPS •Identify: firms resources- S&W. • Combine: firms strength into specific capabilities. • Appraise- profit potential, sustainable competitive advantage, ability to convert it to a profitable proposition • Select strategy - firm’s resources& capability relative to external opportunity. • Identify: resource gaps and invest in upgrading weaknesses
  • 19.
  • 20.
    BALANCED SCORECARD- KAPLAN& NORTON 4 performance measures • Customer perspective (View Point) • Internal business perspective • Innovation & learning perspective • Financial perspective
  • 24.
    Purpose of BalancedScorecard: A method of implementing a business strategy by translating it into a set of performance. Measures derived from strategic goals that allocate rewards to executives and managers based on their success at meeting or exceeding the performance measures.
  • 25.
  • 26.
    FINANCIAL ANALYSIS • RatioAnalysis • Economic value added -NOPAT (Net Operating Profit After Tax) -WACC (Weighted Average Cost Of Capital ) • Activity Based Costing – activity in Value chain _ specific activities
  • 27.
    • COMPETITIVE ADVANTAGEPROFILE • 50,00000 -India • 66.05-USA
  • 30.
    Competitive Advantage means Somethingthat places a company or a person above the competition
  • 31.
  • 32.
    A Model ofCompetitive advantage Resources Distinctive Competencies Capabilities Cost advantage Or Differentiation advantage Value Creation
  • 33.
    COMPETITIVE ADVANTAGE PROFILE:A Case of Berger Paints Marketing Factors Market leader - 35% share in organized sector. Closest competitor - less than half of AP’s market share >20 yrs - leader Widest product range - product shades, pack sizes 40 diff. decorative paints - 150 shades, 8 different sizes in packing, no. of brands-all segments Brands - quite powerful
  • 34.
    90% accuracy inforecasting, 00 fastest moving Stock Keeping Units, monitored daily Countrywide distribution - 13000 dealers - large network- regional offices, company depots Physical distribution - far superior to competitors strong in inventory control - (28 days) of sales (industry avg.51 days, service level - high, credit o/s – <25 days (comp 40 days)
  • 35.
    Manufacturing/Operations factors Size advantagein relation to competitors Skill in production planning, scheduling, matching with marketing requirements In – house production - no outsourcing – high reliability suppliers - superior quality assurance Four production location - spread benefits Human Resources High caliber HR Professionals - MBAs more
  • 36.
    Finance factors Leader inprofits & operating margins, ROI 40%, rest of industry 22%, Networth 204 cr, 58 cr - Nerolac, 41 cr – Berger Cash rich Corporate factors Awards High profile corporate image Enviable track record in breaking away the position of MNCs in the Indian paint Industry
  • 37.
    PORTFOLIO ANALYSIS  27%of fortune 500 companies use it in strategy formulation  Top management views its product lines and business units as a series of investment return  Product lines/Business units - a portfolio of investment – company constantly juggle - to get yield
  • 38.
    BCG Matrix (BostonConsulting Group )
  • 39.
    What is BCG Its portfolio planning model developed by Bruce Henderson in 1970’s.  Based on observation combination of market growth and market share.  BCG matrix is to evaluate the strategic position of the business brand portfolio and its potential.
  • 41.
    Star – • Marketleader, • Peak of product life cycle, • Enough cash to maintain high share (market), • More resources • Investment to support high growth • No immediate profits • Great potential – future • Medium risk category • If Growth rate slow - becomes cash cows Strategic choices: Vertical integration, horizontal integration, market penetration, market development, product development
  • 42.
    Question Marks • (Problemchildren/wild cats) • New products with potential for success • More resources bit future uncertain • High risk category • Money taken from mature products & spent on ? • Slow growth - becomes dogs Strategic choices: Market penetration, market development, product development, divestiture
  • 43.
    Cash cows – •More money needed for maintaining market share • Declining stage of life cycle Strategic choices: Product development, diversification, divestiture, retrenchment Dogs – • Weak market share, • low growth market cash trap of the company Strategic choices: Retrenchment, liquidation, divestiture
  • 46.
    BENEFITS OF THEMATRIX:  Easy to perform;  Helps to understand the strategic positions of business portfolio;  It’s a good starting point for further more thorough analysis. MAIN LIMITATIONS :  Business can only be classified to four quadrants;  Does not include other external factors that may change the situation completely.  It denies that synergies between different units exist.
  • 47.
  • 51.
    General Electric Matrix(GE Cell Matrix) • The GE Matrix overcomes a number of the disadvantages of the BCG Box. • Firstly, market attractiveness replaces market growth as the dimension of industry attractiveness, and includes a broader range of factors other than just the market growth rate. • Secondly, competitive strength replaces market share as the dimension by which the competitive position of each SBU is assessed. • The diagram below illustrates some of the possible elements that determine market attractiveness and competitive strength by applying the GE Matrix to the UK retailing market:
  • 57.
  • 58.
    PIMS The Profit Impactof Market Strategies (PIMS) is a comprehensive, long-term study of the performance of strategic business units (SBUs) in thousands of companies in all major industries. The PIMS project began at General Electric in the mid-1960s. It was continued at Harvard University in the early 1970s, then was taken over by the Strategic Planning Institute (SPI) in 1975. Since then, SPI researchers and consultants have continued working on the development and application of PIMS data.
  • 59.
    • According tothe SPI, the PIMS database is- • "a collection of statistically documented experiences drawn from thousands of businesses, designed to help understand what kinds of strategies (e.g. quality, pricing, vertical integration, innovation, advertising) work best in what kinds of business environments. • The data constitute a key resource for such critical management tasks as evaluating business performance, analyzing new business opportunities, evaluating and reality testing new strategies, and screening business portfolios.” • The main function of PIMS is to highlight the relationship between a business's key strategic decisions and its results.
  • 60.
    • Analyzed correctly,the data can help managers gain a better understanding of their business environment, identify critical factors in improving the position of their company, and develop strategies that will enable them to create a sustainable advantage. • PIMS principles are taught in business schools, and the data are widely used in academic research. As a result, PIMS has influenced business strategy in companies around the world.
  • 62.
    MCKINSEY’S 7S FRAMEWORK Structure Superordinate Goals Strategy Skills System Style Staff
  • 63.
    • McKinsey 7smodel was developed in 1980s by McKinsey consultants Tom Peters, Robert Waterman and Julien Philips with a help from Richard Pascale and Anthony G. Athos. • Since the introduction, the model has been widely used by academics and practitioners and remains one of the most popular strategic planning tools. • The goal of the model was to show how 7 elements of the company: Structure, Strategy, Skills, Staff, Style, Systems, and Shared values, can be aligned together to achieve effectiveness in a company. • The key point of the model is that all the seven areas are interconnected and a change in one area requires change in the rest of a firm for it to function effectively.
  • 64.
    The most commonuses of the framework are: • To facilitate organizational change. • To help implement new strategy. • To identify how each area may change in a future. • To facilitate the merger of organizations.
  • 65.
    MCKINSEY’S 7S FRAMEWORK Style Oneof the seven handles, which top management can use to bring about organization Change with change of systems & procedures - Style of functioning changes - Culture of organization changes Staff : Update knowledge & skills to keep quickness with change
  • 66.
    Strategy Includes purpose, mission,objectives, goal, action plans & policies,7S model emphasize - Development easy – execution Systems Procedures & methods framed by organization & followed by operational personnel in the respective functional area. Traditional systems Change in view of advanced technology & processes developed
  • 67.
    Structure Relationship between/among variouspositions and activities, Design of structure - critical task for top management. Need based structural changes - to cope with specific strategic tasks without abandoning basic structural divisions throughout the organizations. Skills Acquainted with state of the art technology & improvised methods & practices
  • 68.
    MCKINSEY’S 7S FRAMEWORK- SKILLS Procter & Gamble - Best known - Skills in product management Hindustan Lever & Richardson Hindustan - Marketing skills BHEL, TELCO, L&T - Engineering skills DCL, Mecon & M.N. Dastur & Company - Project consulting skills Super ordinate Goals Fundamental ideas of business Main values Broad notions of future directions
  • 69.
    In short MCKINSEY’SFRAMEWORK “A set of values and aspirations that goes beyond the conventional formal statement of corporate objectives. All targets and attention of all activities and exercise of the other six levers of any organization should be directed towards accomplishment of the best possible goals” the ultimate & terminal point - where organization will have to reach ultimately. Effective organizational change May be understood as a complex relationship between 7Ss.
  • 71.
  • 72.
    A TOWS analysisinvolves the same basic process of listing strengths, weaknesses, opportunities and threats as a SWOT analysis, but with a TOWS analysis, threats and opportunities are examined first and weaknesses and strengths are examined last. After creating a list of threats, opportunistic, weaknesses and strengths, managers examine ways the company can take advantage of opportunities and minimize threats by exploiting strengths and overcoming weaknesses.
  • 73.
    TOWS Matrix Internal External (S) List 5-10 Internalstrengths (W) List 5-10 Internal Weakness (O) List 5-10 External Opportunities (T) List 5-10 External Threats SO Strategies Use ‘S’ to take advantage of ‘O’ WO Strategies Take advantage of ‘O’ by overcoming ‘W’ ST Strategies Use ‘S’ to avoid ‘T’ WT Strategies Minimize ‘W’ and avoid ‘T’ - Generate Alternative Strategies
  • 75.
  • 76.
    • Environment analysisresults in a mass of information related to forces in the environment. • They deal with events, trends, issues, and expectations. • Structuring of environmental issues is necessary to make them meaning full for strategy formulation • ETOP(Environmental Threat and Opportunity Profile) is a technique to structure environmental issues.
  • 77.
    ETOP involves: • Dividingthe environment into different sectors. • Each sectors can be subdivided into sub sectors. • Analyzing the impact of each sector and subsector on the organization. • Describe the impact in the form of a statement •.
  • 78.
    Advantage of ETOP •It provides a clear of which sector and sub sectors have favorable impact on the organization. It helps interpret the result of environment analysis. • The organization can assess its competitive position. • Appropriate strategies can be formulated to take advantage of opportunities and counter the threat. • SWOT analysis (Strategic weakness, opportunities and threats.)