#1 If this PowerPoint presentation contains mathematical equations, you may need to check that your computer has the following installed:
1) MathType Plugin
2) Math Player (free versions available)
3) NVDA Reader (free versions available)
#2 After studying this chapter, you should be able to do the following:
6.1 Describe the strategy analysis and choice process.
6.2 Diagram and explain the three-stage strategy-formulation analytical framework.
6.3 Construct and apply the Strengths-Weaknesses-Opportunities-Threats (S W O T) Matrix.
6.4 Construct and apply the Strategic Position and Action Evaluation (S P A C E) Matrix.
6.5 Construct and apply the Boston Consulting Group (B C G) Matrix.
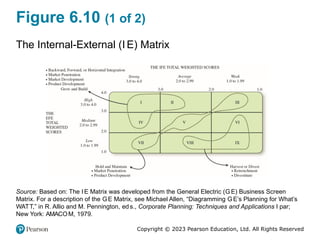
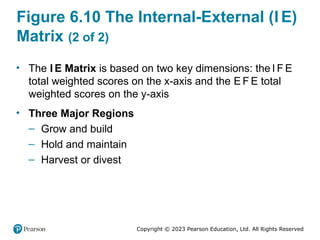
#3 6.6 Construct and apply the Internal-External (I E) Matrix.
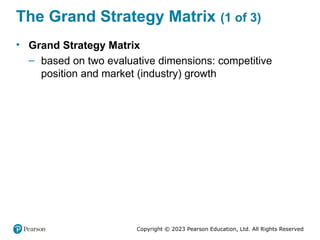
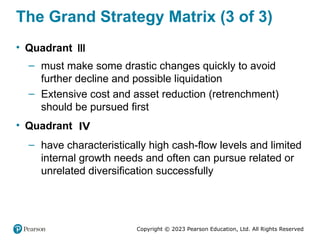
6.7 Construct and apply the Grand Strategy Matrix.
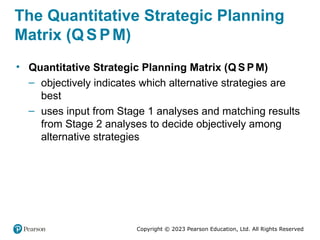
6.8 Construct and apply the Quantitative Strategic Planning Matrix (Q S P M).
6.9 Explain how to estimate costs associated with recommendations.
6.10 Discuss the role of organizational culture in strategic analysis and choice.
6.11 Identify and discuss important political considerations in strategy analysis and choice.
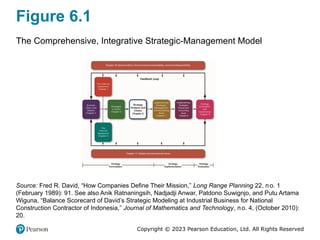
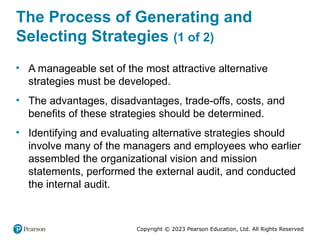
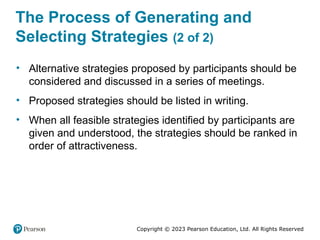
#4 This chapter focuses on generating and evaluating alternative strategies, as well as selecting strategies to pursue.
Long Description:
The top of the flowchart reads, “chapter 10: business ethics, environmental sustainability, and social responsibility.” The bottom of the flowchart reads, “chapter 11: global and international issues.” the details shown in the flowchart between chapters 10 and 11 are as follows: business vision and mission chapter 2 leads to strategies in action chapter 5, chapter 5 leads to strategy analysis and choice chapter 6, chapter 6 leads to implementing strategies: management and marketing issues chapter 7, chapter 7 leads to implementing strategies: finance and accounting issues chapter 8, chapter 8 leads to strategy evaluation and governance chapter 9, chapter 9 then leads back to business vision and mission chapter 2 in a feedback loop. The loop also results in the external assessment chapter 3 and the internal assessment chapter 4 connected to each other between chapters 2 and 5. The flowchart also shows various chapters categorized into different terms as follows: chapters 2, 3, 4, 5, and 6 are categorized as strategy formulation; chapters 7 and 8 are categorized as strategy implementation; chapter 9 is categorized as strategy evaluation. The chapter 6 is highlighted.
#5 Strategy analysis and choice seek to determine alternative courses of action that could best enable the firm to achieve its mission and objectives. Strategists never consider all feasible alternatives that could benefit the firm because there are an infinite number of possible actions and an infinite number of ways to implement those actions.
#6 Involvement provides the best opportunity for managers and employees to gain an understanding of what the firm is doing and why and to become committed to helping the firm accomplish its objectives.
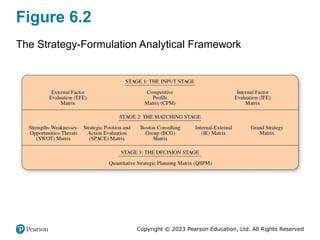
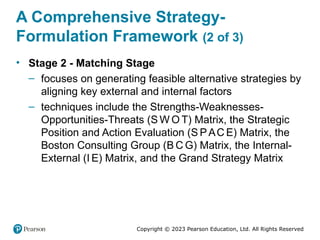
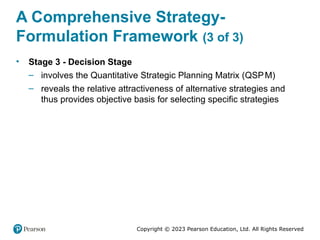
#7 Called the input stage, Stage 1 summarizes the basic input information needed to formulate strategies. Stage 2, called the matching stage, focuses on generating feasible alternative strategies by aligning key external and internal factors. Stage 3, called the decision stage, involves a single technique, the Quantitative Strategic Planning Matrix (Q S P M).
Long Description:
The figure shows the following stages:
Stage 1: The Input Stage, which includes:
• External Factor Evaluation (E F E) Matrix
• Competitive Profile Matrix (C P M)
• Internal Factor Evaluation (I F E) Matrix
Stage 2: The Matching Stage, which includes:
• Strengths-Weaknesses-Opportunities-Threats (S W O T) Matrix
• Strategic Position and Action Evaluation (S P A C E) Matrix
• Boston Consulting Group (B C G) Matrix
• Internal-External (I E) Matrix
• Grand Strategy Matrix
Stage 3: The Decision Stage, which includes:
• Quantitative Strategic Planning Matrix (Q S P M).
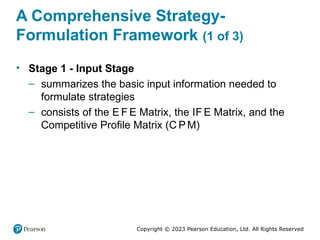
#8 Stage 1 of the strategy-formulation analytical framework consists of the External Factor Evaluation (E F E) Matrix, the Internal Factor Evaluation (I F E) Matrix, and the Competitive Profile Matrix (C P M).
#9 Stage 2 techniques include the Strengths-Weaknesses-Opportunities-Threats (SWOT) Matrix, the Strategic Position and Action Evaluation (SPACE) Matrix, the Boston Consulting Group (BCG) Matrix, the Internal-External (IE) Matrix, and the Grand Strategy Matrix.
#10 A QSPM uses input information from Stage 1 to objectively evaluate feasible alternative strategies identified in Stage 2. It reveals the relative attractiveness of alternative strategies and thus provides an objective basis for selecting specific strategies.
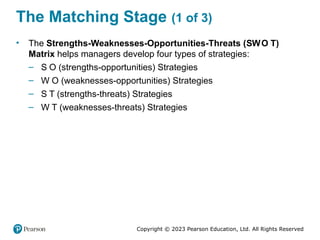
#11 The Strengths-Weaknesses-Opportunities-Threats (SWOT) Matrix is an important matching tool that helps managers develop four types of strategies.
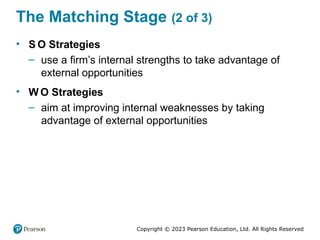
#12 SO strategies use a firm’s internal strengths to take advantage of external opportunities. All managers would like their organization to be in a position in which internal strengths can be used to take advantage of external trends and events.
WO strategies aim at improving internal weaknesses by taking advantage of external opportunities.
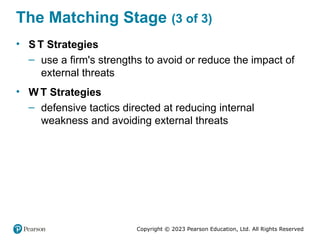
#13 ST strategies use a firm’s strengths to avoid or reduce the impact of external threats. This does not mean that a strong organization should always meet threats in the external environment head-on.
WT strategies are defensive tactics directed at reducing internal weakness and avoiding external threats. An organization faced with numerous external threats and internal weaknesses may indeed be in a precarious position.
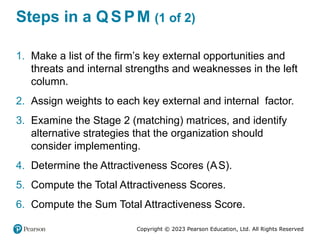
#15 The process of constructing a SWOT Matrix can be summarized in eight steps.
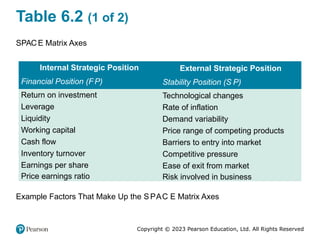
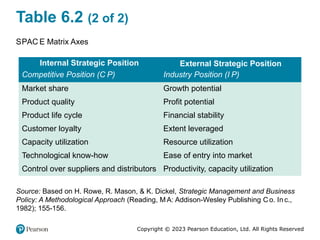
#16 The Strategic Position and Action Evaluation (S P A C E) Matrix, another important Stage 2 matching tool, is illustrated on this slide. Its four-quadrant framework indicates whether aggressive, conservative, defensive, or competitive strategies are most appropriate for a given organization.
Long Description:
The figure shows a S P A C E matrix divided into 4 quadrants with the top of the y-axis labeled F P and ranges from 0 to 7; the bottom of the y-axis is labeled S P and ranges from 0 to negative 7. The left side of the x-axis is labeled C P and ranges from 0 to negative 7, while the right side of the x-axis is labeled I P and ranges from 0 to positive 7. The details of the quadrants are as follows:
• The top right quadrant lists Aggressive with the following bullets: backward, forward, horizontal integration; market penetration; market development; product development; and diversification.
• The top left quadrant lists Conservative with the following bullets: market penetration; market development; product development; and related diversification.
• The bottom left quadrant lists Defensive with the following bullets underneath: retrenchment; divestiture; and liquidation.
• The lower right quadrant lists Competitive with the following bullets underneath: backward, forward, horizontal integration; market penetration; market development; and product development.
#18 Variables commonly included on a S P A C E matrix are listed on this slide.
#19 Variables commonly included on a S P A C E matrix are listed on this slide.
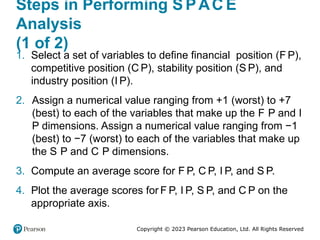
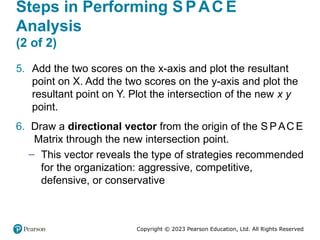
#20 The six steps to develop a S P A C E matrix are outlined on the next few slides.
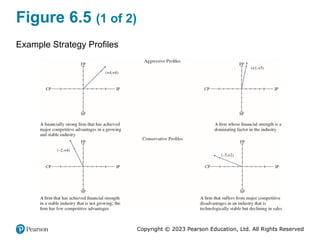
#22 Some example strategy profiles that can emerge from SPACE analysis are shown in Figure 6-5. The directional vector associated with each profile suggests the type of strategies to pursue: aggressive, conservative, defensive, or competitive.
Long Description:
The details of the profiles are as follows: aggressive profiles, graph 1: the horizontal axis ranges from C P to I P and the vertical axis ranges from S P to F P. A plot is plotted at (plus 4, plus 4). The text reads “A financially strong firm that has achieved major competitive advantages in a growing and stable industry.” Graph 2: the horizontal axis ranges from C P to I P and the vertical axis ranges from S P to F P. A plot is plotted at (plus 1, plus 5). The text reads “A firm whose financial strength is a dominating factor in the industry.” Conservative profiles, graph 1: the horizontal axis ranges from C P to I P and the vertical axis ranges from S P to F P. A plot is plotted at (negative 2, plus 4). The text reads “A firm that has achieved financial strength in a stable industry that is not growing; the firm has few competitive advantages.” Graph 2: the horizontal axis ranges from C P to I P and the vertical axis ranges from S P to F P. A plot is plotted at (negative 5, plus 2). The text reads “A firm that suffers from major competitive disadvantages in an industry that is technologically stable but declining in sales.”
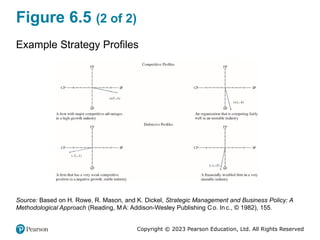
#23 Additional strategy profiles are shown on this slide.
Long Description:
The details of the profiles are as follows: competitive profiles, graph 1: the horizontal axis ranges from C P to I P and the vertical axis ranges from S P to F P. A plot is plotted at (plus 5, negative 1). The text reads “A firm with major competitive advantages in a high-growth industry.” Graph 2: the horizontal axis ranges from CP to I P and the vertical axis ranges from S P to F P. A plot is plotted at (plus 1, negative 4). The text reads “An organization that is competing fairly well in an unstable industry.” Defensive profiles, graph 1: the horizontal axis ranges from C P to I P and the vertical axis ranges from S P to F P. A plot is plotted at (negative 5, negative 1). The text reads “A firm that has a very weak competitive position in a negative growth, stable industry.” Graph 2: the horizontal axis ranges from C P to I P and the vertical axis ranges from S P to F P. A plot is plotted at (negative 1, negative 5). The text reads “A financially troubled firm in a very instable industry.”
#24 Long Description:
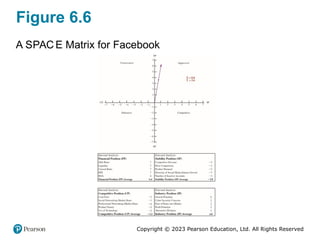
The figure shows that the S P A C E matrix divided into 4 quadrants, with value of x equal to 0.8 and value of y equal to 3.6. The top of the y-axis is labeled FP and ranges from 0 to positive 7; the bottom of the y-axis is labeled SP and ranges from 0 to negative 7. The left side of the x-axis is labeled C P and ranges from 0 to negative 7, and the right side of the x-axis is labeled IP and ranges 0 to positive 7. In the top right quadrant is aggressive; in the top left quadrant is conservative; in the bottom right quadrant is competitive; and in the bottom left quadrant is defensive with a line moving from 0 to point (0.8, 3.6).
The figure further lists the following:
• Internal analysis:
• Financial position (F P)
• Debt ratio: 7
• Liquidity: 7
• Current ratio: 7
• E P S: 7
• R O A: 4
• Financial Position (F P) Average: 6.4
• External analysis:
• Stability position (S P)
• Competitive pressure: minus 4
• Price comparison: minus 2
• Product demand: minus 2
• Diversity of social media interest served: minus 3
• Number of inactive accounts: minus 3
• Stability position (S P) average: minus 2.8
• Internal analysis:
• Competitive position (C P)
• Cash Flow: minus 2
• Social Networking Market Share: minus 1
• Professional Networking Market Share: minus 6
• Product Variety: minus 5
• Use of Technology: minus 2
• Competitive position (C P) average: minus 3.2
• Internal analysis:
• Industry position (I P)
• Growth Potential: 6
• Cyber Security Concerns: 2
• Ease of Entry into Market: 2
• Product Potential: 5
• Alternative Products: 5
• Industry position (I P) average: 4.
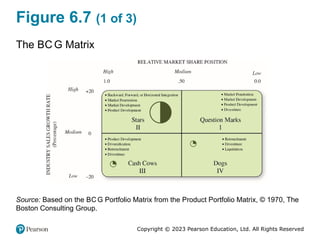
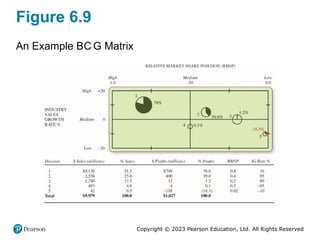
#25 Autonomous divisions (also called segments or profit centers) of an organization make up what is called a business portfolio. When a firm’s divisions compete in different industries, a separate strategy often must be developed for each business.
#26 Based on each division’s respective (x, y) coordinate, each segment can be properly positioned (centered) in a BCG Matrix. Each circle represents a separate division. The size of the circle corresponds to the proportion of corporate revenue generated by that business unit, and the pie slice indicates the proportion of corporate profits generated by that division.
Long Description:
The first graph of competitive profiles with the caption as “A firm with major competitive advantages in high-growth industry” shows that the SPACE matrix is divided into 4 quadrants, with value of x equal to 5 and value of y equal to -1. The top of the y-axis is labeled FP and bottom of the y-axis is labeled SP. The x-axis is labeled as CP and IP on both the ends. The second graph of competitive profiles with the caption as “An organization that is competing fairly well in an unstable industry” shows that the SPACE matrix is divided into 4 quadrants, with value of x equal to1 and value of y equal to -4. The top of the y-axis is labeled FP and bottom of the y-axis is labeled SP. The x-axis is labeled as CP and IP on both the ends. The first graph of defensive profiles with the caption as “A firm that has a very weak competitive position in negative growth, stable industry” shows that the SPACE matrix is divided into 4 quadrants, with value of x equal to -5 and value of y equal to -1. The top of the y-axis is labeled FP and bottom of the y-axis is labeled SP. The x-axis is labeled as CP and IP on both the ends. The second graph of defensive profiles with the caption as “A financially troubled firm in a very unstable industry” shows that the SPACE matrix is divided into 4 quadrants, with value of x equal to -1 and value of y equal to -5. The top of the y-axis is labeled FP and bottom of the y-axis is labeled SP. The x-axis is labeled as CP and IP on both the ends.
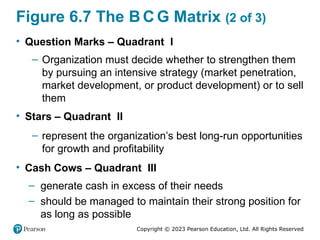
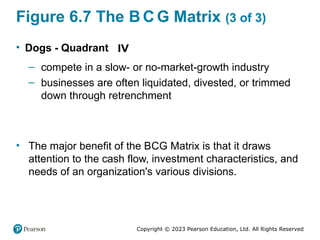
#27 Divisions in Quadrant I (upper right) have a low relative market share position, yet they compete in a high-growth industry.
Divisions in Quadrant II (upper left) represent the organization’s best long-run opportunities for growth and profitability, and are therefore called stars.
#28 Divisions in Quadrant I (upper right) have a low relative market share position, yet they compete in a high-growth industry.
Divisions in Quadrant II (upper left) represent the organization’s best long-run opportunities for growth and profitability, and are therefore called stars.
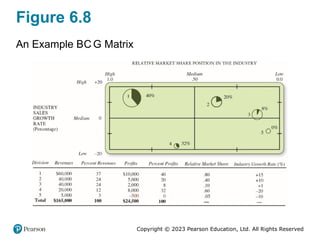
#29 Long Description:
The figure shows a matrix divided into 4 quadrants. The x-axis shows the Relative Market Share Position in the Industry ranging from 1 (high) to 0.0 (low) with 0.50 (medium) at the intersection of both the axes. The y-axis shows the percentage of industry sales growth rate ranging from minus 20 (low) to 20 (high) with 0 (medium) at the intersection of both the axes. The details of the quadrants are as follows:
• The top left quadrant shows a large circle labeled "1" with 39 percent of the "pie" filled.
• The top right quadrant shows two medium circles with one circle labeled as "2" with 20 percent of the "pie" filled and the other circle labeled as "3", which partially straddles the lower right quadrant and has 8 percent of its "pie" filled.
• The bottom left quadrant has a small circle labeled "4" with 31 percent of the "pie" filled.
• The bottom right quadrant has a small circle labeled "5" with 2 percent of the "pie" filled.
The figure shows a table, which lists the following data:
• Division:
• Revenues: 60,000 dollars
• Percent Revenues: 37
• Profits: 10,000 dollars
• Percent Profits: 40
• Relative Market Share: 0.80
• Industry Growth Rate (percentage): 15
• Division: 2
• Revenues: 40,000 dollars
• Percent Revenues: 24
• Profits: 5,000 dollars
• Percent Profits: 20
• Relative Market Share: 0.40
• Industry Growth Rate (percentage): 10
• Division: 3
• Revenues: 40,000 dollars
• Percent Revenues: 24
• Profits: 2,000 dollars
• Percent Profits: 8
• Relative Market Share: 0.10
• Industry Growth Rate (percentage): 1
• Division: 4
• Revenues: 20,000
• Percent Revenues: 12
• Profits: 8,000
• Percent Profits: 32
• Relative Market Share: 0.60
• Industry Growth Rate (percentage): minus 20
• Division: 5
• Revenues: 5,000
• Percent Revenues: 3
• Profits: minus 500
• Percent Profits: 0
• Relative Market Share: 0.05
• Industry Growth Rate (percentage): minus 10
• Total
• Revenues: 165,000 dollars
• Percent Revenues: 100
• Profits: 24,500
• Percent Profits: 100
• Relative Market Share: nil
• Industry Growth Rate (percentage): nil.
#30 Long Description:
The figure shows a matrix divided into 4 quadrants. The x-axis shows the Relative Market Share Position (RMSP) ranging from 1 to 0.0 with 0.50 at the intersection of both the axes. The y-axis shows the percentage of industry sales growth rate ranging from minus 20 to 20 with 0 at the intersection of both the axes. The details of the quadrants are as follows:
• The top left quadrant has a large circle labeled "1" with 68 percent of the "pie" filled
• The top right quadrant has two medium circles: one circle is labeled "2" with 39 percent of the "pie" filled and the other circle is labeled "3" and partially straddles the lower right quadrant and has 1.2 percent of its "pie" filled
• The bottom right quadrant has a small circle labeled "5" with 18.3 percent of the "pie" filled
• The bottom left quadrant has a small circle labeled "4" that straddles the lower right quadrant and has 0.1 percent of the "pie" filled. A table accompanies the diagram.
#31 Additional strategy profiles are shown on this slide.
Long Description:
The first graph of competitive profiles with the caption as “A firm with major competitive advantages in high-growth industry” shows that the SPACE matrix is divided into 4 quadrants, with value of x equal to 5 and value of y equal to -1. The top of the y-axis is labeled FP and bottom of the y-axis is labeled SP. The x-axis is labeled as CP and IP on both the ends. The second graph of competitive profiles with the caption as “An organization that is competing fairly well in an unstable industry” shows that the SPACE matrix is divided into 4 quadrants, with value of x equal to1 and value of y equal to -4. The top of the y-axis is labeled FP and bottom of the y-axis is labeled SP. The x-axis is labeled as CP and IP on both the ends. The first graph of defensive profiles with the caption as “A firm that has a very weak competitive position in negative growth, stable industry” shows that the SPACE matrix is divided into 4 quadrants, with value of x equal to -5 and value of y equal to -1. The top of the y-axis is labeled FP and bottom of the y-axis is labeled SP. The x-axis is labeled as CP and IP on both the ends. The second graph of defensive profiles with the caption as “A financially troubled firm in a very unstable industry” shows that the SPACE matrix is divided into 4 quadrants, with value of x equal to -1 and value of y equal to -5. The top of the y-axis is labeled FP and bottom of the y-axis is labeled SP. The x-axis is labeled as CP and IP on both the ends.
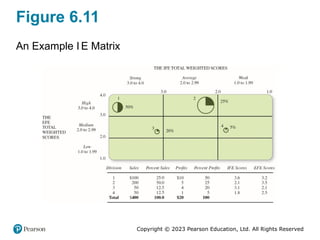
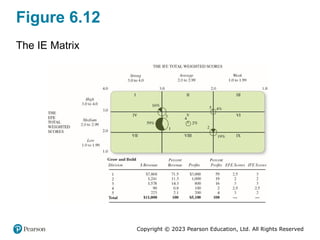
#33 As indicated by the positioning of the four circles, grow and build strategies are appropriate for Divisions 1, 2, and 3. But Division 4 is a candidate for harvest or divest. Division 2 contributes the greatest percentage of company sales and thus is represented by the largest circle. Division 1 contributes the greatest proportion of total profits; it has the largest-percentage pie slice.
Long Description:
The figure shows a matrix diagram is divided into 9 quadrants. The top of the diagram is labeled The IFE Total Weighted Scores and the left side of the diagram is labeled The EFE Total Weighted Scores. The left column is labeled as Strong and ranges from 3.0 to 4.0. The middle column is labeled as Average and ranges from 2.0 to 2.99. The right column is labeled as Weak, ranging from 1.0 to 1.99. The top row is labeled as High and ranges from 3.0 to 4.0. The middle column is labeled as Medium and ranges from 2.0 to 2.99. The right column is labeled as Low and ranges from 1.0 to 1.99. The details of the quadrants are as follows:
• The top left quadrant of the matrix is labeled Division 1 and has a medium circle with 50 percent of the "pie" filled
• The top middle quadrant is labeled Division 2 and has a large circle with 25 percent of the "pie" filled
• The middle left quadrant is labeled Division 3 and has a small circle with 20 percent of the "pie" filled
• The middle right quadrant is labeled Division 4 and has a small circle with 5 percent of the "pie" filled.
• The bottom quadrants of the matrix are empty.
The table shows the following data:
• Division: 1
• Sales: 100 dollars
• Percent Sales: 25.0
• Profits: 10 dollars
• Percent Profits: 50
• IFE Scores: 3.6
• EFE Scores: 3.2
• Division: 2
• Sales: 200 dollars
• Percent Sales: 50.0
• Profits: 5
• Percent Profits: 25
• IFE Scores: 2.1
• EFE Scores: 3.5
• Division: 3
• Sales: 50 dollars
• Percent Sales: 12.5
• Profits: 4
• Percent Profits: 20
• IFE Scores: 3.1
• EFE Scores: 2.1
• Division: 4
• Sales: 50
• Percent Sales: 12.5
• Profits: 1
• Percent Profits: 5
• IFE Scores: 1.8
• EFE Scores: 2.5
• Total
• Sales: 400 dollars
• Percent Sales: 100.0
• Profits: 20 dollars
• Percent Profits: 100.
#34 Long Description:
The figure shows a matrix diagram is divided into 9 quadrants. The top of the diagram is labeled the IFE total weighted scores and the left side of the diagram is labeled the EFE total weighted scores. The left column is labeled as strong and ranges from 3.0 to 4.0. The middle column is labeled as average and ranges from 2.0 to 2.99. The right column is labeled as weak, ranging from 1.0 to 1.99. The top row is labeled as high and ranges from 3.0 to 4.0. The middle column is labeled as medium and ranges from 2.0 to 2.99. The right column is labeled as low and ranges from 1.0 to 1.99. The details of the quadrants are as follows:
• A medium sized circle labeled 3 equally straddles quadrants I, II, IV, and V with 16 percent of the "pie" filled.
• A small sized circle labeled 5 equally straddles quadrants II, III, V, and VI with 4 percent of the "pie" filled.
• A large sized circle labeled 1 equally straddles quadrants IV and V with 59 percent of the "pie" filled.
• A small sized circle labeled 4 is in the center of quadrant V with 2 percent of the "pie" filled.
• A medium sized circle labeled 2 equally straddles quadrants V, VI, VIII, and IX with 19 percent of the "pie" filled.
The table shows the following data:
Grow and build
• Division: 1
• Revenue in dollars: 7,868
• Percentage of Revenue: 71.5
• Profit in dollars: 3,000
• Percentage of Profit: 59
• EFE Scores: 2.5
• IFE Scores: 3
• Division: 2
• Revenue in dollars: 1,241
• Percentage of Revenue: 11.3
• Profit in dollars: 1,000
• Percentage of Profit: 19
• EFE Scores: 2
• IFE Scores: 2
• Division: 3
• Revenue in dollars: 1,578
• Percentage of Revenue: 14.3
• Profit in dollars: 800
• Percentage of Profit: 16
• EFE Scores: 3
• IFE Scores: 3
• Division: 4
• Revenue in dollars: 90
• Percentage of Revenue: 0.8
• Profit in dollars: 100
• Percentage of Profit: 2
• EFE Scores: 2.5
• IFE Scores: 2.5
• Division: 5
• Revenue in dollars: 223
• Percentage of Revenue: 2.1
• Profit in dollars: 200
• Percentage of Profit: 4
• EFE Scores: 3
• IFE Scores: 2
• Total
• Revenue in dollars: 11,000 dollars
• Percentage of Revenue: 100 percent
• Profit in dollars: 5,100 dollars
• Percentage of Profit: 100 percent.
#35 All organizations can be positioned in one of the Grand Strategy Matrix’s four strategy quadrants.
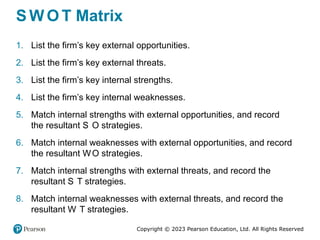
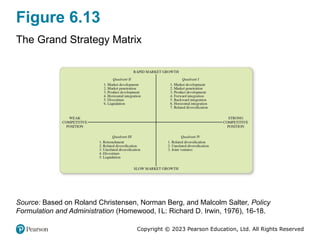
#36 The Grand Strategy Matrix is based on two evaluative dimensions: (1) competitive position on the x-axis and (2) market (industry) growth on the y-axis. Appropriate strategies for an organization to consider are listed in sequential order of attractiveness in each quadrant of the Grand Strategy Matrix.
Long Description:
The matrix is divided into 4 quadrants with the top of the y-axis labeled Rapid Market Growth, the bottom y-axis labeled Slow Market Growth, the right of the x-axis labeled Strong Competitive Position, and the left of the x-axis labeled Weak Competitive Position. The details of the quadrants are as follows:
• The top right quadrant is quadrant I and includes: market development, market penetration, product development, forward integration, backward integration, horizontal integration, and related diversification.
• The top left quadrant is quadrant II and includes: market development, market penetration, product development, horizontal integration, divestiture, and liquidation.
• The bottom left quadrant is quadrant III and includes: retrenchment, related diversification, unrelated diversification, divestiture, and liquidation.
• The bottom right quadrant is quadrant IV and includes: related diversification, unrelated diversification, and joint ventures.
#37 Divisions in Quadrant I (upper right) have a low relative market share position, yet they compete in a high-growth industry.
Divisions in Quadrant II (upper left) represent the organization’s best long-run opportunities for growth and profitability, and are therefore called stars.
#38 Divisions in Quadrant I (upper right) have a low relative market share position, yet they compete in a high-growth industry.
Divisions in Quadrant II (upper left) represent the organization’s best long-run opportunities for growth and profitability, and are therefore called stars.
#39 Other than ranking strategies to achieve the prioritized list, there is only one analytical technique in the literature designed to determine the relative attractiveness of feasible alternative actions, the QSPM.
#41 Developing a Quantitative Strategic Planning Matrix makes it less likely that key factors will be overlooked or weighted inappropriately.
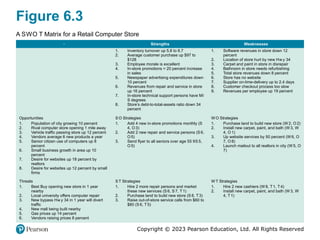
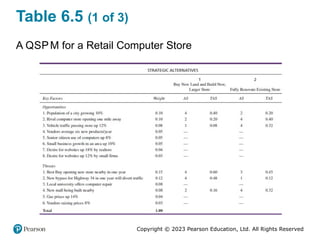
#42 A Quantitative Strategic Planning Matrix for a retail computer store is provided on the next 3 slides. This example illustrates all the components of the QSPM: strategic alternatives, key factors, weights, attractiveness scores (AS), total attractiveness scores (TAS), and the sum total attractiveness score.
Long Description:
Strategic alternatives:
• Key factors
o Opportunities
1. Population of a city growing 10 percent
• Buy new land and build new larger store
o Weight: 0.10
o AS: 4
o TAS: 0.40
• Fully renovate existing store
o AS: 2
o TAS: 0.20
2. Rival computer store opening one mile away
• Buy new land and build new larger store
o Weight: 0.10
o AS: 2
o TAS: 0.20
• Fully renovate existing store
o AS: 4
o TAS: 0.40
3. Vehicle traffic passing store up 12 percent
• Buy new land and build new larger store
o Weight: 0.08
o AS: 1
o TAS: 0.08
• Fully renovate existing store
o AS: 4
o TAS: 032
4. Vendors average six new products/year
• Buy new land and build new larger store
o Weight: 0.05
o AS: blank
• Fully renovate existing store
o AS: blank
5. Senior citizen use of computers up 8 percent
• Buy new land and build new larger store
o Weight: 0.05
o AS: blank
• Fully renovate existing store
o AS: blank
6. Small business growth in an area up 10 percent
• Buy new land and build new larger store
o Weight: 0.05
o AS: blank
• Fully renovate existing store
o AS: blank
7. Desire for websites up 18 percent by realtors
• Buy new land and build new larger store
o Weight: 0.04
o AS: blank
• Fully renovate existing store
o AS: blank
8. Desire for websites up 12 percent by small firms
• Buy new land and build new larger store
o Weight: 0.03
o AS: blank
• Fully renovate existing store
o AS: blank
o Threats
1. Best Buy opening new store nearby in one year
• Buy new land and build new larger store
o Weight: 0.15
o AS: 4
o TAS: 0.60
• Fully renovate existing store
o AS: 3
o TAS: 0.45
2. Local university offers computer repair
• Buy new land and build new larger store
o Weight: 0.08
o AS: blank
• Fully renovate existing store
o AS: blank
3. New bypass for Highway 34 in one year will divert traffic
• Buy new land and build new larger store
o Weight: 0.12
o AS: 4
o TAS: 0.48
• Fully renovate existing store
o AS: 1.0
o TAS: 0.12
4. New mall being built nearby
• Buy new land and build new larger store
o Weight: 0.08
o AS: 2
o TAS: 0.16
• Fully renovate existing store
o AS: 4
o TAS: 0.32
5. Gas prices up 14 percent
• Buy new land and build new larger store
o Weight: 0.04
o AS: blank
• Fully renovate existing store
o AS: blank
6. Vendors raising prices 8 percent
o Weight: 0.03
o AS: blank
• Fully renovate existing store
o AS: blank
o Total 1.00.
#43 Long Description:
The details of the table are as follows: Strategic alternatives
• Key factors
o Opportunities
1. Population of a city growing 10 percent
• Buy new land and build new larger store
o Weight: 0.10
o AS: 4
o TAS: 0.40
• Fully renovate existing store
o AS: 2
o TAS: 0.20
2. Rival computer store opening one mile away
• Buy new land and build new larger store
o Weight: 0.10
o AS: 2
o TAS: 0.20
• Fully renovate existing store
o AS: 4
o TAS: 0.40
3. Vehicle traffic passing store up 12 percent
• Buy new land and build new larger store
o Weight: 0.08
o AS: 1
o TAS: 0.08
• Fully renovate existing store
o AS: 4
o TAS: 032
4. Vendors average six new products/year
• Buy new land and build new larger store
o Weight: 0.05
o AS: blank
• Fully renovate existing store
o AS: blank
5. Senior citizen use of computers up 8 percent
• Buy new land and build new larger store
o Weight: 0.05
o AS: blank
• Fully renovate existing store
o AS: blank
6. Small business growth in an area up 10 percent
• Buy new land and build new larger store
o Weight: 0.05
o AS: blank
• Fully renovate existing store
o AS: blank
7. Desire for websites up 18 percent by realtors
• Buy new land and build new larger store
o Weight: 0.04
o AS: blank
• Fully renovate existing store
o AS: blank
8. Desire for websites up 12 percent by small firms
• Buy new land and build new larger store
o Weight: 0.03
o AS: blank
• Fully renovate existing store
o AS: blank
o Threats
1. Best Buy opening new store nearby in one year
• Buy new land and build new larger store
o Weight: 0.15
o AS: 4
o TAS: 0.60
• Fully renovate existing store
o AS: 3
o TAS: 0.45
2. Local university offers computer repair
• Buy new land and build new larger store
o Weight: 0.08
o AS: blank
• Fully renovate existing store
o AS: blank
3. New bypass for Highway 34 in one year will divert traffic
• Buy new land and build new larger store
o Weight: 0.12
o AS: 4
o TAS: 0.48
• Fully renovate existing store
o AS: 1.0
o TAS: 0.12
4. New mall being built nearby
• Buy new land and build new larger store
o Weight: 0.08
o AS: 2
o TAS: 0.16
• Fully renovate existing store
o AS: 4
o TAS: 0.32
5. Gas prices up 14 percent
• Buy new land and build new larger store
o Weight: 0.04
o AS: blank
• Fully renovate existing store
o AS: blank
6. Vendors raising prices 8 percent
o Weight: 0.03
o AS: blank
• Fully renovate existing store
o AS: blank
o Total 1.00.
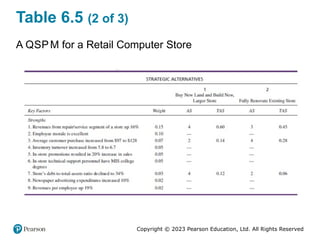
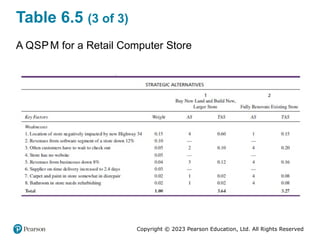
#44 Long Description:
The details of the table are as follows: Strategic alternatives
o Weaknesses
1. Revenues from software segment of a store down 12 percent
• Buy new land and build new larger store
o Weight: 0.10
o AS: blank
• Fully renovate existing store
o AS: blank
2. Location of store negatively impacted by new Highway 34
• Buy new land and build new larger store
o Weight: 0.15
o AS: 4
o TAS: 0.60
• Fully renovate existing store
o AS: 1
o TAS: 0.15
3. Carpet and paint in store somewhat in disrepair
• Buy new land and build new larger store
o Weight: 0.02
o AS: 1
o TAS: 0.02
• Fully renovate existing store
o AS: 4
o TAS: 0.08
4. Bathroom in store needs refurbishing
• Buy new land and build new larger store
o Weight: 0.02
o AS: 1
o TAS: 0.02
• Fully renovate existing store
o AS: 4
o TAS: 0.08
5. Revenues from businesses down 8 percent
• Buy new land and build new larger store
o Weight: 0.04
o AS: 3
o TAS: 0.12
• Fully renovate existing store
o AS: 4
o TAS: 0.16
6. Store has no website
• Buy new land and build new larger store
o Weight: 0.05
o AS: blank
• Fully renovate existing store
o AS: blank
7. Supplier on-time delivery increased to 2.4 days
• Buy new land and build new larger store
o Weight: 0.03
o AS: blank
• Fully renovate existing store
o AS: blank
8. Often customers have to wait to check out
• Buy new land and build new larger store
o Weight: 0.05
o AS: 2
o TAS: .10
• Fully renovate existing store
o AS: 4
o TAS: 0.20
o Total
• Buy new land and build new larger store
o Weight: 1.00
o TAS: 3.64
• Fully renovate existing store
o TAS: 3.27.
#45 All organizations are political. Unless managed, political maneuvering consumes valuable time, subverts organizational objectives, diverts human energy, and results in the loss of some valuable employees.
#46 All organizations are political. Unless managed, political maneuvering consumes valuable time, subverts organizational objectives, diverts human energy, and results in the loss of some valuable employees.

![Copyright © 2023 Pearson Education, Ltd. All Rights Reserved
Figure 6.4 The S PAC E Matrix (2 of 3)
• Strategic Position and Action Evaluation (S P AC E)
Matrix
– four-quadrant framework indicates whether aggressive,
conservative, defensive, or competitive strategies are
most appropriate for a given organization
• Two internal dimensions (financial position [F P] and
competitive position [C P])
• Two external dimensions (stability position [S P] and
industry position [I P])
• Most important determinants of an organization’s overall
strategic position](https://image.slidesharecdn.com/revisedchapter6strategiesanalysisandchoice-250508084521-d6c8de6a/85/REVISED-CHAPTER-6-STRATEGIES-ANALYSIS-AND-CHOICE-pptx-17-320.jpg)


![ch 6 [Autosaved].ppt](https://cdn.slidesharecdn.com/ss_thumbnails/ch6autosaved-230113115447-2745ff6b-thumbnail.jpg?width=640&height=640&fit=bounds)


