Download to read offline


![Ch. 6-29
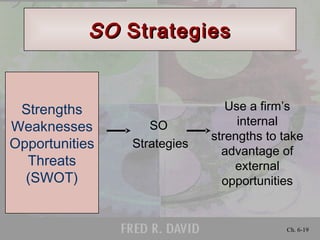
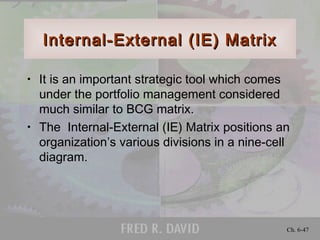
Strategy Analysis &Strategy Analysis &
ChoiceChoice
Strategic Position & Action
Evaluation Matrix (SPACE)
• Two Internal Dimensions
Financial Position [FP]
Competitive Position [CP]
• Two External Dimensions
Stability Position [SP]
Industry Position [IP]](https://image.slidesharecdn.com/chapter6-171101113526/85/Chapter-6-29-320.jpg)
![Ch. 6-30
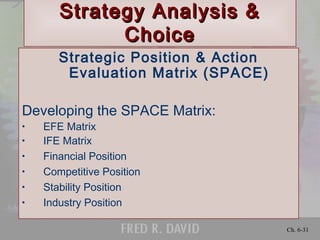
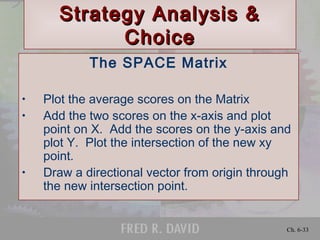
Strategy Analysis &Strategy Analysis &
ChoiceChoice
Strategic Position & Action
Evaluation Matrix (SPACE)
Overall Strategic position determined by:
• Financial Position [FP]
• Competitive Position [CP]
• Stability Position [SP]
• Industry Position [IP]](https://image.slidesharecdn.com/chapter6-171101113526/85/Chapter-6-30-320.jpg)


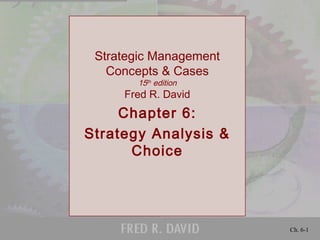
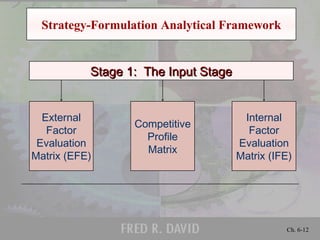
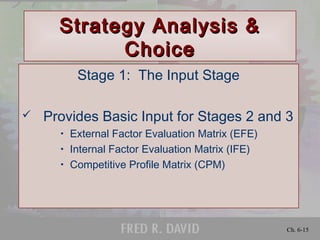
This document provides an overview of strategic analysis and choice in strategic management. It discusses various frameworks and analytical tools used to generate, evaluate, and select strategies, including: 1) The strategy formulation analytical framework, which is a 3-stage process of gathering inputs, matching internal/external factors, and making strategic decisions. 2) Tools for strategic analysis such as SWOT, SPACE, BCG, IE, Grand Strategy matrices. 3) The Quantitative Strategic Planning Matrix (QSPM) which allows for objective evaluation of alternative strategies based on critical success factors.


![business research method chp 7]](https://cdn.slidesharecdn.com/ss_thumbnails/brmchp7-160111102915-thumbnail.jpg?width=640&height=640&fit=bounds)


![Ishq kisi ki zaat nahi [kutubistan.blogspot.com]](https://cdn.slidesharecdn.com/ss_thumbnails/ishqkisikizaatnahikutubistan-171101135219-thumbnail.jpg?width=640&height=640&fit=bounds)