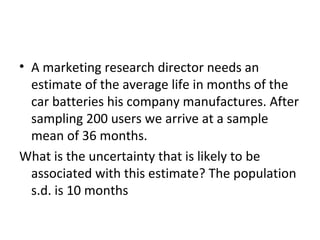
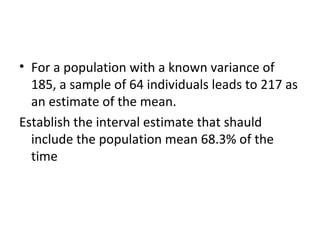
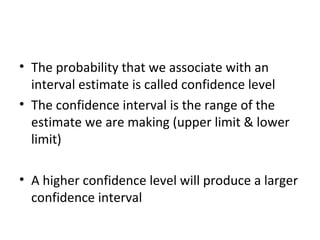
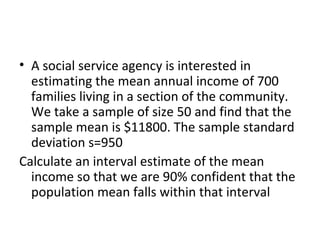
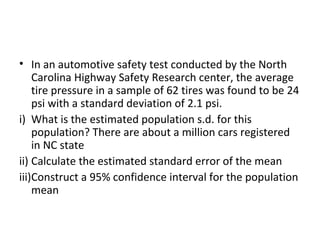
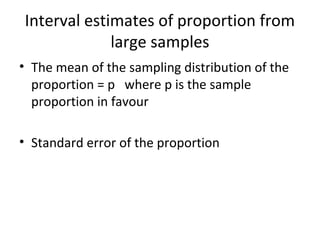
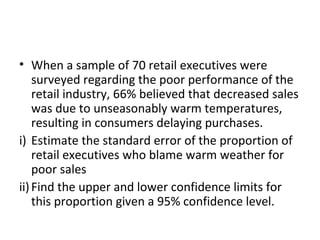
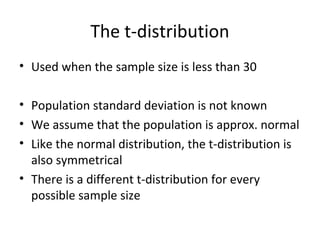
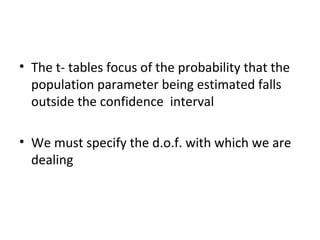
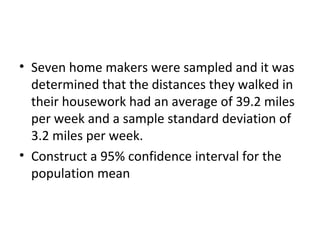
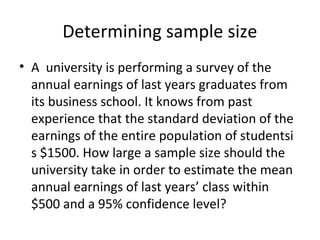
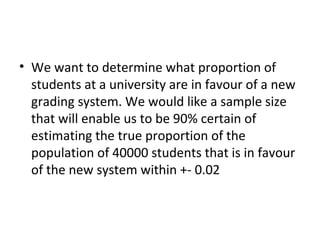
Estimation-2
Interval estimates
• An interval estimate describes a range of
  values within which the population parameter
  is likely to be
• A marketing research director needs an
  estimate of the average life in months of the
  car batteries his company manufactures. After
  sampling 200 users we arrive at a sample
  mean of 36 months.
What is the uncertainty that is likely to be
  associated with this estimate? The population
  s.d. is 10 months
• For a population with a known variance of
  185, a sample of 64 individuals leads to 217 as
  an estimate of the mean.
Establish the interval estimate that shauld
  include the population mean 68.3% of the
  time
• The probability that we associate with an
  interval estimate is called confidence level
• The confidence interval is the range of the
  estimate we are making (upper limit & lower
  limit)

• A higher confidence level will produce a larger
  confidence interval
• A social service agency is interested in
  estimating the mean annual income of 700
  families living in a section of the community.
  We take a sample of size 50 and find that the
  sample mean is $11800. The sample standard
  deviation s=950
Calculate an interval estimate of the mean
  income so that we are 90% confident that the
  population mean falls within that interval
• In an automotive safety test conducted by the North
    Carolina Highway Safety Research center, the average
    tire pressure in a sample of 62 tires was found to be 24
    psi with a standard deviation of 2.1 psi.
i) What is the estimated population s.d. for this
    population? There are about a million cars registered
    in NC state
ii) Calculate the estimated standard error of the mean
iii)Construct a 95% confidence interval for the population
    mean
Interval estimates of proportion from
             large samples
• The mean of the sampling distribution of the
  proportion = p where p is the sample
  proportion in favour

• Standard error of the proportion
• When a sample of 70 retail executives were
    surveyed regarding the poor performance of the
    retail industry, 66% believed that decreased sales
    was due to unseasonably warm temperatures,
    resulting in consumers delaying purchases.
i) Estimate the standard error of the proportion of
    retail executives who blame warm weather for
    poor sales
ii) Find the upper and lower confidence limits for
    this proportion given a 95% confidence level.
The t-distribution
• Used when the sample size is less than 30

• Population standard deviation is not known
• We assume that the population is approx. normal
• Like the normal distribution, the t-distribution is
  also symmetrical
• There is a different t-distribution for every
  possible sample size
• The t- tables focus of the probability that the
  population parameter being estimated falls
  outside the confidence interval

• We must specify the d.o.f. with which we are
  dealing
• Seven home makers were sampled and it was
  determined that the distances they walked in
  their housework had an average of 39.2 miles
  per week and a sample standard deviation of
  3.2 miles per week.
• Construct a 95% confidence interval for the
  population mean
Determining sample size
• A university is performing a survey of the
  annual earnings of last years graduates from
  its business school. It knows from past
  experience that the standard deviation of the
  earnings of the entire population of studentsi
  s $1500. How large a sample size should the
  university take in order to estimate the mean
  annual earnings of last years’ class within
  $500 and a 95% confidence level?
• We want to determine what proportion of
  students at a university are in favour of a new
  grading system. We would like a sample size
  that will enable us to be 90% certain of
  estimating the true proportion of the
  population of 40000 students that is in favour
  of the new system within +- 0.02
Estimation 2

Estimation 2

  • 1.
  • 2.
    Interval estimates • Aninterval estimate describes a range of values within which the population parameter is likely to be
  • 3.
    • A marketingresearch director needs an estimate of the average life in months of the car batteries his company manufactures. After sampling 200 users we arrive at a sample mean of 36 months. What is the uncertainty that is likely to be associated with this estimate? The population s.d. is 10 months
  • 4.
    • For apopulation with a known variance of 185, a sample of 64 individuals leads to 217 as an estimate of the mean. Establish the interval estimate that shauld include the population mean 68.3% of the time
  • 5.
    • The probabilitythat we associate with an interval estimate is called confidence level • The confidence interval is the range of the estimate we are making (upper limit & lower limit) • A higher confidence level will produce a larger confidence interval
  • 6.
    • A socialservice agency is interested in estimating the mean annual income of 700 families living in a section of the community. We take a sample of size 50 and find that the sample mean is $11800. The sample standard deviation s=950 Calculate an interval estimate of the mean income so that we are 90% confident that the population mean falls within that interval
  • 8.
    • In anautomotive safety test conducted by the North Carolina Highway Safety Research center, the average tire pressure in a sample of 62 tires was found to be 24 psi with a standard deviation of 2.1 psi. i) What is the estimated population s.d. for this population? There are about a million cars registered in NC state ii) Calculate the estimated standard error of the mean iii)Construct a 95% confidence interval for the population mean
  • 9.
    Interval estimates ofproportion from large samples • The mean of the sampling distribution of the proportion = p where p is the sample proportion in favour • Standard error of the proportion
  • 10.
    • When asample of 70 retail executives were surveyed regarding the poor performance of the retail industry, 66% believed that decreased sales was due to unseasonably warm temperatures, resulting in consumers delaying purchases. i) Estimate the standard error of the proportion of retail executives who blame warm weather for poor sales ii) Find the upper and lower confidence limits for this proportion given a 95% confidence level.
  • 11.
    The t-distribution • Usedwhen the sample size is less than 30 • Population standard deviation is not known • We assume that the population is approx. normal • Like the normal distribution, the t-distribution is also symmetrical • There is a different t-distribution for every possible sample size
  • 12.
    • The t-tables focus of the probability that the population parameter being estimated falls outside the confidence interval • We must specify the d.o.f. with which we are dealing
  • 13.
    • Seven homemakers were sampled and it was determined that the distances they walked in their housework had an average of 39.2 miles per week and a sample standard deviation of 3.2 miles per week. • Construct a 95% confidence interval for the population mean
  • 14.
    Determining sample size •A university is performing a survey of the annual earnings of last years graduates from its business school. It knows from past experience that the standard deviation of the earnings of the entire population of studentsi s $1500. How large a sample size should the university take in order to estimate the mean annual earnings of last years’ class within $500 and a 95% confidence level?
  • 15.
    • We wantto determine what proportion of students at a university are in favour of a new grading system. We would like a sample size that will enable us to be 90% certain of estimating the true proportion of the population of 40000 students that is in favour of the new system within +- 0.02