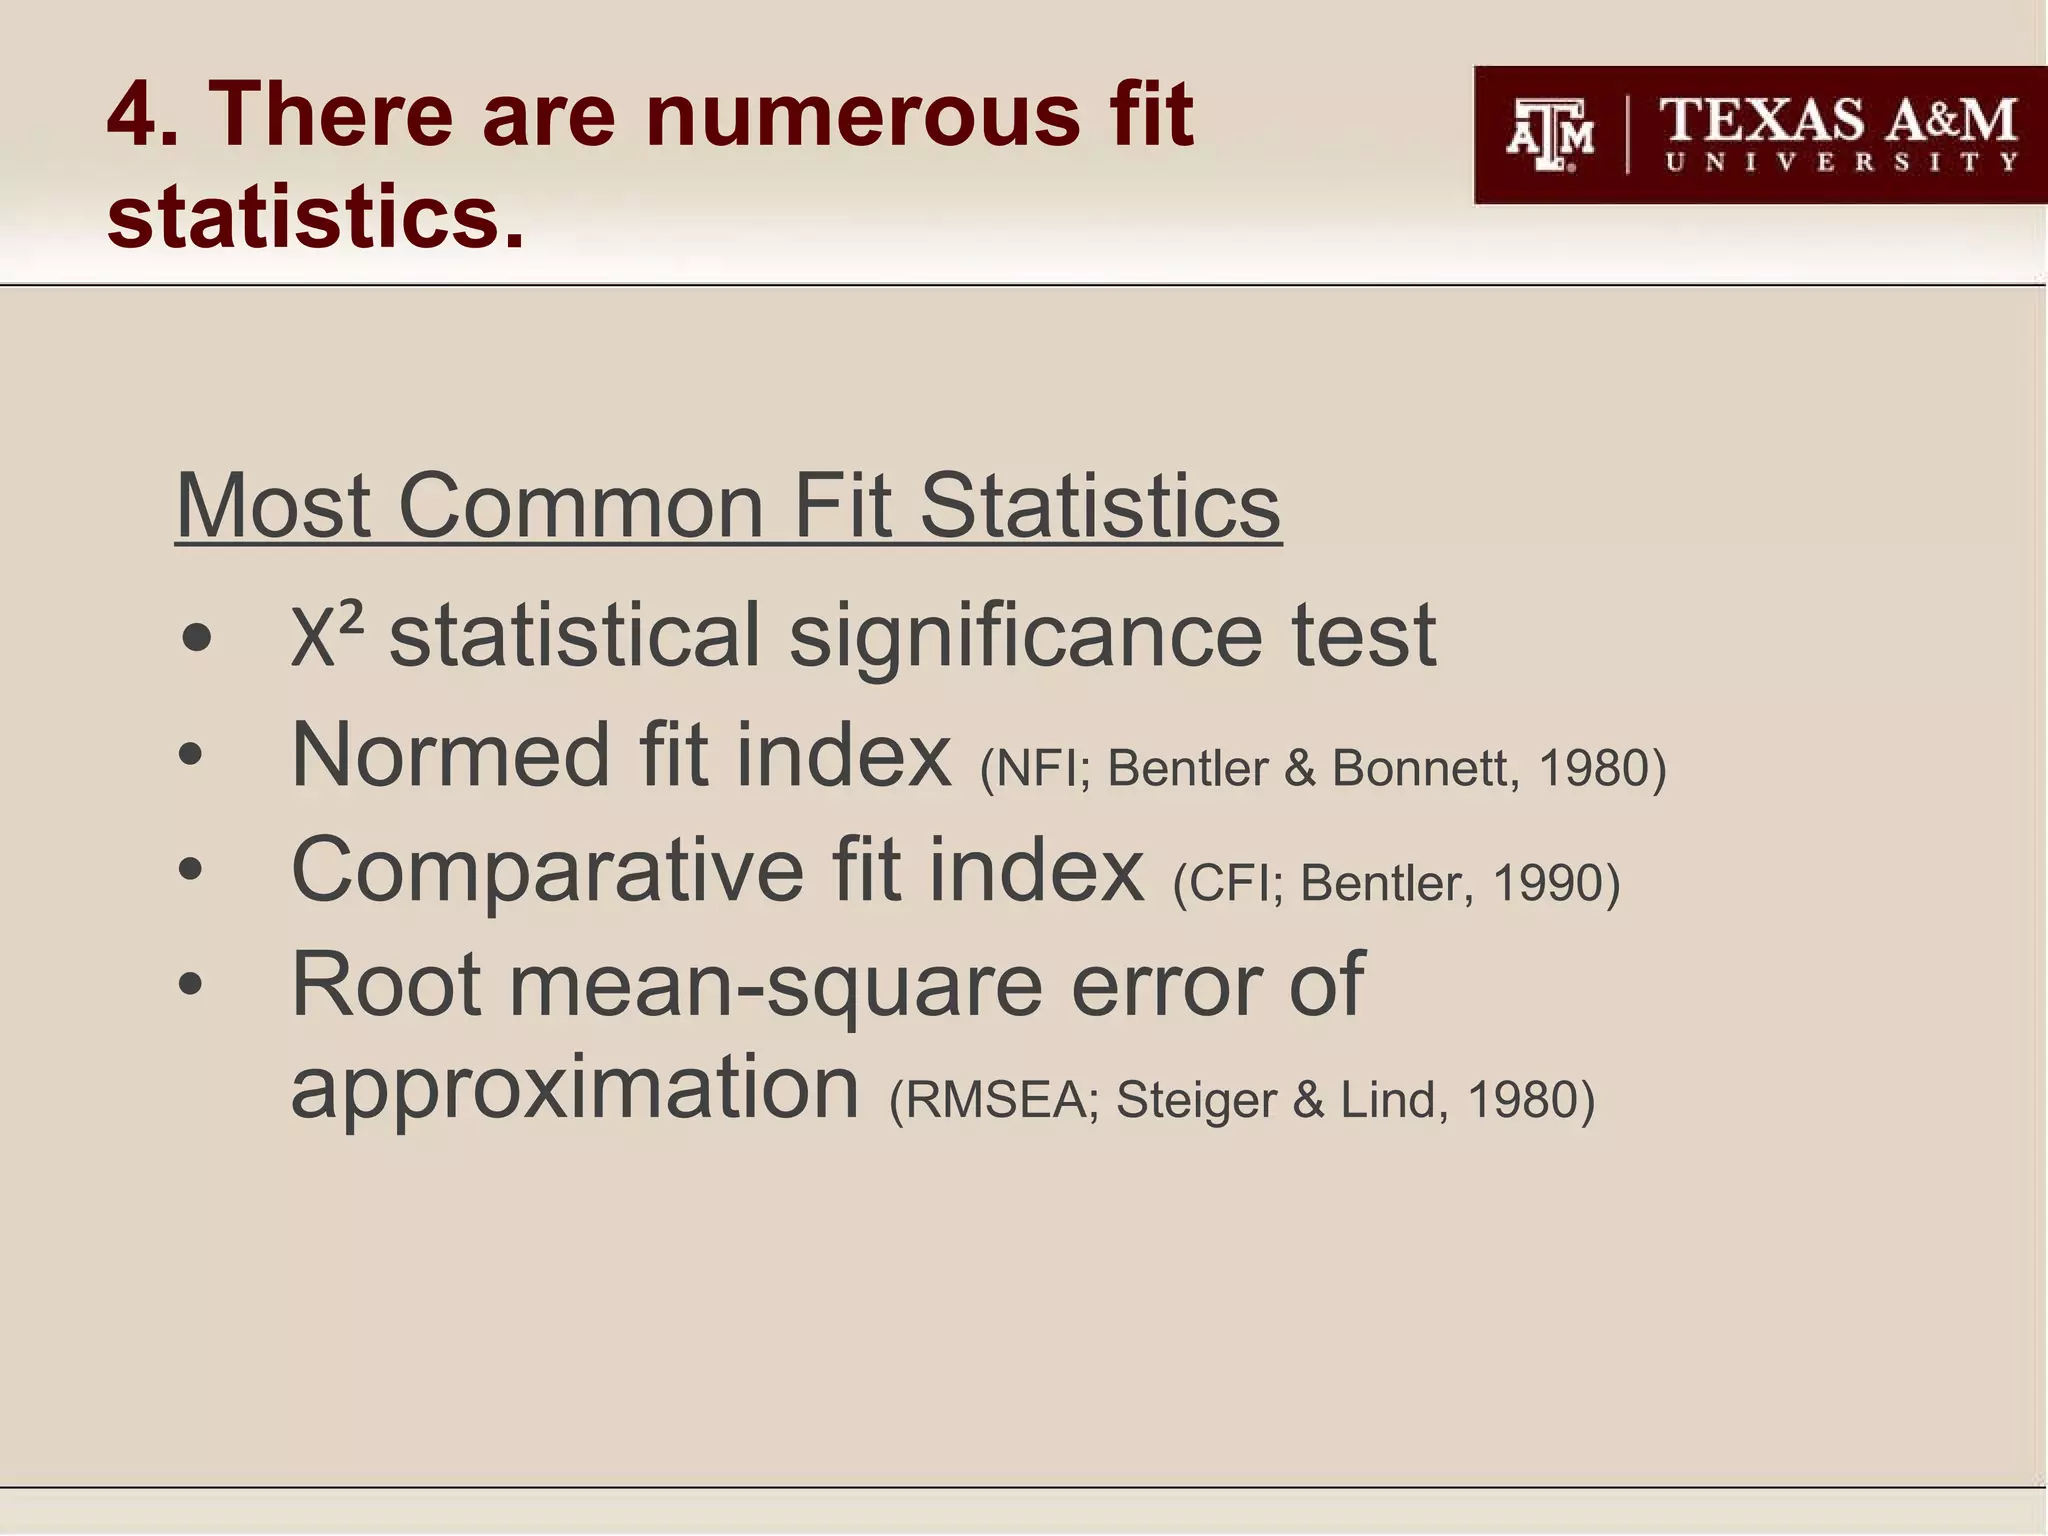
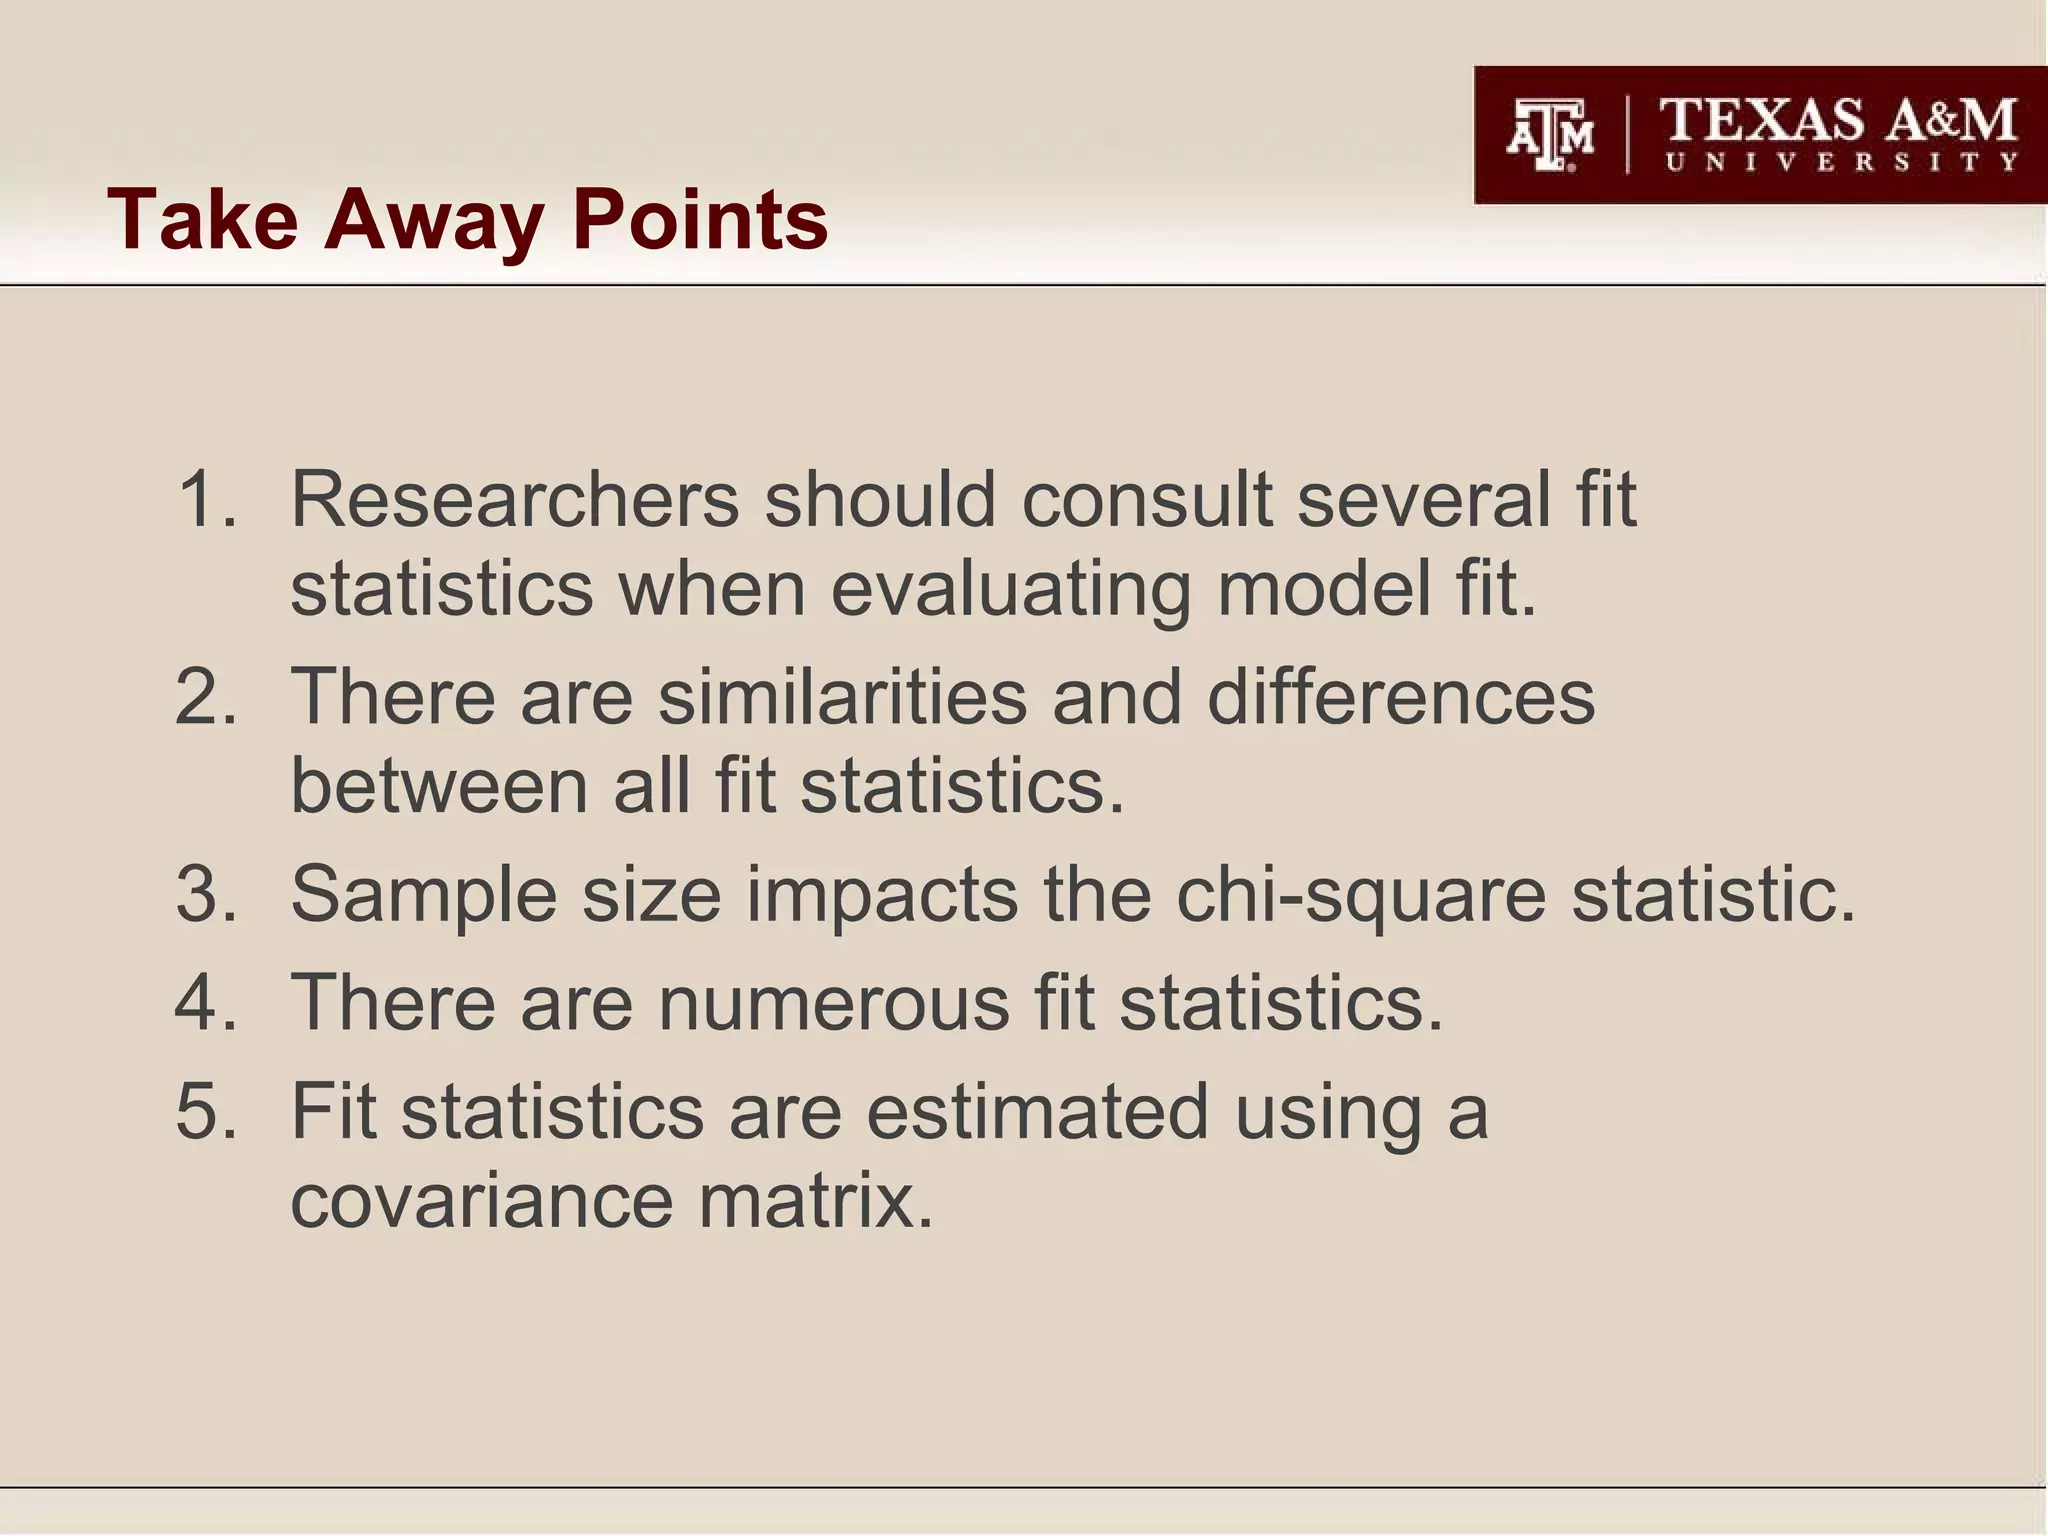
1. Researchers should consult multiple fit statistics when evaluating the fit of a confirmatory factor analysis model as no single statistic is ideal.
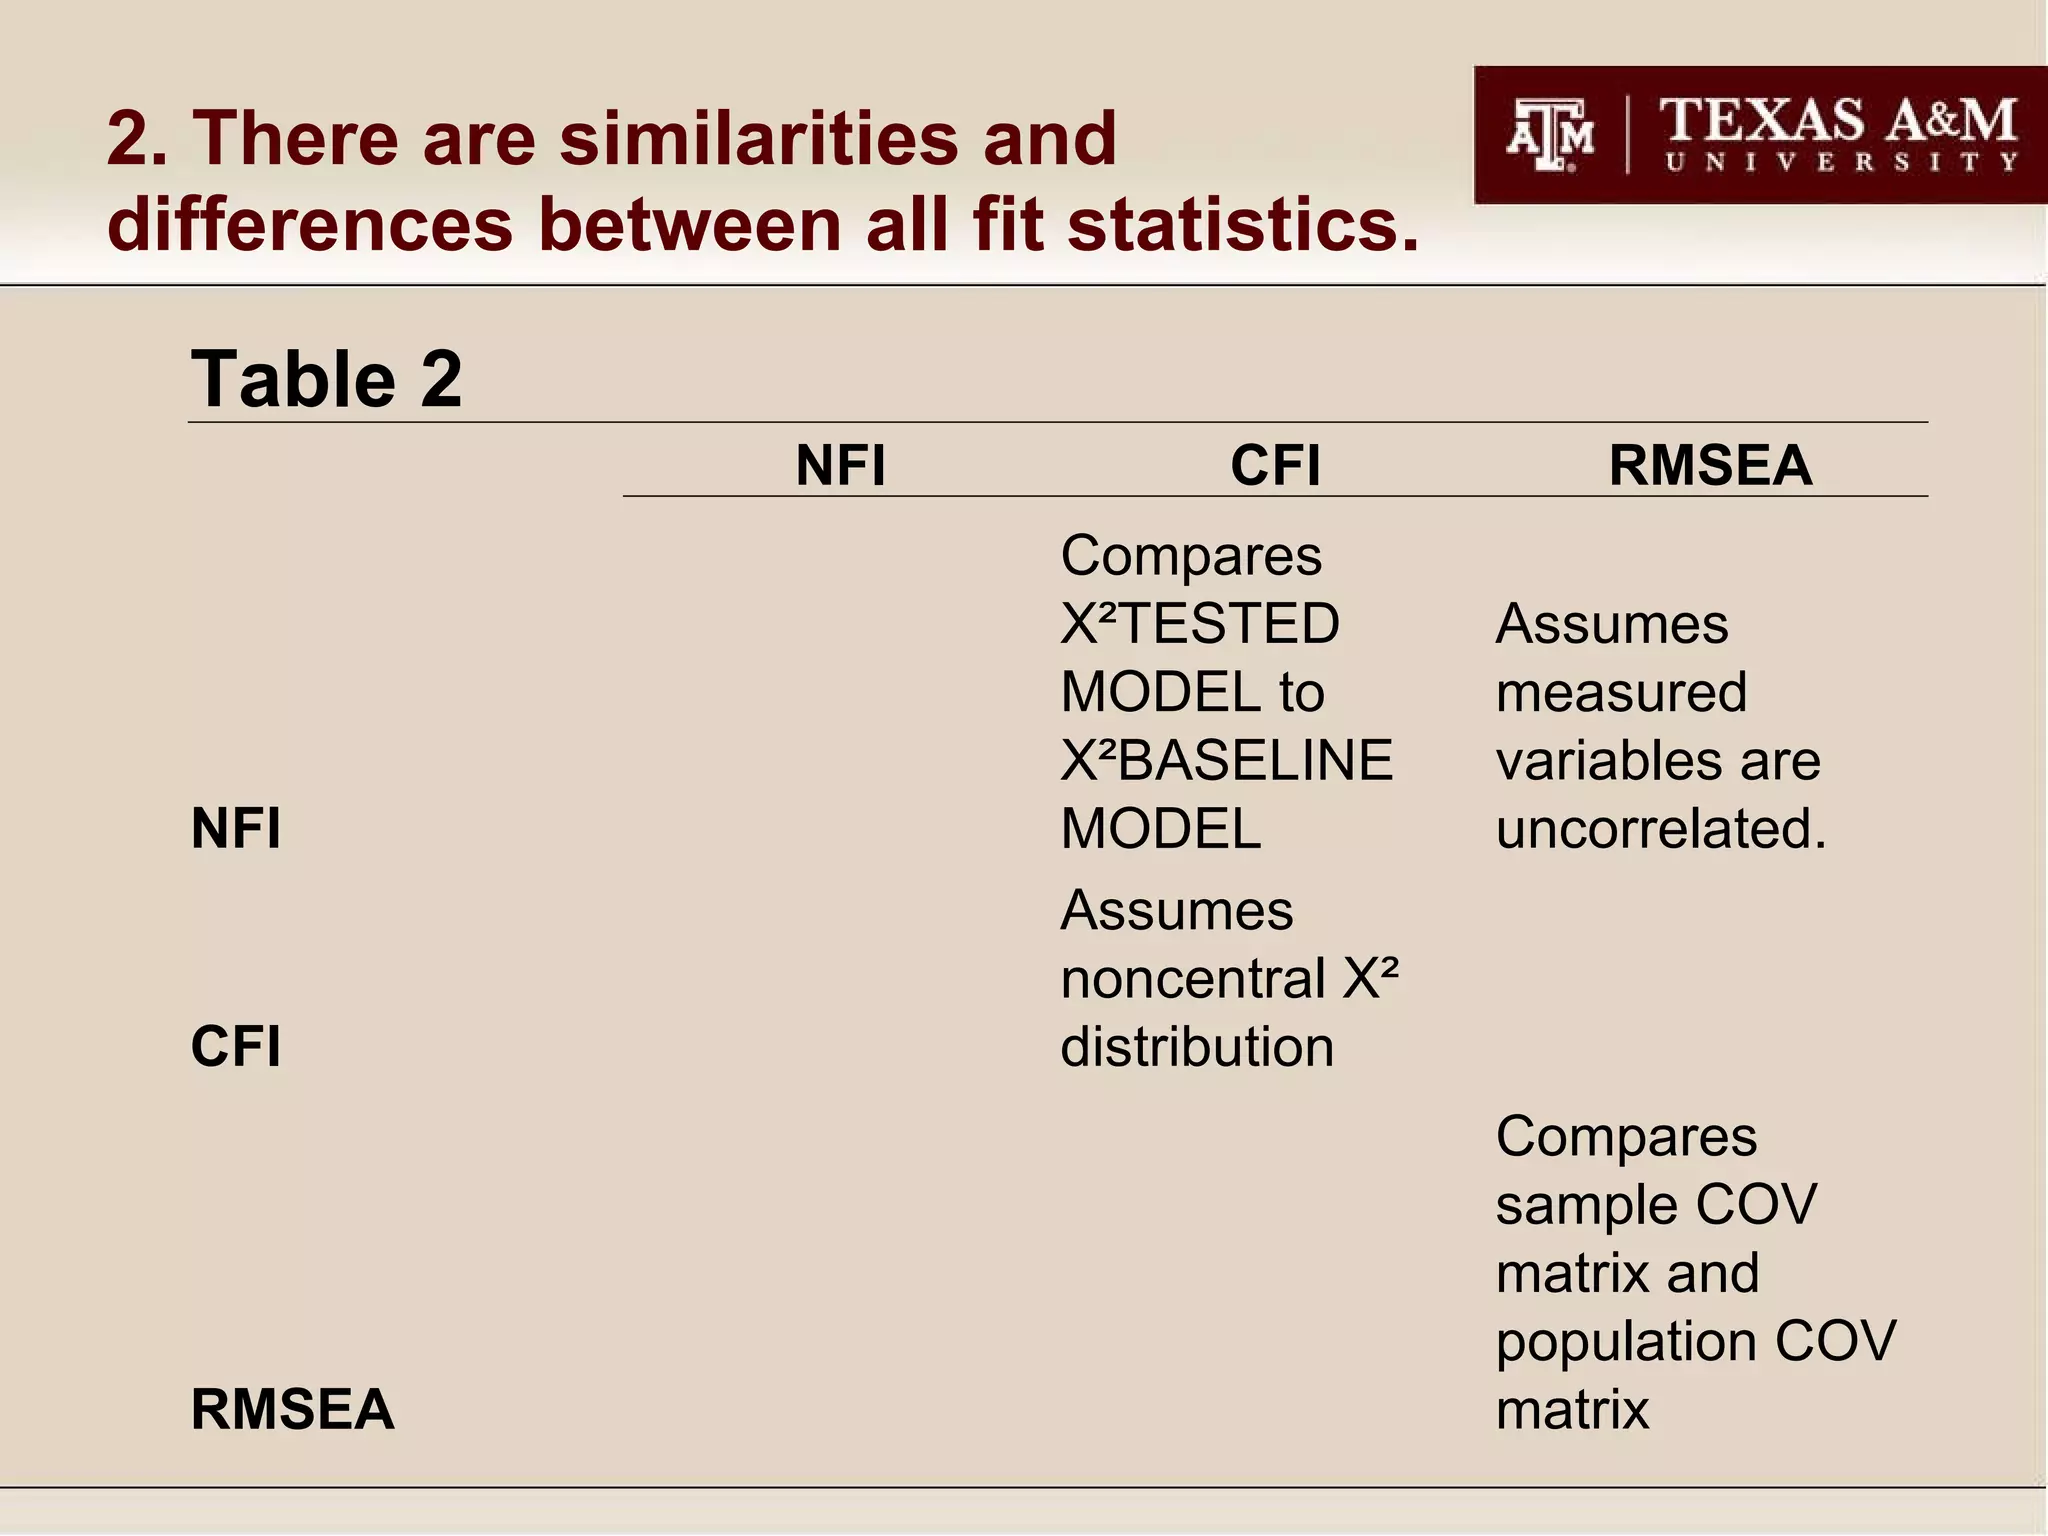
2. Different fit statistics were developed with different rationales and assess model fit in various ways.
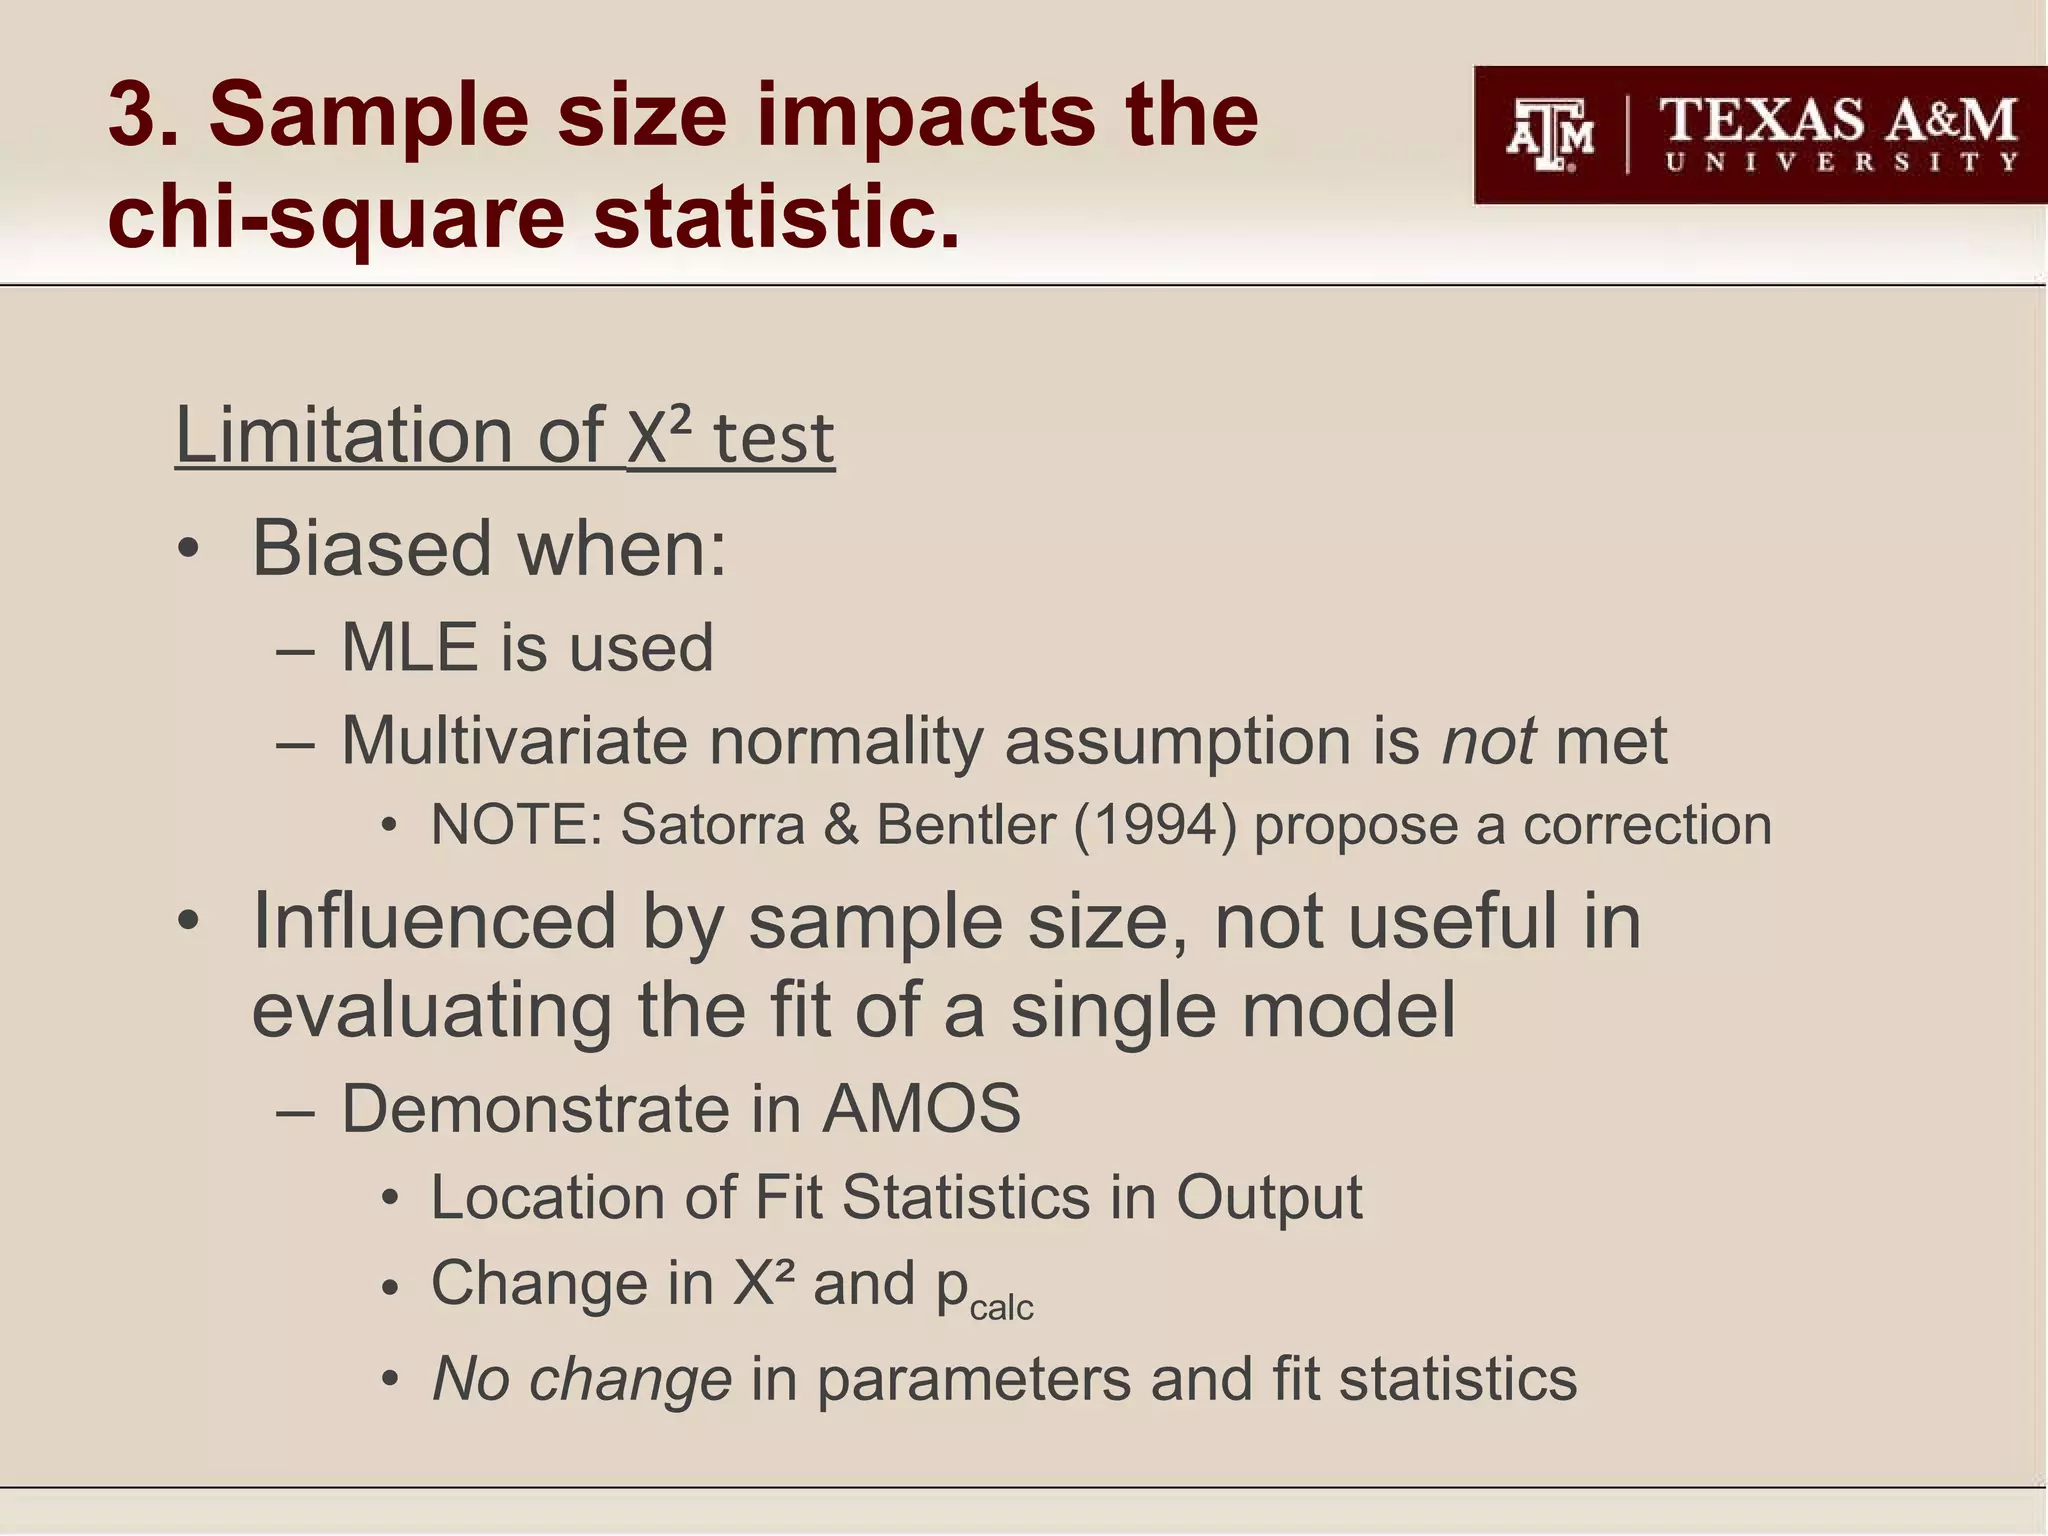
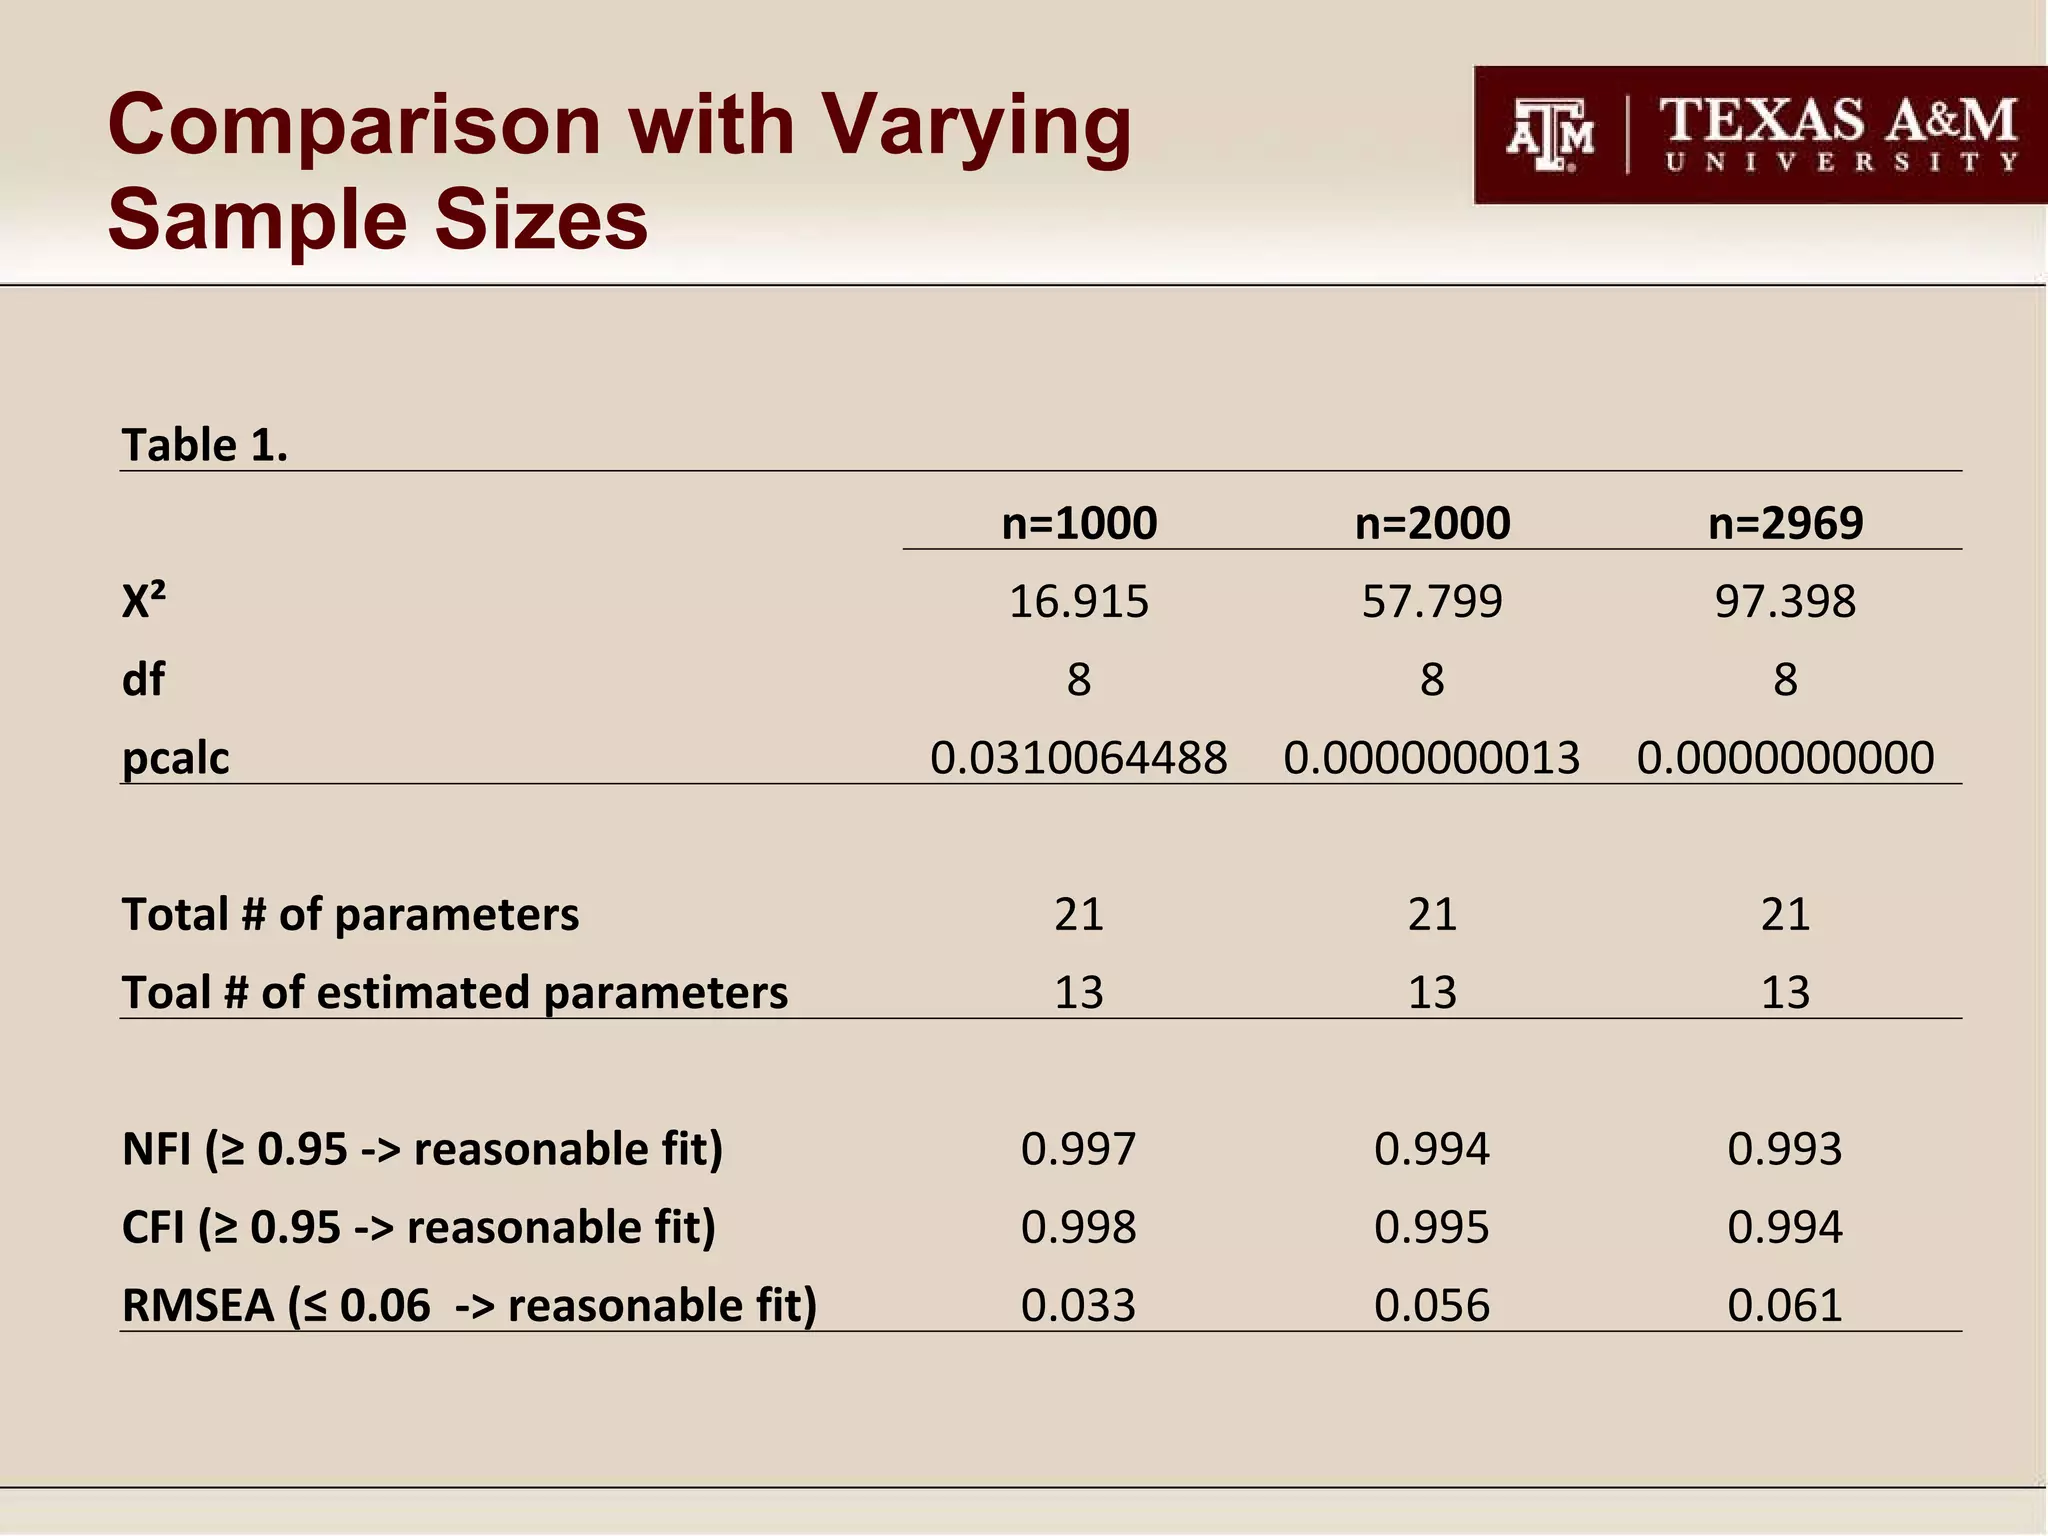
3. Sample size impacts the chi-square statistic, with larger samples increasing the likelihood of rejection.