This document summarizes benchmarks performed on the Ceph distributed file system deployed on an OpenStack cloud. The benchmarks measure performance metrics such as bandwidth, latency, and throughput. Results show that Ceph has good performance and scalability when increasing client requests and data sizes. A variety of tests were used, including Bonnie++, DD, RADOS Bench, OSD Tell, Iperf, and Netcat. Ceph installation on the OpenStack cloud involved preparing nodes, creating a storage cluster, and configuring MON, MDS, and OSD daemons.
![CEPH DISTRIBUTED FILE SYSTEM
BENCHMARKS ON AN OPENSTACK CLOUD
X. Zhang(zxuuzx@gmail.com), S. Gaddam(gcg047@my.utsa.edu), A. T. Chronopoulos(antony.tc@gmail.com)
Department of Computer Science
University of Texas at San Antonio
1 UTSA Circle, San Antonio, Texas 78249, USA
.
ABSTRACT—Ceph, is a distributed file system that
provides high performance, reliability, and scalability.
Ceph maximizes the separation between data and
metadata management by replacing allocation tables with
a pseudo-random data distribution function (CRUSH)
designed for heterogeneous and dynamic clusters of
unreliable object storage devices (OSDs). In this paper, we
investigate the performance of Ceph on an Open Stack
cloud using well-known benchmarks. Our results show its
good performance and scalability.
Keywords- OpenStack Cloud, Ceph distributed file storage,
benchmarks
I. INTRODUCTION
Ceph, is a scalable, open source, software-defined storage
system that runs on commodity hardware [1-6] [8-9]. Ceph has
been developed from the ground up to deliver object, block,
and file system storage in a single software platform that is
self-managing, self-healing and has no single point of failure.
Because of its highly scalable, software defined storage
architecture, Ceph is an ideal replacement for legacy storage
systems and a powerful storage solution for object and block
storage for cloud computing environments [3].
Some prior works exist on Ceph performance evaluation on
clusters [19], [20].
In this paper, we present a Ceph architecture and map it to
an OpenStack cloud. We study the functionality of Ceph
using benchmarks such as Bonnie ++, DD, Rados Bench, OSD
Tell, IPerf and Netcat with respect to the speed of data being
copied and also the read/write performance of Ceph using
different benchmarks. Our results show the good performance
and scalability of Ceph in terms of increasing clients request
and data sizes.
II. CEPH ARCHITECTURE
We next outline the Ceph storage cluster. The Ceph storage
cluster is made up of several different software daemons. Each
of these daemons takes care of unique Ceph functionalities
and adds values to its corresponding components [5].
Reliable Autonomic Distributed Object Store (RADOS) is
the foundation of the Ceph storage cluster. Everything in Ceph
is stored in the form of objects, and the RADOS object store is
responsible for storing these objects, irrespective of their data
type.
Ceph Daemons: Data gets stored in Ceph Object Storage
Device (OSD) in the form of objects. This is the only
component of a Ceph cluster where actual user data is stored
and the same data is retrieved when a client issues a read
operation.
Ceph monitors (MONs) track the health of the entire cluster
by keeping a map of the cluster state, which includes OSD,
MON, PG, and CRUSH maps. All the cluster nodes report to
monitor nodes and share information about every change in
their state. A monitor maintains a separate map of information
for each component.
Librados library is a convenient way to get access to RADOS
with the support of the PHP, Ruby, Java, Python, C, and C++
programming languages. It provides a native interface to the
Ceph storage cluster, RADOS, and a base for other services
such as RBD, RGW, as well as the POSIX interface for Ceph
file system.
Ceph Block Device, formerly known as RADOS block
device (RBD), provides block storage, which can be mapped,
formatted, and mounted just like any other disk to the server.
A Ceph block device is equipped with enterprise storage
features such as thin provisioning and snapshots.
Ceph Metadata Server (MDS) keeps track of file hierarchy
and stores metadata only for CephFS.
Ceph File System (CephFS) offers a POSIX-compliant,
distributed file system of any size. CephFS relies on Ceph
MDS to keep track of file hierarchy.](https://image.slidesharecdn.com/8ba3a204-b6d9-48cc-a93e-81f39ce8945b-160324223418/85/Ceph-1-320.jpg)
![CEPH DISTRIBUTED FILE SYSTEM
BENCHMARKS ON AN OPENSTACK CLOUD
X. Zhang(zxuuzx@gmail.com), S. Gaddam(gcg047@my.utsa.edu), A. T. Chronopoulos(antony.tc@gmail.com)
Department of Computer Science
University of Texas at San Antonio
1 UTSA Circle, San Antonio, Texas 78249, USA
.
ABSTRACT—Ceph, is a distributed file system that
provides high performance, reliability, and scalability.
Ceph maximizes the separation between data and
metadata management by replacing allocation tables with
a pseudo-random data distribution function (CRUSH)
designed for heterogeneous and dynamic clusters of
unreliable object storage devices (OSDs). In this paper, we
investigate the performance of Ceph on an Open Stack
cloud using well-known benchmarks. Our results show its
good performance and scalability.
Keywords- OpenStack Cloud, Ceph distributed file storage,
benchmarks
I. INTRODUCTION
Ceph, is a scalable, open source, software-defined storage
system that runs on commodity hardware [1-6] [8-9]. Ceph has
been developed from the ground up to deliver object, block,
and file system storage in a single software platform that is
self-managing, self-healing and has no single point of failure.
Because of its highly scalable, software defined storage
architecture, Ceph is an ideal replacement for legacy storage
systems and a powerful storage solution for object and block
storage for cloud computing environments [3].
Some prior works exist on Ceph performance evaluation on
clusters [19], [20].
In this paper, we present a Ceph architecture and map it to
an OpenStack cloud. We study the functionality of Ceph
using benchmarks such as Bonnie ++, DD, Rados Bench, OSD
Tell, IPerf and Netcat with respect to the speed of data being
copied and also the read/write performance of Ceph using
different benchmarks. Our results show the good performance
and scalability of Ceph in terms of increasing clients request
and data sizes.
II. CEPH ARCHITECTURE
We next outline the Ceph storage cluster. The Ceph storage
cluster is made up of several different software daemons. Each
of these daemons takes care of unique Ceph functionalities
and adds values to its corresponding components [5].
Reliable Autonomic Distributed Object Store (RADOS) is
the foundation of the Ceph storage cluster. Everything in Ceph
is stored in the form of objects, and the RADOS object store is
responsible for storing these objects, irrespective of their data
type.
Ceph Daemons: Data gets stored in Ceph Object Storage
Device (OSD) in the form of objects. This is the only
component of a Ceph cluster where actual user data is stored
and the same data is retrieved when a client issues a read
operation.
Ceph monitors (MONs) track the health of the entire cluster
by keeping a map of the cluster state, which includes OSD,
MON, PG, and CRUSH maps. All the cluster nodes report to
monitor nodes and share information about every change in
their state. A monitor maintains a separate map of information
for each component.
Librados library is a convenient way to get access to RADOS
with the support of the PHP, Ruby, Java, Python, C, and C++
programming languages. It provides a native interface to the
Ceph storage cluster, RADOS, and a base for other services
such as RBD, RGW, as well as the POSIX interface for Ceph
file system.
Ceph Block Device, formerly known as RADOS block
device (RBD), provides block storage, which can be mapped,
formatted, and mounted just like any other disk to the server.
A Ceph block device is equipped with enterprise storage
features such as thin provisioning and snapshots.
Ceph Metadata Server (MDS) keeps track of file hierarchy
and stores metadata only for CephFS.
Ceph File System (CephFS) offers a POSIX-compliant,
distributed file system of any size. CephFS relies on Ceph
MDS to keep track of file hierarchy.](https://image.slidesharecdn.com/8ba3a204-b6d9-48cc-a93e-81f39ce8945b-160324223418/75/Ceph-1-2048.jpg)
![The architecture layout which for our Ceph installation has
the following characteristics and is shown in Figure 1.
Operating system: Ubuntu Server
Version: LTS 14.04
Ceph version: 0.87 Giant
OSDs number: 3
MONs number: 3
Clients number : 4
Figure 1 : The ceph architecture
We mapped this Ceph architecture to an OpenStack cloud
system operated by the Open Cloud Institute (OCI) at the
University of Texas at San Antonio. It offers significant
capacity and similar design features found in Cloud
Computing providers, including robust compute capability and
elastic infrastructure design. We used 8 virtual machines.
Each virtual machine has two virtual cpus (VCPUs or cores) ,
and four GB memory. The underlying physical server in the
cloud is a SeaMicro SM15000 system with 64 octal core AMD
Opteron processors with 10Gbps network connectivity. Then
Threads are created each on separate VCPUs. Thus, for
example, 8 threads run on 8 VCPUs and require at least 4
VMs (each one has 2 VCPUs). We ran for 1,4,8 clients by
using 1,4,8 threads.
III. BENCHMARKING
EXPERIMENTS FOR CEPH
Several benchmarks have been proposed for Ceph (e.g. [7] and
refs therein). We ran well-known benchmarks (Bonnie ++,
DD, Rados Bench, OSD Tell, IPERF and Netcat) that measure
the speed of data that is copied and also the read and write
performance of Ceph.
A. Bonnie++
Bonnie++ is an open-source file system
benchmarking tool for Unix OS developed by Russell
Coker [8, 10-13]. Bonnie++ is a benchmark suite that
is aimed at performing a number of simple tests of
hard drive and file system performance. It allows you
to benchmark how your file systems perform with
respect to data read and write speed, the number of
seeks that can be performed per second, and the
number of file metadata operations that can be
performed per second [8].
It is a small utility with the purpose of benchmarking
file system I/O performance. It is used to minimize
the effect of file caching and tests should be
performed on larger data sets than the amount of
RAM we have on the test system [10]. Bonnie++
adds the facility to test more than 2G of storage on a
32bit machine, and tests for file creat(), stat(),
unlink() operations and it will output in CSV spread-
sheet format to standard output [12], [13].
We show the Time (Latency) and bandwidth results
for Bonnie++ in Table 1 and Figures 2-3.
Table 1 : (Bonnie++) Time and bandwidth
Single
thread
4 threads 8 threads
Write Size
(MB)
16 16 16
Time (us) 159 180.5 168
Bandwidth
(K/s)
18541 10111 2670
ADMIN
Monitor Monitor Monitor
OSD OSD OSD
Client1 Client2 Client3 Client4](https://image.slidesharecdn.com/8ba3a204-b6d9-48cc-a93e-81f39ce8945b-160324223418/85/Ceph-2-320.jpg)
![0
2000
4000
6000
8000
10000
12000
14000
16000
18000
20000
Single thread 4 threads 8 threads
Bandwidth (K/s)
Bandwidth (K/s)
Figure 2 : (Bonnie++) Bandwidth
145
150
155
160
165
170
175
180
185
Single thread 4 threads 8 threads
Latency (us)
Figure 3 : (Bonnie++) Time
B. DD (Read and Write)
DD is a benchmark to perform a real-world disk test
on a Linux system. “DD” stands for data description
and it is used for copying data sources. It is the basic
test which is not customizable and shows the
performance of the file system. This is mostly used in
WRITE (copying) into a new file while this is used
for READ speed of a disk by reading the file that is
created [10]. DD helps in testing sequential read and
sequential write. We show DD speed in copying data
from 1-6 clients in Table 2 and Figure 6. We show
DD Read and Write time and bandwidth in Tables 3-
4 and Figures 5-8.
DD 128MB 256MB 512MB
client1 38.5 19.6 14.9
client2 29 24.5 18.4
client3 30.8 18.3 18
client4 41.4 21.2 18.3
client5 33.2 17.4 18.6
client6 30.4 21.9 19.2
Table 2 : (DD) Speed in copying data
Figure 4 : (DD) Average speed in coping data
DD Read Benchmark:
This benchmark shows the DD performance
(time/bandwidth) using read benchmark for 1 ,4 and 8
threads.
Table 3 : (DD read) Time/bandwidth
0
10
20
30
40
50
60
70
Single thread 4 threads 8 threads
Bandwidth (MB/s)
Bandwidth (MB/s)
Figure 5 : (DD Read) Bandwidth
Single thread 4 threads 8 threads
Size(Bytes) 5242880 5242880 5242880
Time (sec) 0.0815217 0.107416 0.11349822
5
Bandwidth
(MB/s)
64.3 50.15 50.725](https://image.slidesharecdn.com/8ba3a204-b6d9-48cc-a93e-81f39ce8945b-160324223418/85/Ceph-3-320.jpg)
![0
0.02
0.04
0.06
0.08
0.1
0.12
Single thread 4 threads 8 threads
Time (sec)
Figure 6 : (DD Read) Time.
DD Write Benchmark:
The write Benchmark shows the DD performance using
1, 4 threads and 8 threads.
Table 4 : (DD Write) Time/bandwidth
0
2
4
6
8
10
12
14
Single thread 4 threads 8 threads
Bandwidth (MB/s)
Bandwidth (MB/s)
Figure 7 : (DD Write) Bandwidth
Figure 8 : (DD Write) Bandwidth
C. RADOS Bench (Read/Write)
RADOS is an inbuilt benchmark known as native
benchmark, where RADOS is a utility for interacting
with Ceph object storage cluster which provides the
read and write sequential and random results [9]. We
show Read and Write time and bandwidth in Tables
5-6 and Figures 9-11, 13-15. We also show the total
number of Reads (Writes ) per thread in Figure 12 (
Figure 16).
RADOS Bench (Read):
We show the performance of RADOS Bench Read for 1,
4 and 8 threads. It shows the bandwidth, total time run,
read size, Average and Maximum Latency with respect to
threads [16].
Single
thread
4 threads 8 threads
Time
(sec)
30.627255 31.879181
5
33.508639
8
Total
reads
926 290.25 150.875
Read size 4194304 4194304 4194304
Bandwid
th
(MB/sec)
120.938 36.41875 18.010875
Average
Latency
(sec)
0.527604 1.75118 3.52563
Max
latency
(sec)
1.20062 4.81599 11.161637
5
Table 5: (RADOS Bench Read) Time/bandwidth
Single thread 4 threads 8 threads
Size(Bytes) 5242880 5242880 5242880
Time (sec) 0.42957 1.533755 1.91441
Bandwidth
(MB/s)
12.2 3.425 2.75](https://image.slidesharecdn.com/8ba3a204-b6d9-48cc-a93e-81f39ce8945b-160324223418/85/Ceph-4-320.jpg)
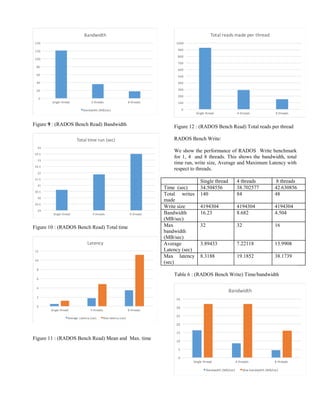
![Figure 13 : (RADOS Bench Write) Bandwidth
0
5
10
15
20
25
30
35
40
45
Single thread 4 threads 8 threads
Total time run (sec)
Figure 14 : (RADOS Bench Write) Time
0
5
10
15
20
25
30
35
40
45
Single thread 4 threads 8 threads
Latency
Average Latency (sec) Max latency (sec)
Figure 15: (RADOS Bench Write) Average and maximum
time
0
20
40
60
80
100
120
140
160
Single thread 4 threads 8 threads
Total writes made
Figure 16 : (RADOS Write) Total writes
D. OSD Tell benchmark:
OSD Tell is the native Ceph benchmark, which checks the
functioning of the OSDs with respect to the server [3].
We show the bandwidth between the OSD and the server in
Table 7 and Figure 17.
Single thread 4 threads 8 threads
Write Size
(MB)
1000 1000 1000
blocksize(M
B)
1 1 1
Bandwidth
(Byte/s)
828 832.75 828.25
Table 7: (OSD Tell) Bandwidth between OSD and Server
825
826
827
828
829
830
831
832
833
834
Single thread 4 threads 8 threads
Bandwidth (Byte/s)
Bandwidth (Byte/s)
Figure 17: (OSD Tell) Bandwidth between OSD and
Server
E. Iperf Benchmark:
Iperf is a commonly used network testing tool that can create
data streams for Transmission Control Protocol (TCP) and
User Datagram Protocol (UDP) and measure the Connection
Speed ( i.e. Throughput) of the network [15], [17]. We show
the bandwidth between the OSD and client in Table 8 and
Figure 18.](https://image.slidesharecdn.com/8ba3a204-b6d9-48cc-a93e-81f39ce8945b-160324223418/85/Ceph-6-320.jpg)
![Table :8 Iperf Bandwidth
928 930 932 934 936 938 940 942
OSD1 (Mb/s)
OSD2 (Mb/s)
OSD3 (Mb/s)
IperfOSD-Client Connection Speed Benchmark
Client4 Client3 Client2 Client1
Figure 18: (Iperf) Bandwidth
F. Netcat Benchmark:
Netcat (also known as NC) is a computer networking service
for reading from and writing to network connections using
TCP or UDP. This is also a connectivity benchmark [14]. We
show the bandwidth between the OSD and client in Table 9
and Figure 19.
Table:9 Netcat Bandwidth
0 10 20 30 40 50 60 70 80 90 100
OSD1 (KB/s)
OSD2 (KB/s)
OSD3 (KB/s)
NetcatOSD-Client Connection Speed Benchmark
Client4 Client3 Client2 Client1
Figure 19: (Netcat) Bandwidth between OSD and Client
IV. CEPH INSTALLATION ON
OPENSTACK CLOUD
Ceph installation is clearly described in [18]. Here we
summarize the installation steps.
Step 1. Preparation.
Use the latest version of Ceph and also check for the
appropriate Release key and install Ceph on the Admin Node
Authenticate SSH key password less authentication and check
for the access for all the nodes in the ceph cluster from the
admin node.
Step 2. Storage Cluster.
Creating and initialize the cluster. First install ceph from
admin node to each and every other nodes in the cluster.
Initialize and create monitor nodes. Then push admin node
configuration file to other nodes.
Finally prepare and active the designated osd nodes.
Check for the Ceph Health which states Ceph is ready to use .
Step 3. Ceph Clients.
Install ceph from admin node to designated client nodes.
Using RBD command to create an image of block device and
map it appropriate block device.
Create and initialize file system for the block device, after
mounting it to Client’s directory.
Ceph is ready to use with Clients.
V. CONCLUSIONS AND FUTURE
WORK
Ceph, a distributed file system that provides excellent
performance, reliability, and scalability. In this paper, we have
outlined the functionality of Ceph and we installed it on an
OpenStack cloud. We ran well-known benchmarks (Bonnie
++, DD, Rados Bench, OSD Tell, IPERF and Netcat) that
measure the speed of data that is copied and also the read and
write performance of Ceph. The results show that the
performance decreases very slowly as a function of the
number of clients requests. This demonstrates the good
Client1 Client2 Client3 Client4
OSD1
(KB/s)
87 62.2 60.3 54.3
OSD2
(KB/s)
38.8 17.4 41.7 68
OSD3
(KB/s)
43.4 15.3 38.3 25.4
Client1 Client2 Client3 Client4
OSD1
(Mb/s)
940 935 932 939
OSD2
(Mb/s)
935 940 940 936
OSD3
(Mb/s)
937 939 938 940](https://image.slidesharecdn.com/8ba3a204-b6d9-48cc-a93e-81f39ce8945b-160324223418/85/Ceph-7-320.jpg)
![performance and (small-scale) scalability of Ceph in the
OpenStack cloud.
In future work, we plan to run large-scale experiments to show
the scalability of Ceph in a large-scale OpenStack cloud. We
also plan to test the reliability of Ceph in the presence of
faults.
VI. REFERENCES
[1] Weil, Sage A., Scott A. Brandt, Ethan L. Miller, Darrell
DE Long, and Carlos Maltzahn. "Ceph: A scalable, high-
performance distributed file system." In Proceedings of the 7th
symposium on Operating systems design and implementation,
pp. 307-320. USENIX Association, 2006.
[2] Weil, Sage A., Scott A. Brandt, Ethan L. Miller, and
Carlos Maltzahn. "CRUSH: Controlled, scalable, decentralized
placement of replicated data." In Proceedings of the 2006
ACM/IEEE conference on Supercomputing, p. 122. ACM,
2006.
[3] Maltzahn, Carlos, Esteban Molina-Estolano, Amandeep
Khurana, Alex J. Nelson, Scott A. Brandt, and Sage Weil.
"Ceph as a scalable alternative to the Hadoop Distributed File
System." login: The USENIX Magazine 35 (2010): 38-49
[4] Ceph Storage, Red Hat, 2015 [Online] Available:
http://ceph.com/
[5] Ceph Documentation [Online] Available:
http://ceph.com/docs/master/
[6]Ceph Benchmarks, Sebastien Han, [Online] Available:
http://www.sebastien-han.fr/blog/2012/08/26/ceph
benchmarks/
[7]
[8]
[9] Benchmark Disk IO with DD and Bonnie++, James Cole,
[Online] Available: http://www.jamescoyle.net/how-to/599-
benchmark-disk-io-with-dd-and-bonnie
[10]Wikipedia Bonnie++ [Online] Available:
http://en.wikipedia.org/wiki/Bonnie++
[11] Russel Coker, Webpage [Online] Available:
http://www.coker.com.au/bonnie++/
[12]Active Benchmarking [Online] Available:
http://www.brendangregg.com/ActiveBenchmarking/bonnie++
.html
[13] Wikipedia Netcat [Online] Available:
http://en.wikipedia.org/wiki/Netcat
[14] Wikipedia iperf [Online] Available:
https://en.wikipedia.org/wiki/Iperf
[15]https://wiki.ceph.com/Guides/How_To/Benchmark_Ceph
_Cluster_Performance
[16] https://en.wikipedia.org/wiki/Iperf
[17]Singh, Karan. Learning Ceph. Packt Publishing Ltd, 2015.
[18] Wang, Feiyi, Mark Nelson, Sarp Oral, Scott Atchley,
Sage Weil, Bradley W. Settlemyer, Blake Caldwell, and Jason
Hill. "Performance and scalability evaluation of the Ceph
parallel file system." In Proceedings of the 8th Parallel Data
Storage Workshop, pp. 14-19. ACM, 2013.
[19] Gudu, Diana, Marcus Hardt, and Achim Streit.
"Evaluating the performance and scalability of the Ceph
distributed storage system." In Big Data (Big Data), 2014
IEEE International Conference on, pp. 177-182. IEEE, 2014.](https://image.slidesharecdn.com/8ba3a204-b6d9-48cc-a93e-81f39ce8945b-160324223418/85/Ceph-8-320.jpg)