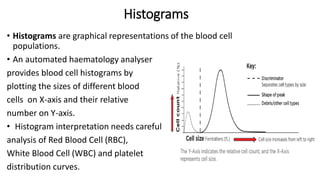
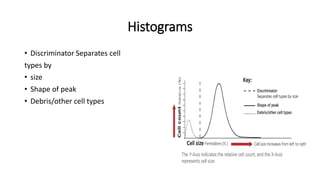
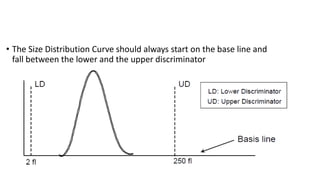
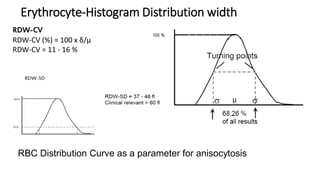
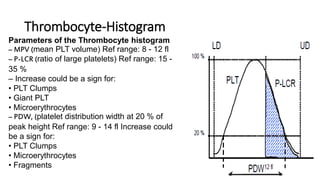
1) Histograms provide graphical representations of blood cell populations by plotting cell size on the x-axis and relative number on y-axis.
2) Careful analysis of red blood cell, white blood cell, and platelet distribution curves from automated hematology analyzers is needed to interpret histograms.
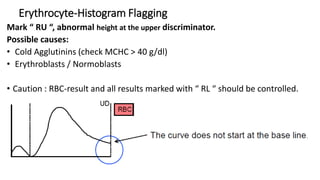
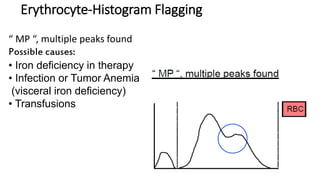
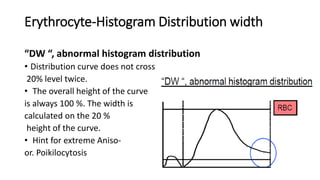
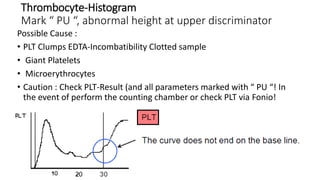
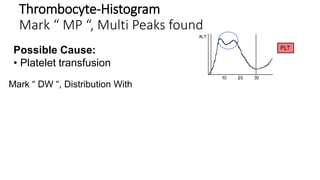
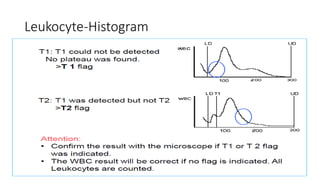
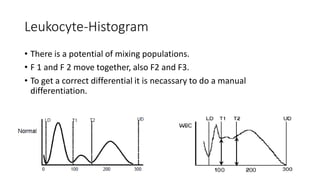
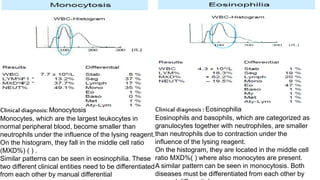
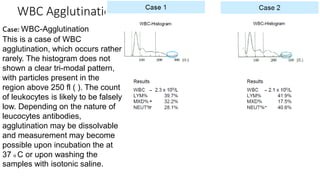
3) Histograms can help verify differential cell counts, serve as quality control checks, and identify uncommon diseases by flagging abnormalities in cell distribution width, shape of peaks, and presence of extra peaks.