Downloaded 176 times

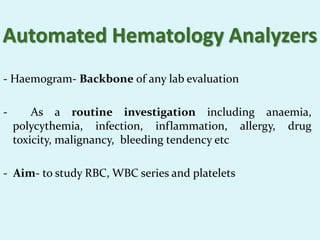

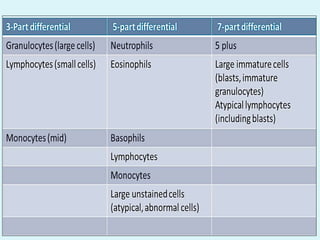
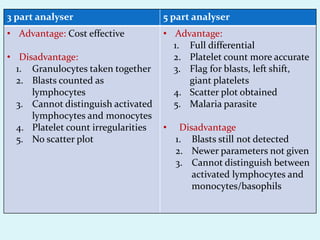
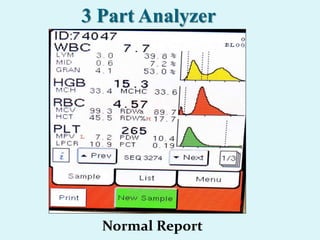
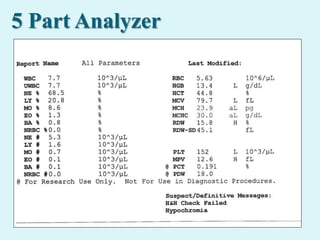
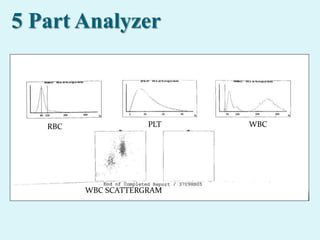
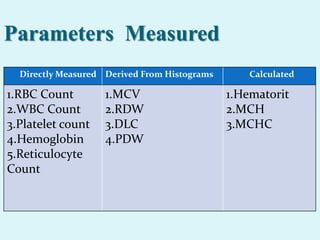


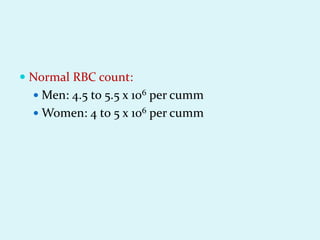
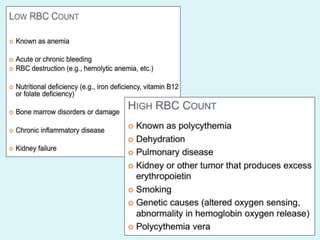
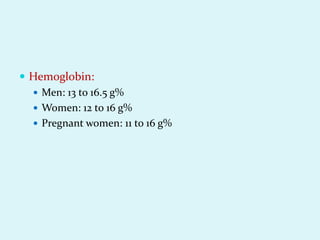
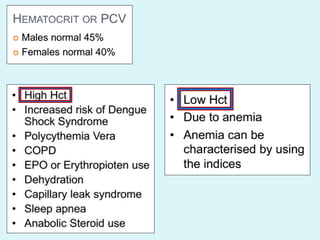

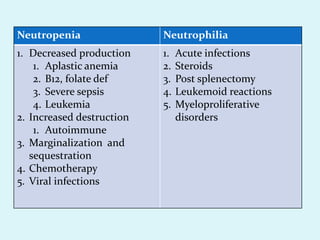
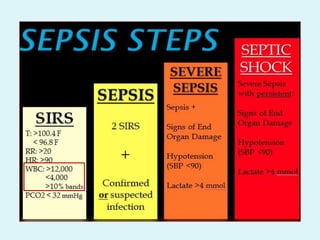
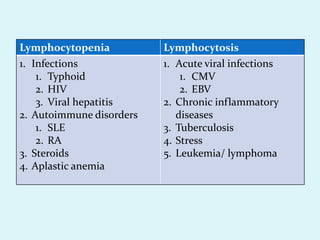

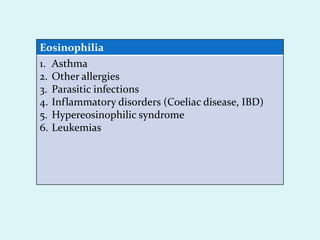
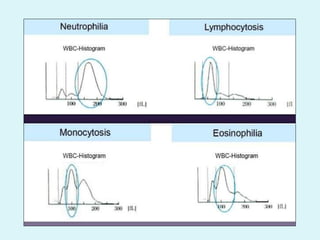
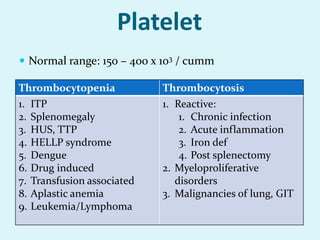
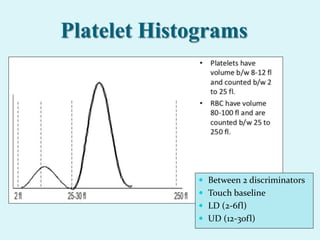
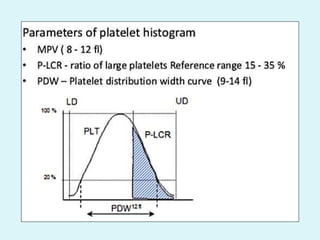
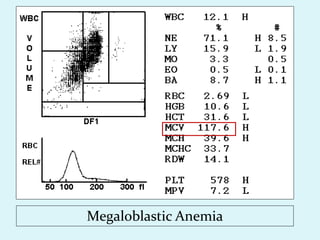
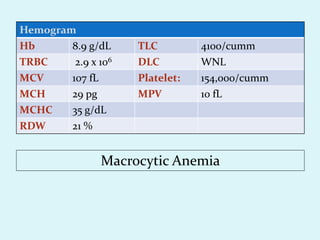
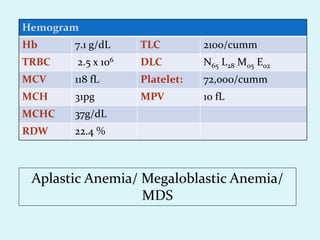
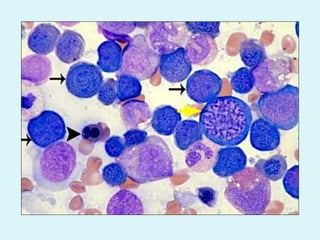

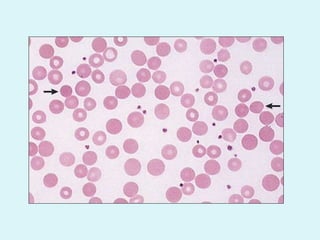
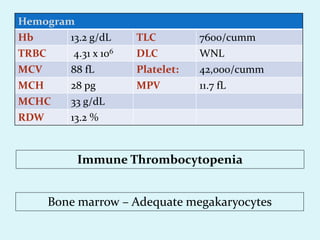
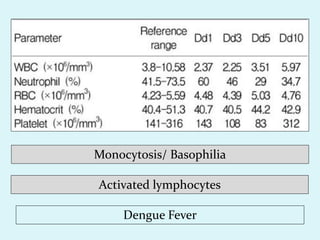
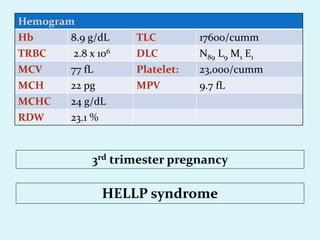
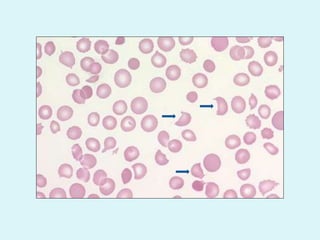
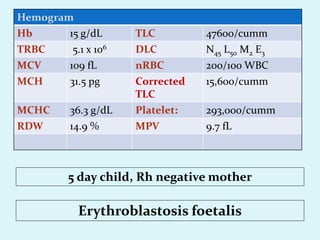
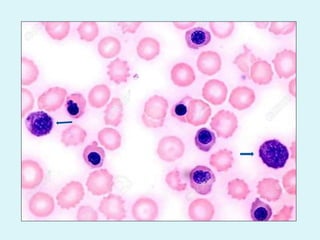
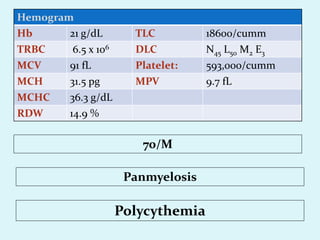


This document discusses automated hematology analyzers and their use in analyzing complete blood counts. It describes 3-part analyzers, which provide white blood cell and platelet counts but have limitations, and 5-part analyzers, which provide more detailed analysis including a scatter plot. The document outlines the parameters measured by analyzers and how to interpret results, including normal ranges for red blood cell, white blood cell, and platelet counts and indices. Various abnormal findings are presented as case examples.


![CASE_PRESENTATION_ON_subdural_hematoma(SDH)[1 FINAL PPT]-1.pptx](https://cdn.slidesharecdn.com/ss_thumbnails/casepresentationonsubduralhematomasdh1finalppt-1-260129172522-d405d375-thumbnail.jpg?width=640&height=640&fit=bounds)