Download to read offline


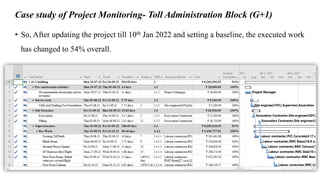
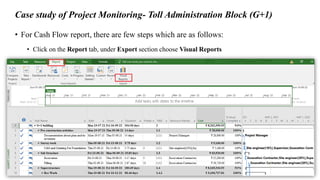
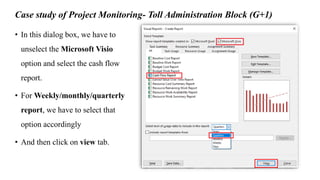
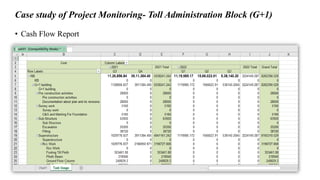
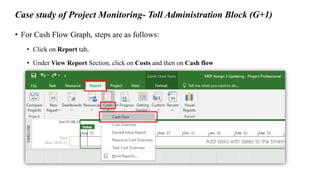
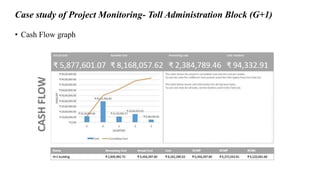


The document discusses a cash flow report generated in MS Project for a toll administration block construction project. It defines what a cash flow report is, explaining that it shows how a company spends its money over time. The document then discusses why cash flow reports are important for informing readers about a project's cash position and finances. It provides steps to generate a cash flow report and graph in MS Project for a case study project that is 54% complete. The conclusion emphasizes that cash flow reports provide useful information about project spending and future funding needs.


