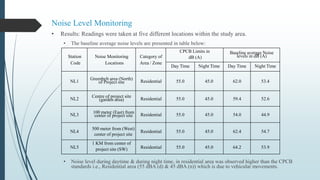
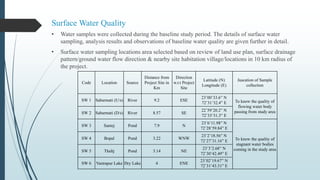
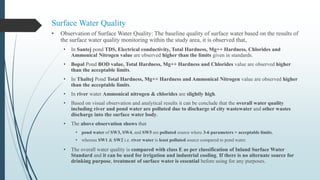
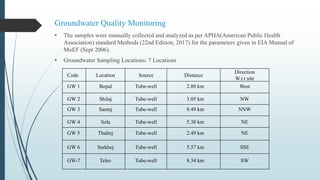
This ppt is based on an EIA report for
The Building & Construction Project “Parshwa Luxuria” at S. P. No. 133/1/A, R. S. No. 118/2/1, 118/2/2, 118/3, 118/4 & 119, Bodakdev, City West, District Ahmedabad, Gujarat. JANUARY 2019
1. EIA Report for
The Building & Construction Project “Parshwa Luxuria” at S. P. No.
133/1/A, R. S. No. 118/2/1, 118/2/2, 118/3, 118/4 & 119, Bodakdev,
City West, District Ahmedabad, Gujarat. JANUARY 2019
Submitted By
Kundan S. Sanap- 202030016
Akshay P. Jadhav- 202030017
Veermata Jijabai Technological Institute,
Matunga
2. Table of Content
• Purpose of the study
• Project Description
• Environmental Baseline
• Land use and Land Cover
• Air Environment
• Noise Environment
• Surface Water Environment
• Groundwater Environment
• Soil
• Ecology & Biodiversity environment
• Socio-economic environment
• Potential Environmental Impacts & Mitigation Measures
• Environmental Monitoring Programme
• Project Benefits
• Conclusion
3. Purpose of the study
• The purpose of the EIA study is
1. To identify existing environmental condition
2. To predict environmental impacts associated with the proposed project
3. To suggest measures to mitigate the adverse impacts and to delineate a comprehensive
environment management plan along with recommendations and suggestions.
4. The different activities that are likely to take place have been identified and mitigation measures
have been proposed
4. Project Description
• Type of project: - The project falls under Category B of item 8(a) of Schedule of the EIA
Notification 2006 amended till now as Building and Construction projects require prior EC from
the SEIAA, Gujarat.
• Nature: - Building and Construction project (Residential Building)
• Cost of project: - The total Project cost is ~ INR 105 Crore from which the Land cost is ~ INR 35
Crore and the construction cost is ~ INR 70 Crore.
• Connectivity to project site
• By Road: -
• The project site is located on Iscon-Ambli road, Bodakdev, City West, Ahmedabad. Ambli road is ~
0.4 km in S direction & Sindhu bhavan road is ~1.0 km in N direction from the project site. Sardar
Patel Ring Road is ~ 1.2 km in W direction & SG Highway is ~ 1.9 km in E direction from the project
site.
• By Rail: -
• The nearest railway station is Ambli road railway station ~ 2.40 km in NNE direction &
Ahmedabad Central railway station is ~ 11.46 km in ESE direction from the project site
• By Air: -
• Sardar Vallabhbhai Patel International Airport is ~ 14.0 km in ENE direction from the project site
6. Project Description
• Location-
• The project site is located at F. P. No.: 133/1/A, R. S. No.: 118/2/1, 118/2/2, 118/3, 118/4 & 119,
Bodakdev, City West, District Ahmedabad.
9. Project Description
• Size or Magnitude of Operation: -
• The project have
• total plot area of 6582.76 m2
• Built-up area of 35,734.41 m2.
• The project consists of two building blocks of 48 residential units each.
• Green Belt: -
• Total area for greenbelt development = 660.78 m2 (i.e. >10% of total plot area)
• Area provided for tree plantation = 150 m2 (100 number of trees)
• Area provided for small shrubs & lawns = 510.78 m2
10. Environmental Baseline
• The baseline environmental quality was assessed through field studies within the impact zone for
various components of the environment with specific reference to environmental aspects, which
may have a bearing on the impacts of the proposed project. The components are listed below:
• Land use and Land Cover
• Air Environment
• Noise Environment
• Surface Water Environment
• Groundwater Environment
• Soil
• Socio-economic environment
• Ecology & Biodiversity environment.
11. Land use and Land Cover Pattern of Study Area
• Built-up Land or Habitation: -
• Residential/Commercial:
• This is the major class in the study area covering ~ 30 % of total study area. Major city is
Ahmedabad. Santej, Bopal, Shela, Sola, etc. are upcoming fast growing rural to urban areas.
• Industrial Area:
• This class covers ~ 2.5 % of total study. Industrial areas are located at Village Rakanpur,
Santej and along NH-8C near areas Santipura, Chandlodiya, Gota etc.
• Agricultural Land: -
• Crop Land:
• Agricultural land covers ~ 26 % of study area. Agriculture crops such as rice, jowar, wheat,
fodder, castor etc. is cultivated in study area.
• Plantation:
• Eucalyptus plantations were seen near Bhadaj and Telav.
• Vegetation Cover: -
• The study area has ~30 % of vegetation cover. Dominant vegetation is prosopis.
• Wasteland: -
• The study area has ~11 % of total area under wastelands which is mainly land without scrub.
12. Land use and Land Cover Pattern of Study Area
• Water bodies:
• It is observed that ponds are present mostly in all the villages and places within the study
area.
• River Sabarmati is the major one flowing from ENE to SSE direction in the study area,
• however, Chandrabhaga Nadi forming the minor one in the study area.
• Others:
• Few patches of grassland are present in Sabarmati riverbed.
13. Ambient Air Quality
• Ambient Air Monitoring was conducted at Six (6) different locations within the study area.
• The frequency of monitoring was 24 hours twice a week at each station spread over one month
with gaseous sample being changed two times (at 8 hour intervals).
• The parameters monitored were Particulate matter (PM10, PM2.5), Sulphur Dioxide (SO2),
Oxides of Nitrogen (NOx), Carbon Monoxide (CO) and Hydrocarbon-HC (as Methane)
• Selected Six Location:
Code Location Coordinates
Distance from
Site (Km)
Direction from
site
Justification
AAQ01 At project Site
23°01'56.08"N
72°29'20.94"E 0 Base
Selected as base
station
AAQ02
Anand Nagar,
off SG Highway
23°00'57.23"N
72°30'33.63"E
2.73 SE
1st predominant
downwind station
AAQ03 Shilaj Village
23°3'17.38"N
72°28'10.08"E 3.23 NW
1st predominant
upwind station
AAQ04 Bopal Village
23°2'1.84"N
72°27'28.18"E 3.23 W
2nd predominant
upwind station
AAQ05
Akar Society,
Vastrapur
23°1'48.16"N
72°31'32.58"E 3.74 E
2nd predominant
downwind station
AAQ06 Santej Village
23°6'3.59"N
72°29'2.71"E 7.65 N Crosswind station
14. Ambient Air Quality
• Ambient Air Quality Results:
• The comparison of the results with the value range indicators NAAQ standards 2009
provided by CPCB(Central Pollution Control Board) for Industrial, residential, rural &
other area indicates:
• At various locations, average concentration of PM10 was observed to be varying from 101 to
166 µg/m3 . Average concentration of PM10 levels are exceeding the permissible limits at all
locations(100 µg/m3). The reason for higher PM10 concentration would be vehicular
emissions and traffic congestion in the urban areas while fuel wood or biomass burning
for cooking in rural areas.
• Average concentration of PM2.5 levels was observed to be in range of 30 to 50 µg/m3 which
is less than the permissible limits(60 µg/m3) for all locations.
• Average concentration of SO2 levels was observed to be in the range of 12.5 to 17.0 µg/m3
which is within the specified limit(80 µg/m3) of CPCB.
• NOx levels were observed to be in the range of 17.1 to 19.2 µg/m3 which is within the
specified limit(80 µg/m3) of CPCB.
• CO levels were observed in the range of 1.223 to 1.523 mg/m3 which is within the specified
limit(4 mg/m3) of CPCB.
15. Noise Level Monitoring
• Monitoring of noise is done by identifying suitable number of noise quality monitoring locations.
• Sampling Location Details: 5 Locations Selected
Station
Code
Noise Monitoring
Locations
Category of
Area / Zone
Coordinates
Distance between Nearest
Boundaries w.r.t. Project
Site in Km
Direction w.r.t.
Project Site
NL1
Greenbelt area (North)
of Project site
Residential
23⁰01'57.0"N
72⁰29'21.1"E
0.0 Base Station
NL2 Centre of project site Residential
23⁰01'55.0"N
72⁰29'21.3"E
0.0 Base Station
NL3
100 meter (East) from
center of project site Residential
23° 1'57.30"N
72°29'31.51"E 0.1 East
NL4
500 meter from (West)
center of project site
Residential
23⁰01'50.2"N
72⁰28'58.1"E 0.5 West
NL5
1 KM from center of
project site (SW)
Residential
23° 1'20.11"N
72°29'26.82"E
1.0 South West
16. Noise Level Monitoring
• Results: Readings were taken at five different locations within the study area.
• The baseline average noise levels are presented in table below:
• Noise level during daytime & during night time, in residential area was observed higher than the CPCB
standards i.e., Residential area (55 dBA (d) & 45 dBA (n)) which is due to vehicular movements.
Station
Code
Noise Monitoring
Locations
Category of
Area / Zone
CPCB Limits in
dB (A)
Baseline average Noise
levels in dB (A)
Day Time Night Time Day Time Night Time
NL1
Greenbelt area (North)
of Project site Residential 55.0 45.0 62.0 53.4
NL2
Centre of project site
(garden area) Residential 55.0 45.0 59.4 52.6
NL3
100 meter (East) from
center of project site Residential 55.0 45.0 54.0 44.9
NL4
500 meter from (West)
center of project site
Residential 55.0 45.0 62.4 54.7
NL5
1 KM from center of
project site (SW) Residential 55.0 45.0 64.2 53.9
17. Surface Water Quality
• Water samples were collected during the baseline study period. The details of surface water
sampling, analysis results and observations of baseline water quality are given further in detail.
• Surface water sampling locations area selected based on review of land use plan, surface drainage
pattern/ground water flow direction & nearby site habitation village/locations in 10 km radius of
the project.
Code Location Source
Distance from
Project Site in
Km
Direction
w.r.t Project
Site
Latitude (N)
Longitude (E)
Juscation of Sample
collection
SW 1 Sabarmati (U/s) River 9.2 ESE
23˚00’33.6” N
72˚31’32.4” E To know the quality of
flowing water body
passing from study area
SW 2 Sabarmati (D/s) River 8.57 SE
22˚59’20.2” N
72˚33’31.3” E
SW 3 Santej Pond 7.9 N
23˚6’11.98” N
72˚28’59.84” E
To know the quality of
stagnant water bodies
coming in the study area
SW 4 Bopal Pond 3.22 WNW
23˚2’18.56” N
72˚27’31.16” E
SW 5 Thaltj Pond 3.14 NE
23˚3’2.68” N
72˚30’42.49” E
SW 6 Vastrapur Lake Dry Lake 4 ENE
23˚02’19.67” N
72˚31’43.31” E
18. Surface Water Quality
• Observation of Surface Water Quality: The baseline quality of surface water based on the results of
the surface water quality monitoring within the study area, it is observed that,
• In Santej pond TDS, Electrical conductivity, Total Hardness, Mg++ Hardness, Chlorides and
Ammonical Nitrogen value are observed higher than the limits given in standards.
• Bopal Pond BOD value, Total Hardness, Mg++ Hardness and Chlorides value are observed higher
than the acceptable limits.
• In Thaltej Pond Total Hardness, Mg++ Hardness and Ammonical Nitrogen value are observed higher
than the acceptable limits.
• In river water Ammonical nitrogen & chlorides are slightly high.
• Based on visual observation and analytical results it can be conclude that the overall water quality
including river and pond water are polluted due to discharge of city wastewater and other wastes
discharge into the surface water body.
• The above observation shows that
• pond water of SW3, SW4, and SW5 are polluted source where 3-6 parameters > acceptable limits,
• whereas SW1 & SW2 i.e. river water is least polluted source compared to pond water.
• The overall water quality is compared with class E as per classification of Inland Surface Water
Standard and it can be used for irrigation and industrial cooling. If there is no alternate source for
drinking purpose, treatment of surface water is essential before using for any purposes.
19. Groundwater Quality Monitoring
• The samples were manually collected and analyzed as per APHA(American Public Health
Association) standard Methods (22nd Edition, 2017) for the parameters given in EIA Manual of
MoEF (Sept 2006).
• Groundwater Sampling Locations: 7 Locations
Code Location Source Distance
Direction
W.r.t site
GW 1 Bopal Tube-well 2.80 km West
GW 2 Shilaj Tube-well 3.05 km NW
GW 3 Santej Tube-well 8.49 km NNW
GW 4 Sola Tube-well 5.38 km NE
GW 5 Thaltej Tube-well 2.49 km NE
GW 6 Sarkhej Tube-well 5.57 km SSE
GW-7 Telav Tube-well 8.34 km SW
20. Groundwater Quality Monitoring
• Observation of Groundwater Quality: The baseline quality of groundwater based on the results of
the Groundwater quality monitoring within the study area, it is observed that,
• TDS is found exceeding the permissible limit more than 2000 mg/lit at Sarkhej (GW-06)
and Telav (GW-07), while the range is between 1198 mg/lit (GW-04: Sola) to 1612 mg/lit
(GW-01: Bopal).
• Chlorides is found near to permissible limit(1000mg/lit) ~ 955 mg/lit at Telav (GW-07).
• Sulphates is exceeding permissible limit more than 400 mg/lit at Sarkhej (GW-06) and
Telav (GW-07).
• Magnesium is also exceeding permissible limit higher than 100 mg/lit at Telav (GW-07).
• Iron content are found higher than desirable limit(0.3 mg/lit) at all locations.
21. Soil Quality & Characteristics
• A field visit conducted to study site-specific soil quality and condition includes soil texture
mineralogical content, plasticity & possible impact to the environmental setting due to project.
• Soil Sampling: Randomly selected locations
• The soil samples from 0-15 cm depth were collected by using spade and pawada.
• samples were homogenized and about 1 Kg soil sample was collected in the polyethylene bag, labelled
with sample ID & were brought to the laboratory for analysis of physical and chemical properties
Sr. No. Sampling Location Soil texture Lat. & Long.
From the project site
Dir. Dist.
ST01 Bopal village Sandy loam
23° 1'55.31"N
72°27'52.83"E
W 2.4
ST02 Shilaj village Sandy loam
23˚03'18.0"N
72˚28'21.3"E
NW 3.2
ST03 Santej village Loam
23˚06'24.9" N
72˚28'13.7" E
NNW 8.4
ST04 Sola village Sandy loam
23˚04'05.5" N
72˚31'27.1" E
NE 5.3
ST05 Thaltej village Sandy loam
23˚03'26.4" N
72˚30'15.49" E
NNE 3.1
ST06 Bodkdev (At site) Loamy sand
23° 1'55.50"N
72°29'20.84"E
- 0
ST07 Sarkhej village Sandy clay loam
22˚58'54.54" N
72˚30'11.32" E
SE 5.7
ST08 Telav village Sandy loam
22˚59'54.28" N
72˚26'28.56" E
SW 6.1
22. Soil Quality & Characteristics
• Soil Quality Results:
• The analysis of physicochemical properties of soil samples collected from surrounding area
indicated that,
• Porosity ranged from 35 –56 % and WHC (Water Holding Capacity) varied from 43.17 – 62.4 %, while
permeability ranged from 17.7 – 62.4 mm/hr. The high permeability was on account of sandy to sandy
clay loam texture of soils.
• The EC(Electrical Conductivity) ranged from 0.641 to 1.105 dS/m indicating that soils are normal
(EC<1.0 dS/m) to saline (>EC<1.0 dS/m) and ESP(Exchangeable Sodium) (0.37 to 3.52) was well within
the safe limit of <15.
• The pH ranged from 7.13 – 7.36, indicating that soils are normal (pH = 6.5 to 7.8).
• Among water soluble cations predominance of Na (0.58 to 1.78 g/kg) was seen followed by Ca (0.37 to
1.25 g/kg), Mg (0.01 to 0.45 g/kg) and K (0.16 to 0.42 g/kg).
23. Ecology and Biodiversity
• This section represents existing biodiversity status of the project site (core zone) and its
surrounding environment of the project study area (buffer zone of 10 km radius).
• Field Data Collection & Observation: -
• After the plot survey it is found that, there is lot of diversity when it comes to the flora and fauna in and
around the study area.
• no rare and endangered flora was observed.
• Among floral species, none of the species can be designated as threatened species. For the recorded
faunal species, none of the species can be designated as an endemic.
24. Socio-Economics
• This section analyses the existing socio-economic conditions of the habitations as well
as community residing in the project area.
• It also identifies the potential issues and problems in the area. For the design of project,
stakeholder views were taken through the structured questionnaires and focus group
discussions.
25. Potential Environmental Impacts & Mitigation Measures
• Environmental impacts have been identified based on an assessment of environmental aspects
associated with the project. So, both positive and negative impacts are mentioned below along with
the impacting activities:
• Land use/Land cover:
• Impacts
• Land procurement and site preparation.
• Generation of earth/debris and change in topography of the site due to cutting & filling.
• Betterment of overall land cover characteristics both aesthetically as well as ecologically
• Mitigation measures
• Establish and clearly document land usage permission.
• Clearance of vegetation limited to project footprint.
• Landscape development within site.
• Use of excavated earth for backfilling.
• Storage of top soil separately and its reuse for greenbelt within the site.
26. Potential Environmental Impacts & Mitigation Measures
• Air quality:
• Impacts
• SPM generation and emission of HC & CO due to Vehicle movement during site preparation
• Dust generation during construction activities and restoration
• Emission of SPM, SO2, NOx, HC & CO due to operation of DG sets.
• Mitigation measures
• PUC (Pollution Under Control) certified all cars /vehicles shall be allowed to enter.
• Vehicular emission can be mitigated by strictly following traffic management plan at site. Also by
maintaining the roads and by controlling speed limit.
• Dust and air emission can be controlled by development of greenbelt / green cover.
• Periodic air quality monitoring will be carried out at project site and other location within study
area.
• Sprinkling of water can be carried out for dust suppression.
• Adequate stack height of 2.0 m will be provided for emission from DG
27. Potential Environmental Impacts & Mitigation Measures
• Noise:
• Impacts
• Noise due to Vehicle movement during site preparation and occupants
• Noise during operation of construction equipment / machineries.
• Mitigation measures
• Use of well-maintained equipment, machinery and vehicles to avoid generation of high noise.
• Provision of personnel protective equipment (PPEs) like ear plugs/muffs for all the workers at site and
ensuring that the same wore by everybody during construction work.
• Noise to be monitored in ambient air within the premises.
28. Potential Environmental Impacts & Mitigation Measures
• Surface Water:
• Impacts
• Water resources depletion due to water consumption due to domestic use
• surface water contamination due to generation, handling & disposal of wastewater.
• Mitigation measures
• Separate drainage will be proposed for storm water and for sewage to avoid run off contamination as
well as any contamination of surface water sources.
• Care shall be taken to reduce water consumption by providing water conservation measures.
• Drip irrigation system will be proposed to reduce fresh water demand for gardening.
29. Potential Environmental Impacts & Mitigation Measures
• Ground water:
• Impacts
• Ground water contamination due to storage, handling & disposal of wastewater.
• Mitigation Measures
• The ground water occurs under confined conditions under the alternate layers of clay and
sand in study area, the proper zone of formation need to be recharge.
• For which, 02 recharge wells are installed. It is further assumed that, this recharge-well will
improve the present ground water conditions.
• Rainwater harvesting to recharge the ground water has been proposed at site.
• Such activity will reflect in improvement of ground water conditions and sustainability of
recharge structure.
30. Potential Environmental Impacts & Mitigation Measures
• Soil:
• Impacts
• Soil erosion due to Clearance of vegetation during site preparation,
• Loss in soil fertility due to levelling and Changes in natural topography due to excavation
• Soil Contamination due to storage and handling of solid waste.
• Control over soil erosion due to green belt.
• spillage of solid waste may deteriorate soil quality
• Mitigation Measures
• Spillage of construction materials was avoided to prevent soil contamination and
deterioration on soil quality.
• Spillage of oil, diesel etc. was minimized to avoid soil contamination.
• During excavation, top soil was reused in a stretch of 150 m long & 1.5 m wide along 18 m wide
road on north side of the project site.
31. Potential Environmental Impacts & Mitigation Measures
• Socio – Economic:
• Impacts
• Positive impact due to creation of jobs and increase in indirect income.
• Mitigation Measures
• The project will provide short term employment opportunities to the local people.
32. Potential Environmental Impacts & Mitigation Measures
• Ecology and Biodiversity:
• Impacts
• Negative impacts due to clearance of vegetation during site preparation
• barrier to faunal movement due to construction of building structure
• impact on flora & fauna due to vehicle movements
• disturbance to nocturnal fauna & flying patterns of birds due to artificial illumination of project
• positive impact plantation during landscaping & greenbelt development.
• Mitigation Measures
• Maximum trees will be included in the green belt area which will support existing faunal
biodiversity.
• Artificial illumination will be kept in suitable direction and light will be switched off in less time
duration at night.
• For the impact on flora & fauna, No immediate action required because all local species from
project site would be common as reported from nearby environment and well adapted to the
routine urban activities, so they would not face significant impact on their normal movements.
33. Potential Environmental Impacts & Mitigation Measures
• Occupational health, Community Health and Safety:
• Impacts
• Health & safety risk/hazard to workers due to various construction activities
• Beneficiary effect on occupational health due to landscaping & Greenbelt development.
• Mitigation Measures
• Workers were given all the safety items such as safety helmets, safety belts, jackets, etc. to be safe
from any kind of injuries while doing construction activities.
34. Environmental Monitoring Programme
• The regular monitoring of environmental parameters is of immense importance to assess the status
of environment during project operation.
• With the knowledge of baseline conditions, the monitoring program will serve as an indicator for
any deterioration in environmental conditions due to operation of the project, to enable taking up
suitable mitigation measures in time to safeguard the environment.
• Environmental Monitoring Plan;
• Air Environment-
• Once in every six months
• At main Gate- Readings to be taken for Ambient air quality monitoring for PM10, PM2.5,
SO2, NOx in ambient and within project premises & comparing them to Permissible values.
• At DG Set- Stack air monitoring for SPM, SO2, NOx, HC & CO in stack of DG set &
comparing them to Permissible values
35. Environmental Monitoring Programme
• Noise Environment-
• Once in every six months
• At Project site(Various Locations)- Ambient Noise level during day and night time & comparing
them to Permissible values
• Water Environment-
• Once in every six months
• At Project site- One ground water sample of recharge well (Essential parameters as per IS:
10500:1991) & comparing them to Permissible values.
• Solid & Hazardous Waste-
• Once in every week
• At Project site- Solid waste (MSW) Generation, handling, storage and disposal & record
review for random checks for site in-charge.
36. Project Benefits
• During construction phase direct employment opportunity was created for contractor, laborers
and workers, indirect employments in transportation and construction allied sectors
• During operation phase, long-term job opportunities will be created in terms of security,
housekeeping and gardening personnel which will lead to increase their living standard.
• Exposure of modernized infrastructural & technological facilities due to proposed project
activities will helpful to boost knowledge of employees, workers, locals
• 10% of the plot area is being developed as landscape area /green belt, which will enhance the
beauty and aesthetics of the project area.
• Good solid waste management system consisting of proper collection, designated storage,
provision of composting facility for bio degradable waste disposal.
• Project will set a good example for surrounding area about good solid waste management
system consisting of proper collection, storage & disposal facility.
• Adequate parking space for residents and visitors.
37. Conclusion
• It can be concluded on a positive note that due to the adequate provision and efficient operation
of proposed environmental management systems and mitigation measures, the project activities
during the operation phase would have manageable & largely have reversible impacts on the
environment and on balance the project would be beneficial to surrounding communities and the
region.