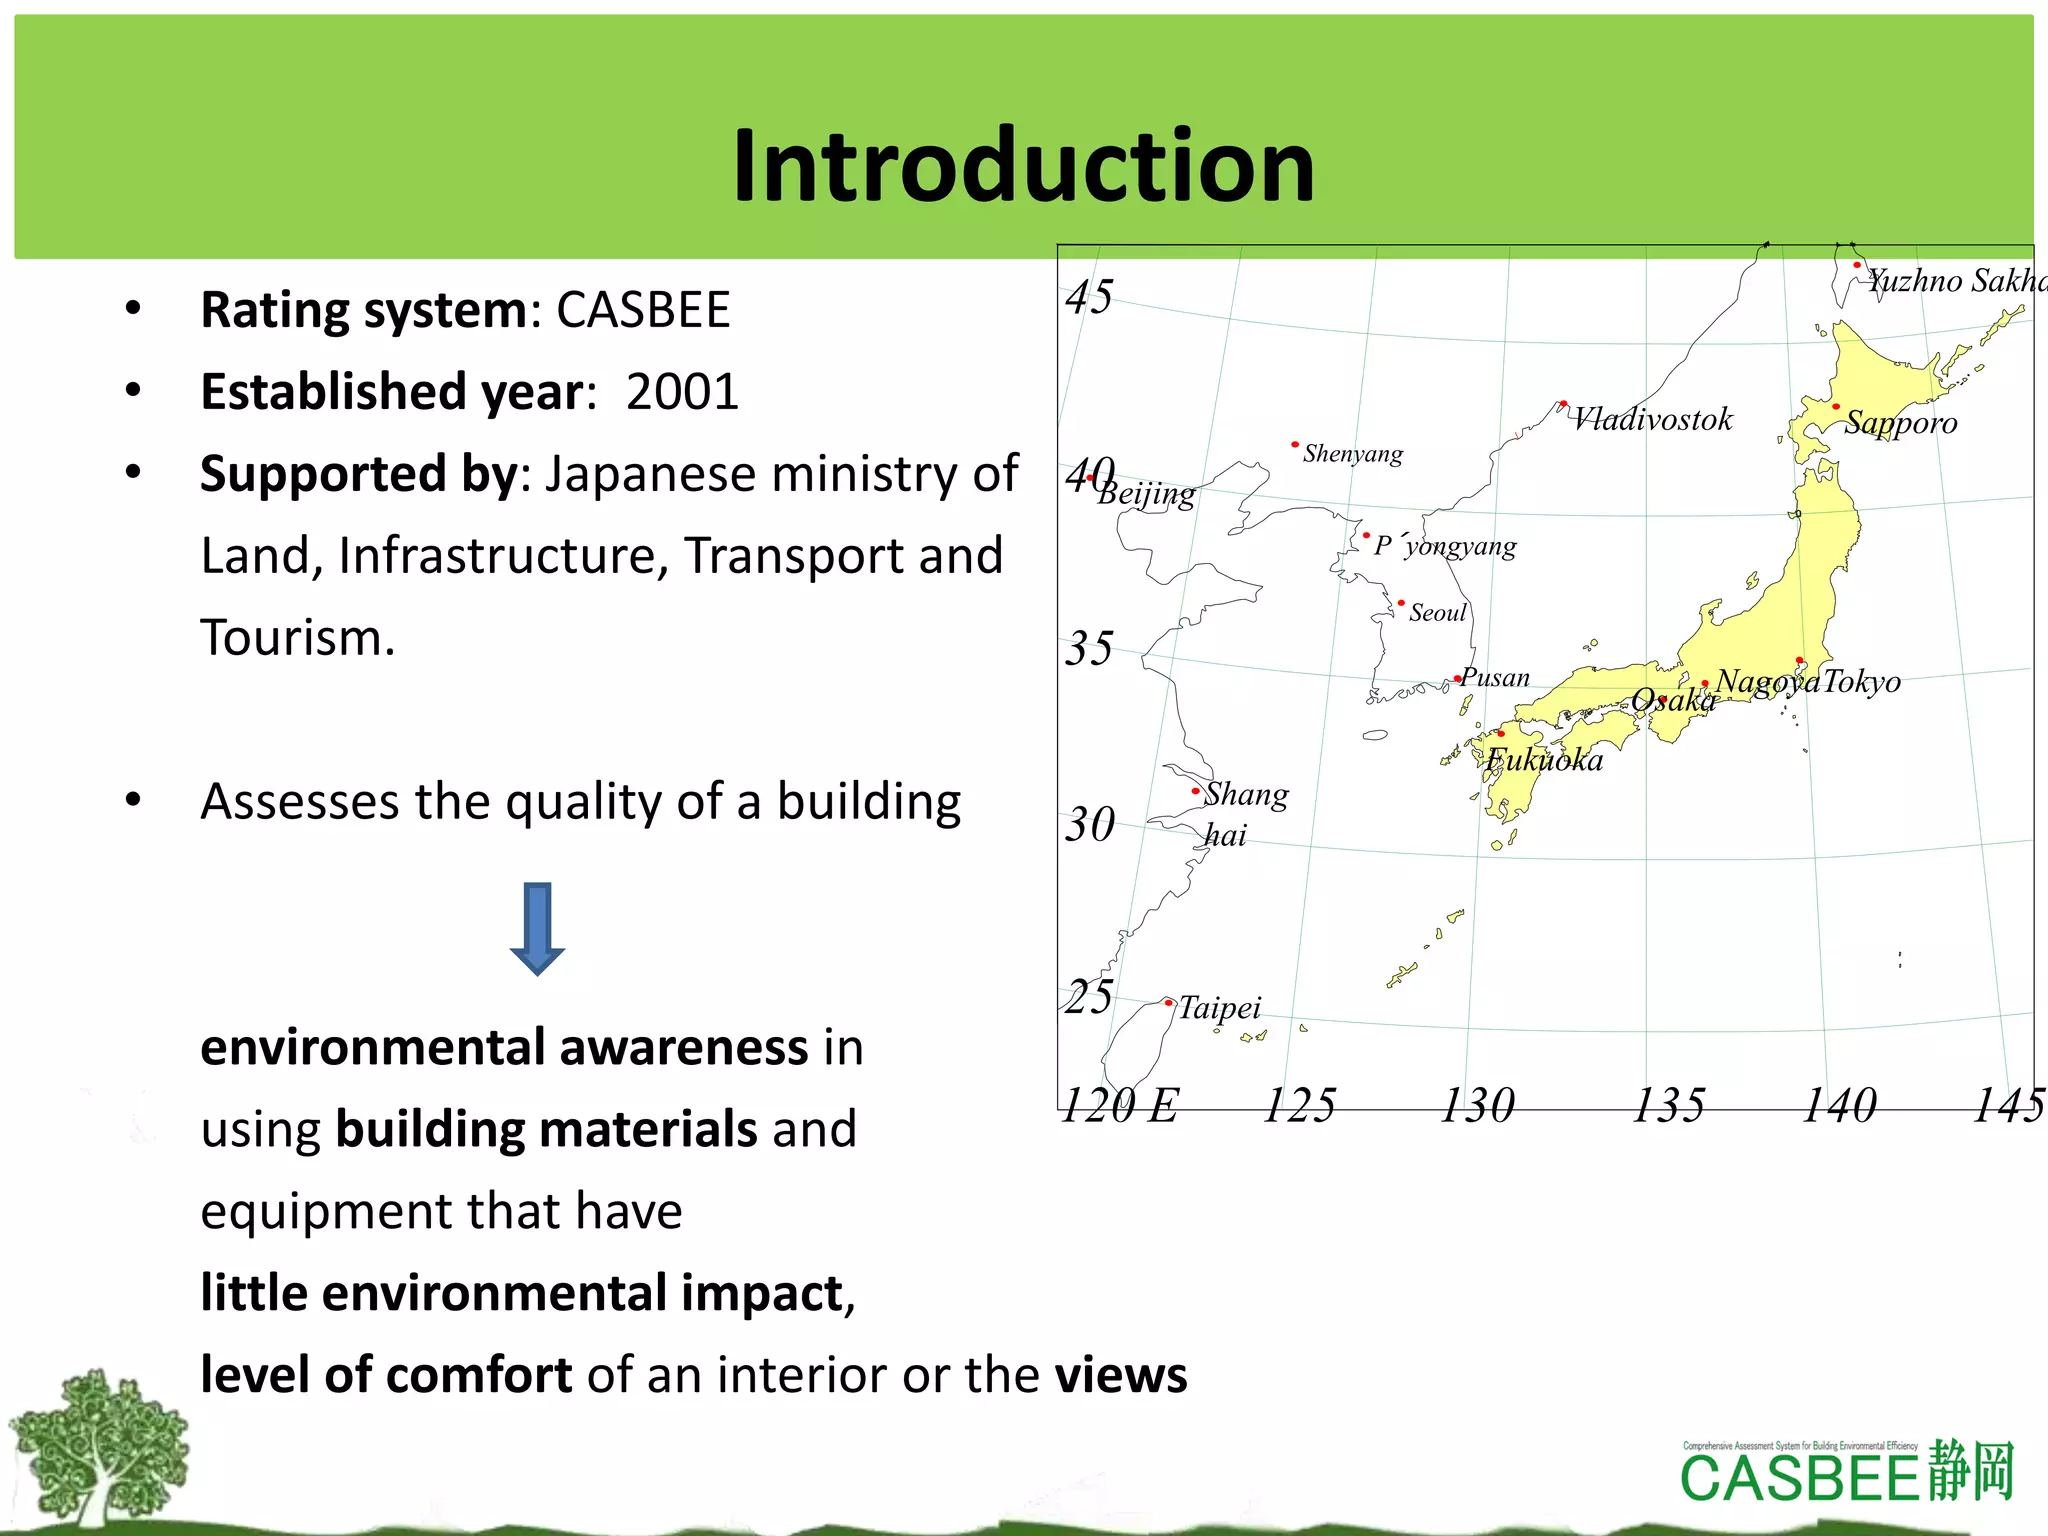
The document provides information on CASBEE, a comprehensive assessment system for built environment efficiency used in Japan to rate the environmental performance of buildings and urban development. It discusses key aspects of CASBEE including its establishment in 2001, assessment tools and principles, criteria for evaluating built environment quality and load, and rating system. CASBEE aims to assess environmental performance throughout a building's lifecycle and awards higher ratings to more sustainable buildings to incentivize green design.


![CASBEE assessment tools principles
[1] Comprehensive assessment throughout the life cycle of the building
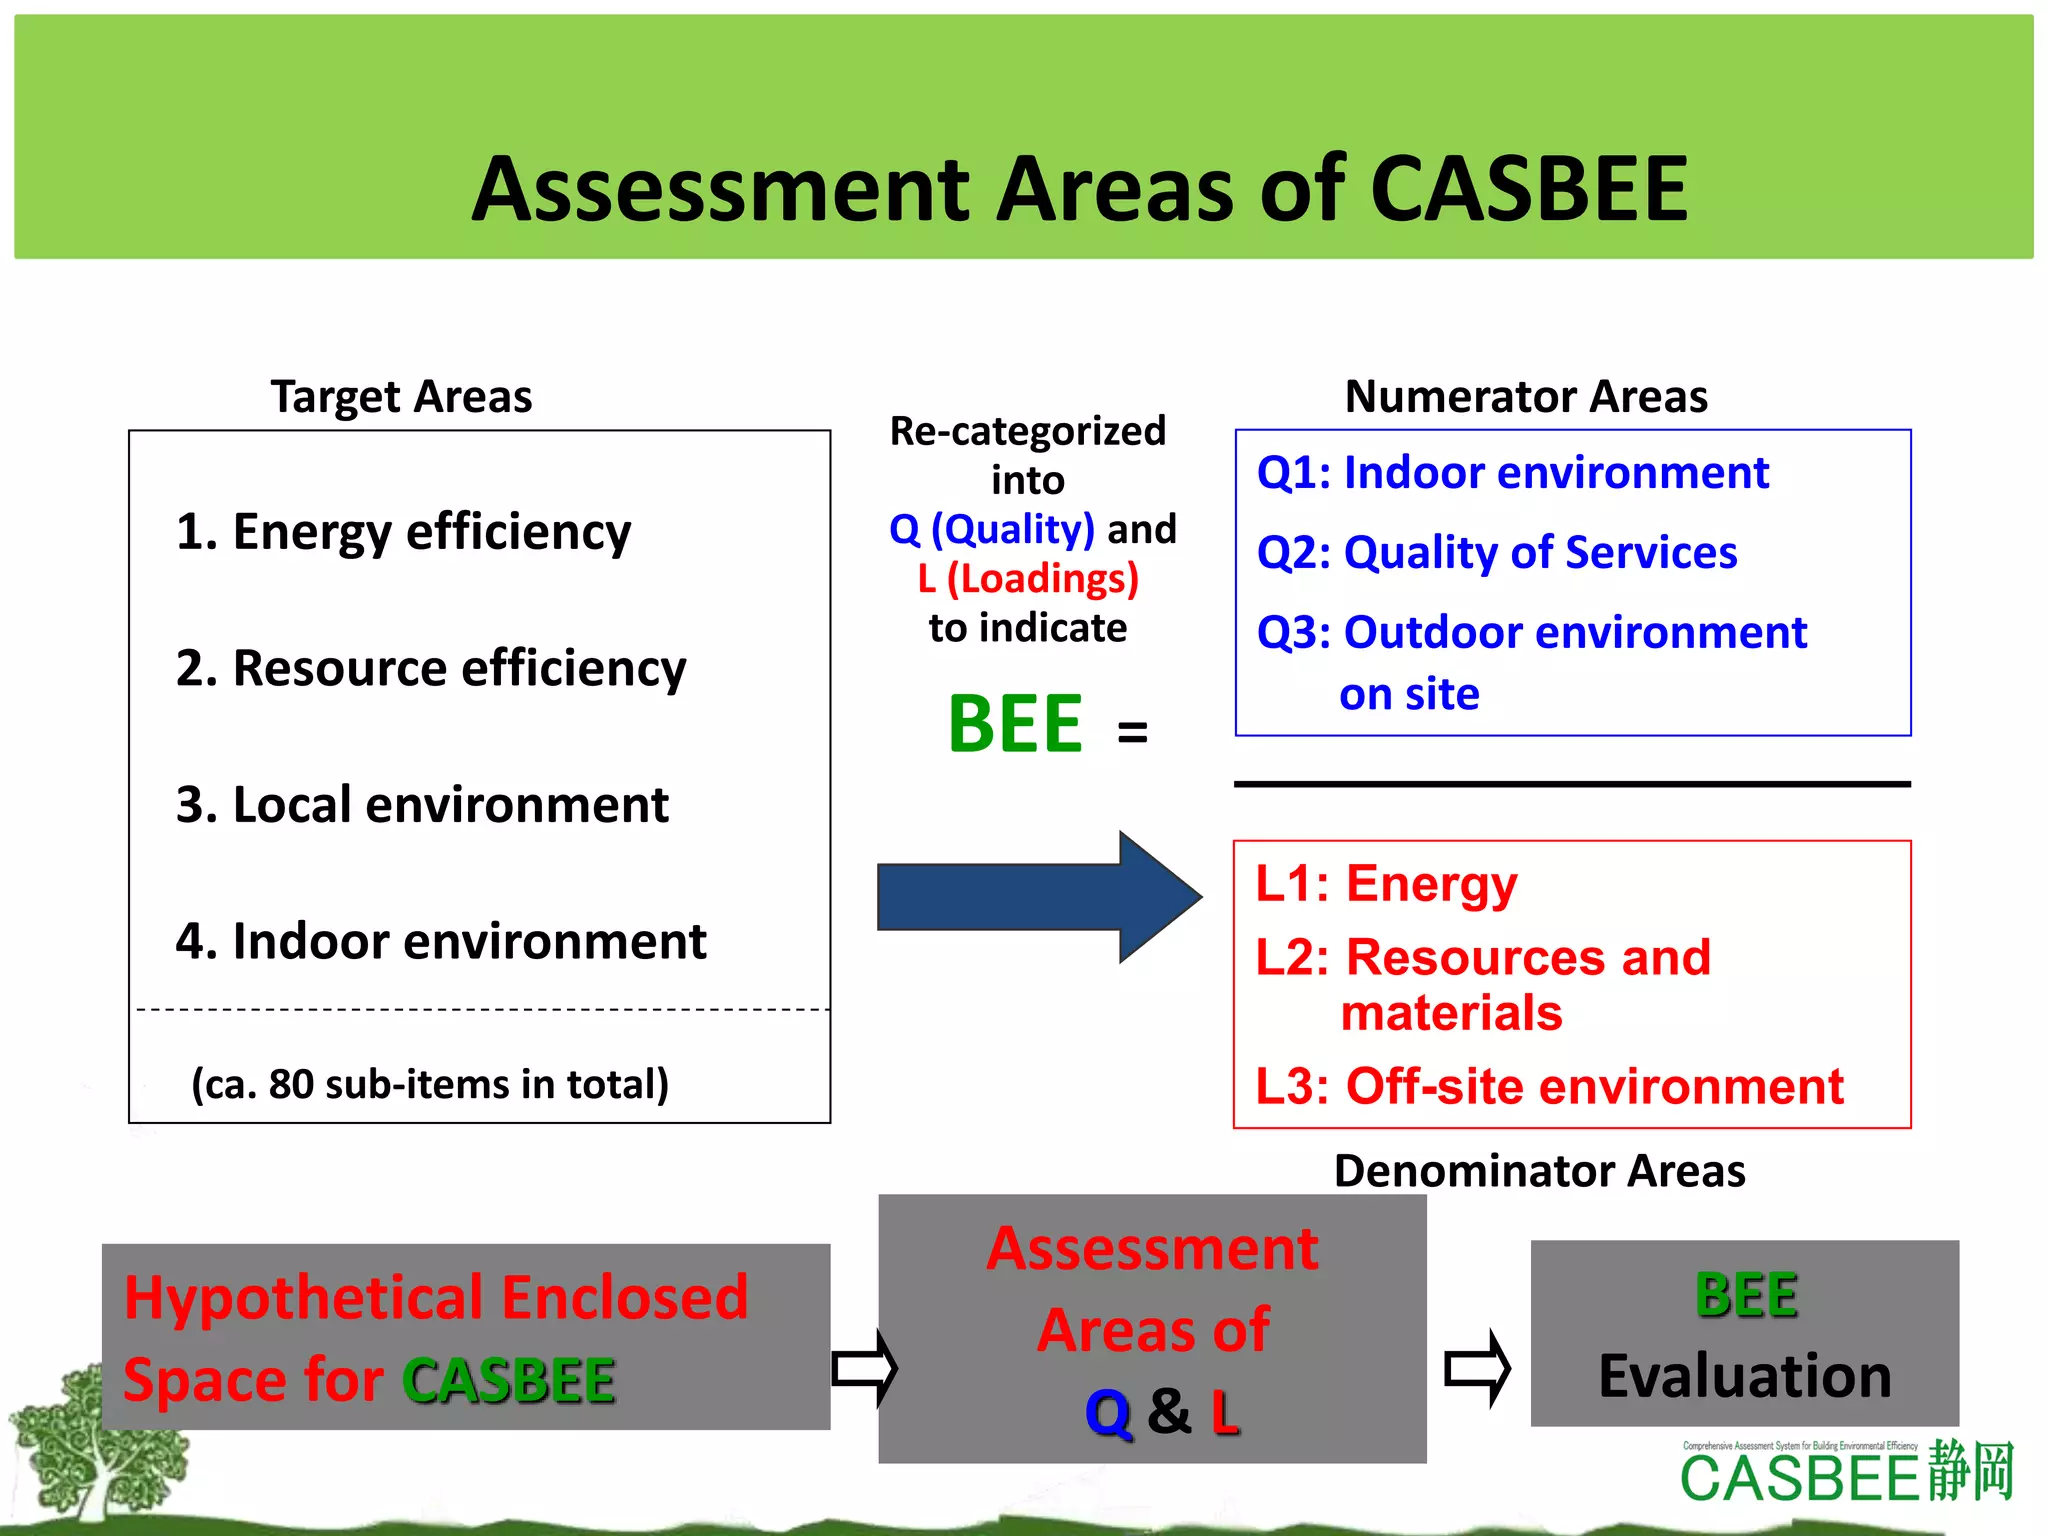
[2] Assessment of the Built Environment Quality and Built Environment
Load
[3] Assessment based on the newly developed Built Environment
Efficiency (BEE) indicator
APPLICATION:
• CASBEE-Housing and CASBEE-Building are applied for individual houses and
buildings to assess their environmental performance.
• CASBEE-Urban Development is used to evaluate environmental performance of
urban blocks and town development.
• CASBEE-City evaluates environmental performance on a local government
scale.
• These are assessed based on BEE indicators by CASBEE.
CASBEE Assessment Tools](https://image.slidesharecdn.com/casbee-161215101729/75/CASBEE-9-2048.jpg)


![CASE STUDY-OBAYASHI TECHNICAL RESEARCH INSTITUTE MAIN BUILDING
[CASBEE rank] S (5 STAR)
[CASBEE tool used] CASBEE for New
Construction (2008 edition)
[Location] Kiyose City, Tokyo
[Completion date] September, 2010
[Site area] 69,401m
2
[Total floor area] 5,535m
2
[Structure] Steel construction
(seismically isolated
structure (Super-Active base
isolation system))
[Owner] Obayashi Corporation
[Designer] Obayashi Corporation
[Contractor] Obayashi Corporation
Project Outline
This building is a central workplace for Obayashi
Corporation.
With an aim to create an environmentally-
friendly workplace, the building adopted a
complex passive.
The systems allowed for 55 percent
reduction in CO2 emissions during
operation, the highest level in Japan.
Awards
Adopted as the 2nd Model Project for Promoting CO2 Reduction in Housing and Building in 2009
by the Ministry of Land, Infrastructure, Transport and Tourism
Source: Japanese Sustainable Building database](https://image.slidesharecdn.com/casbee-161215101729/75/CASBEE-35-2048.jpg)