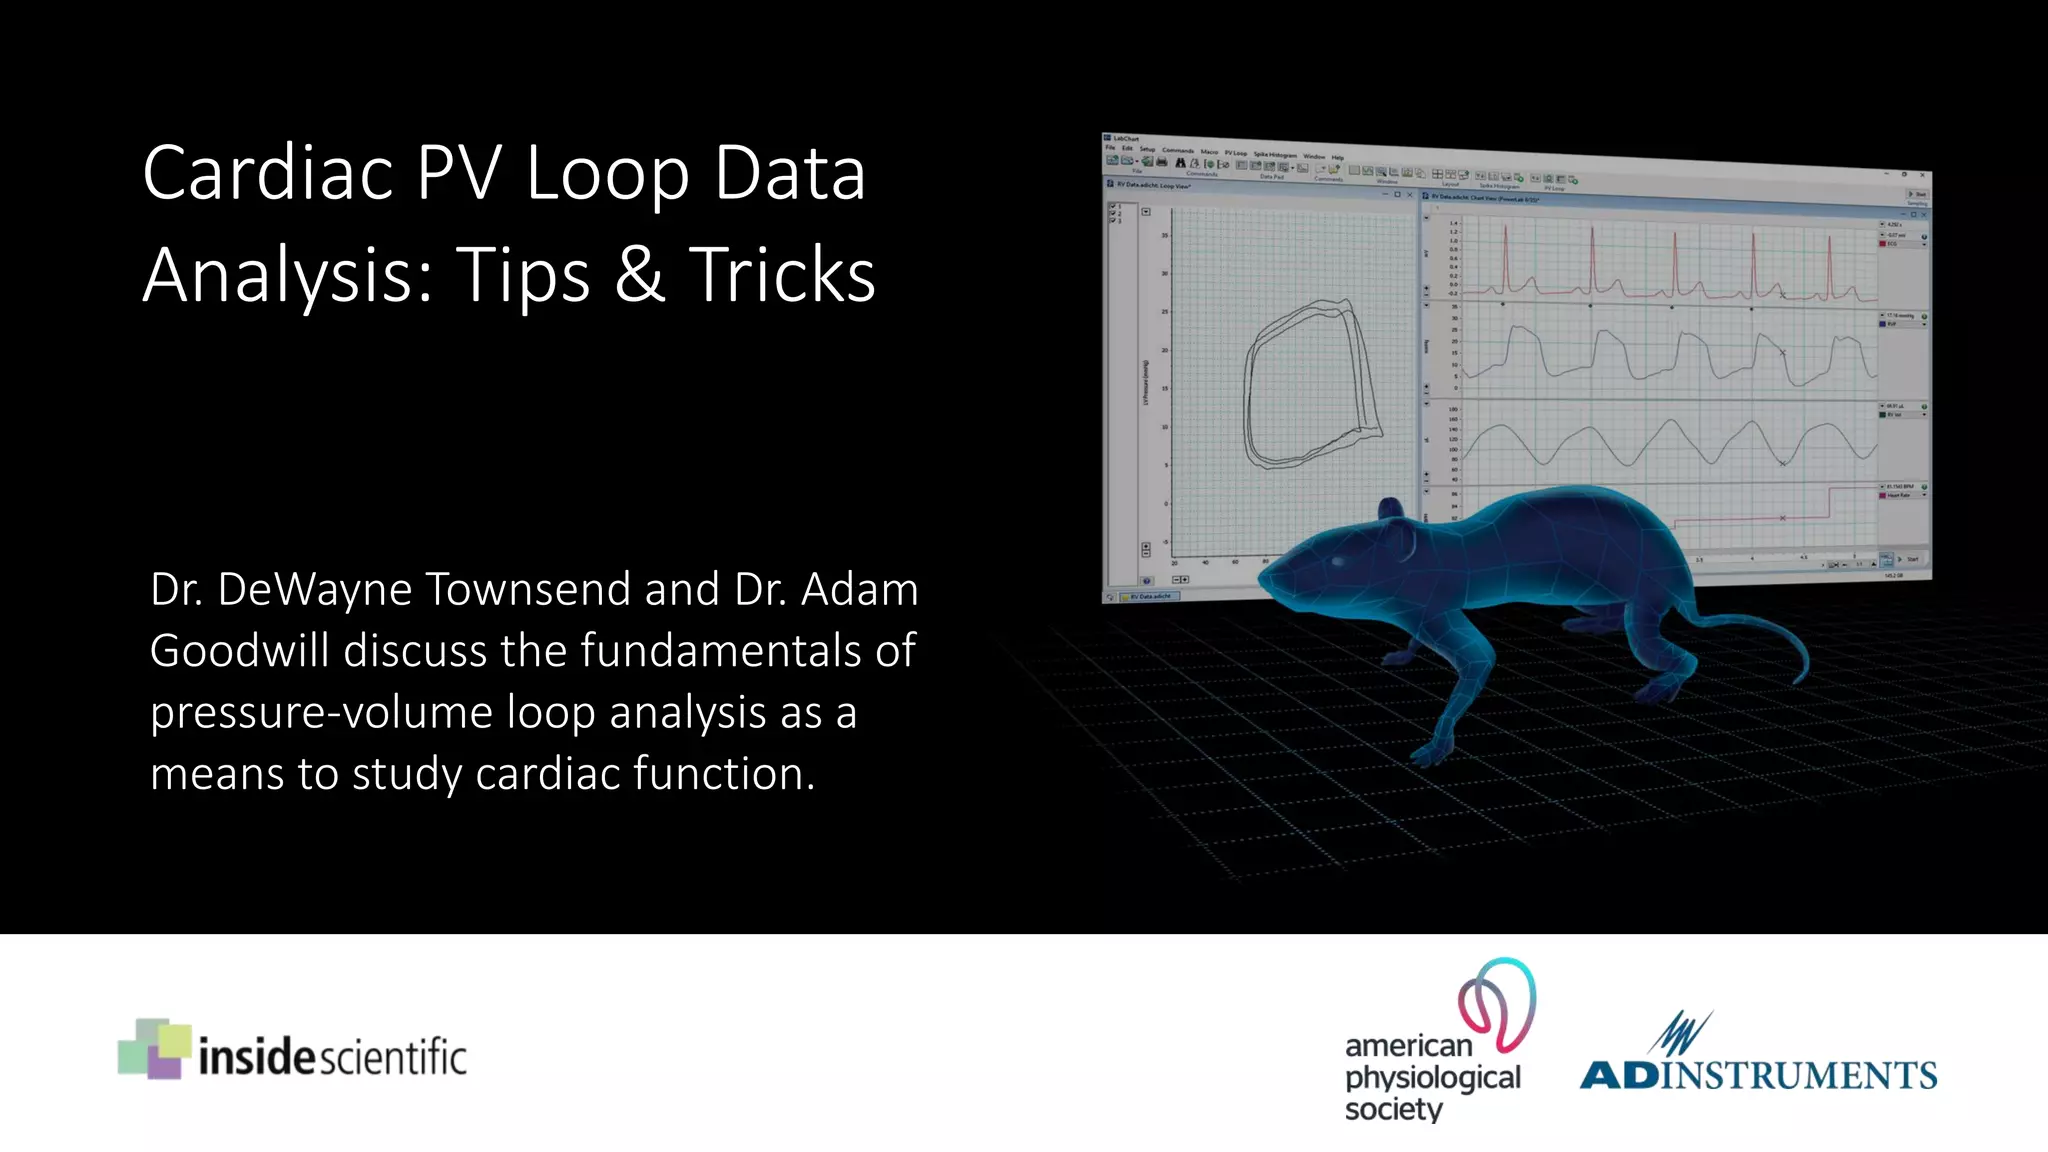
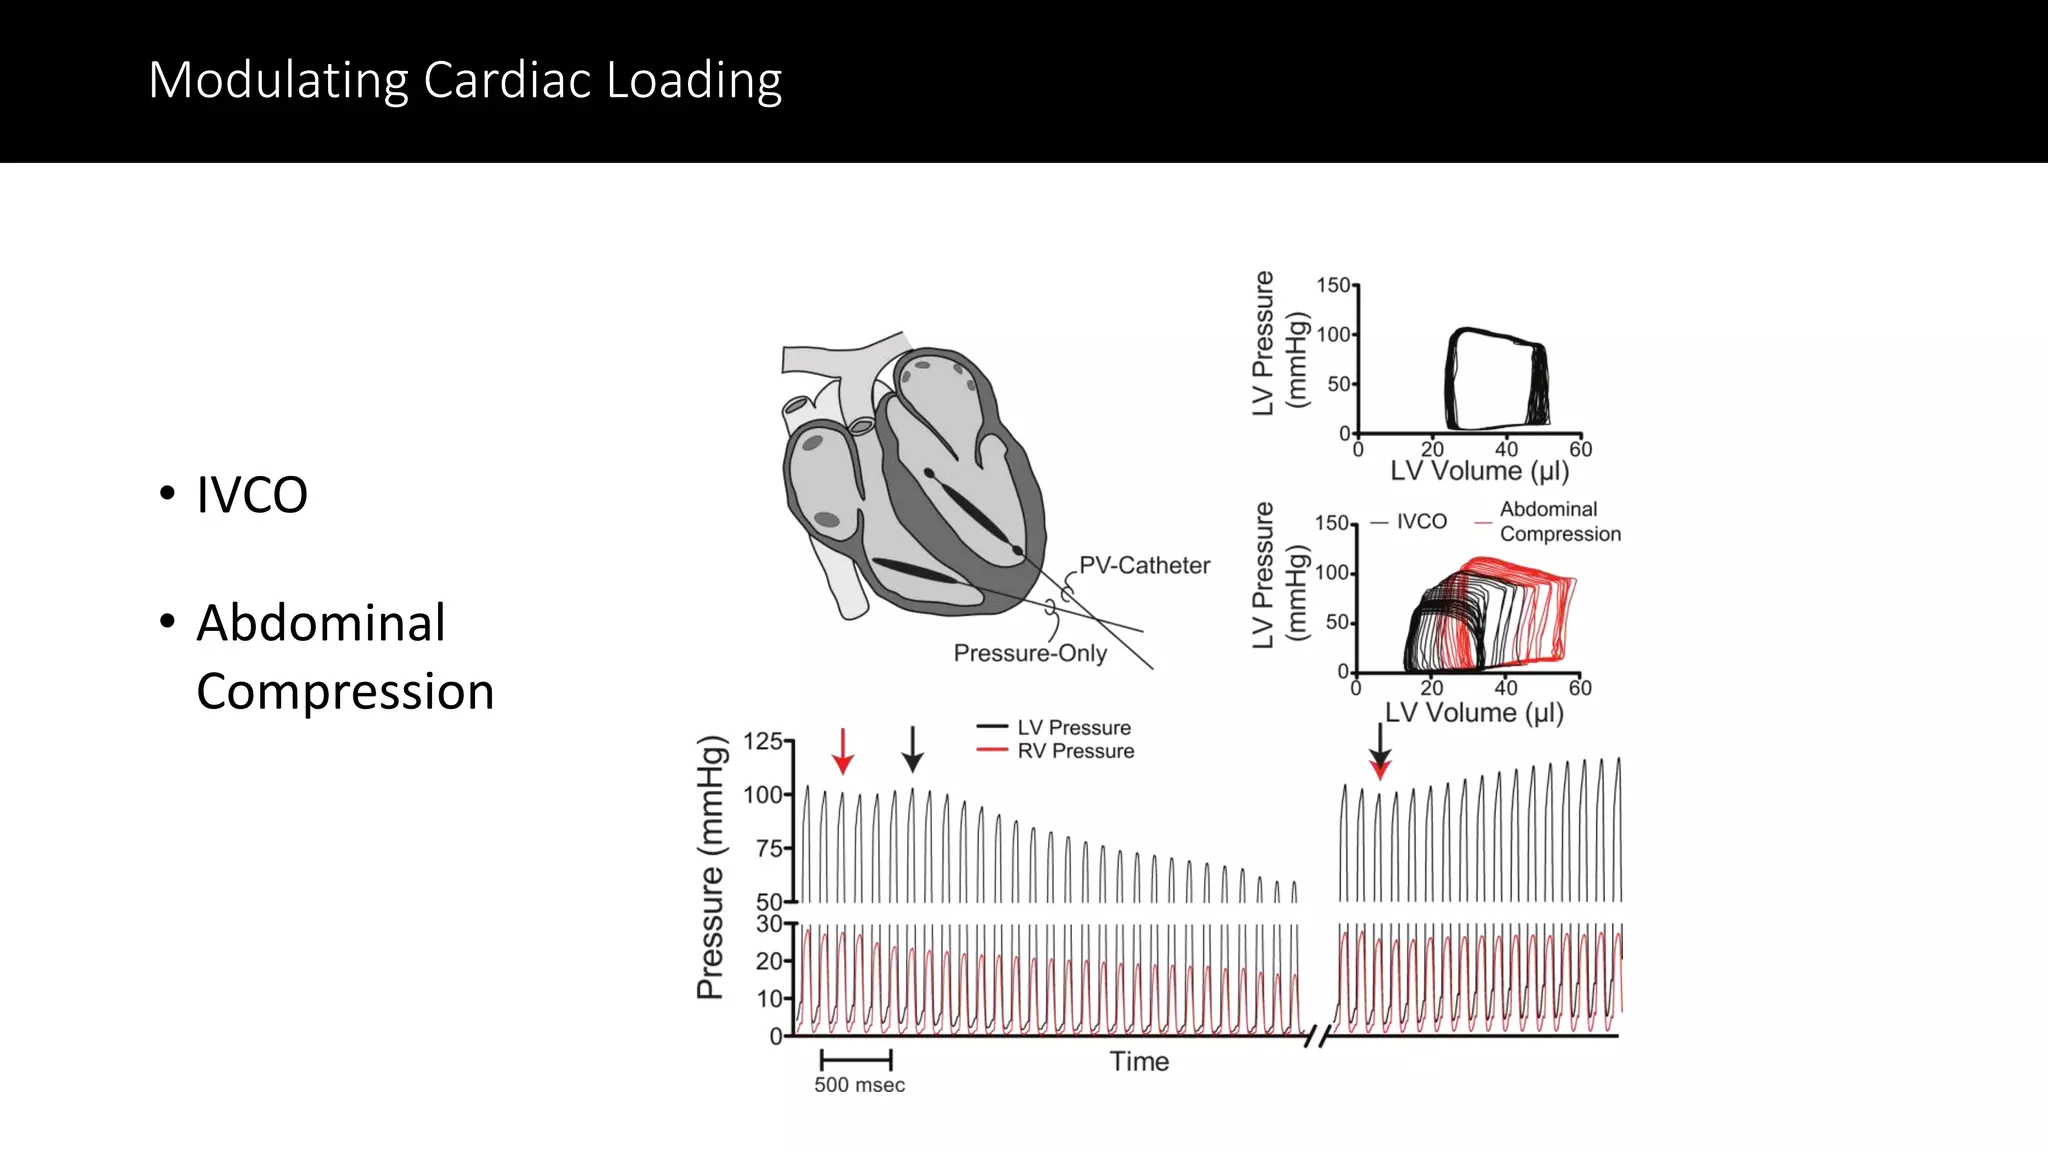
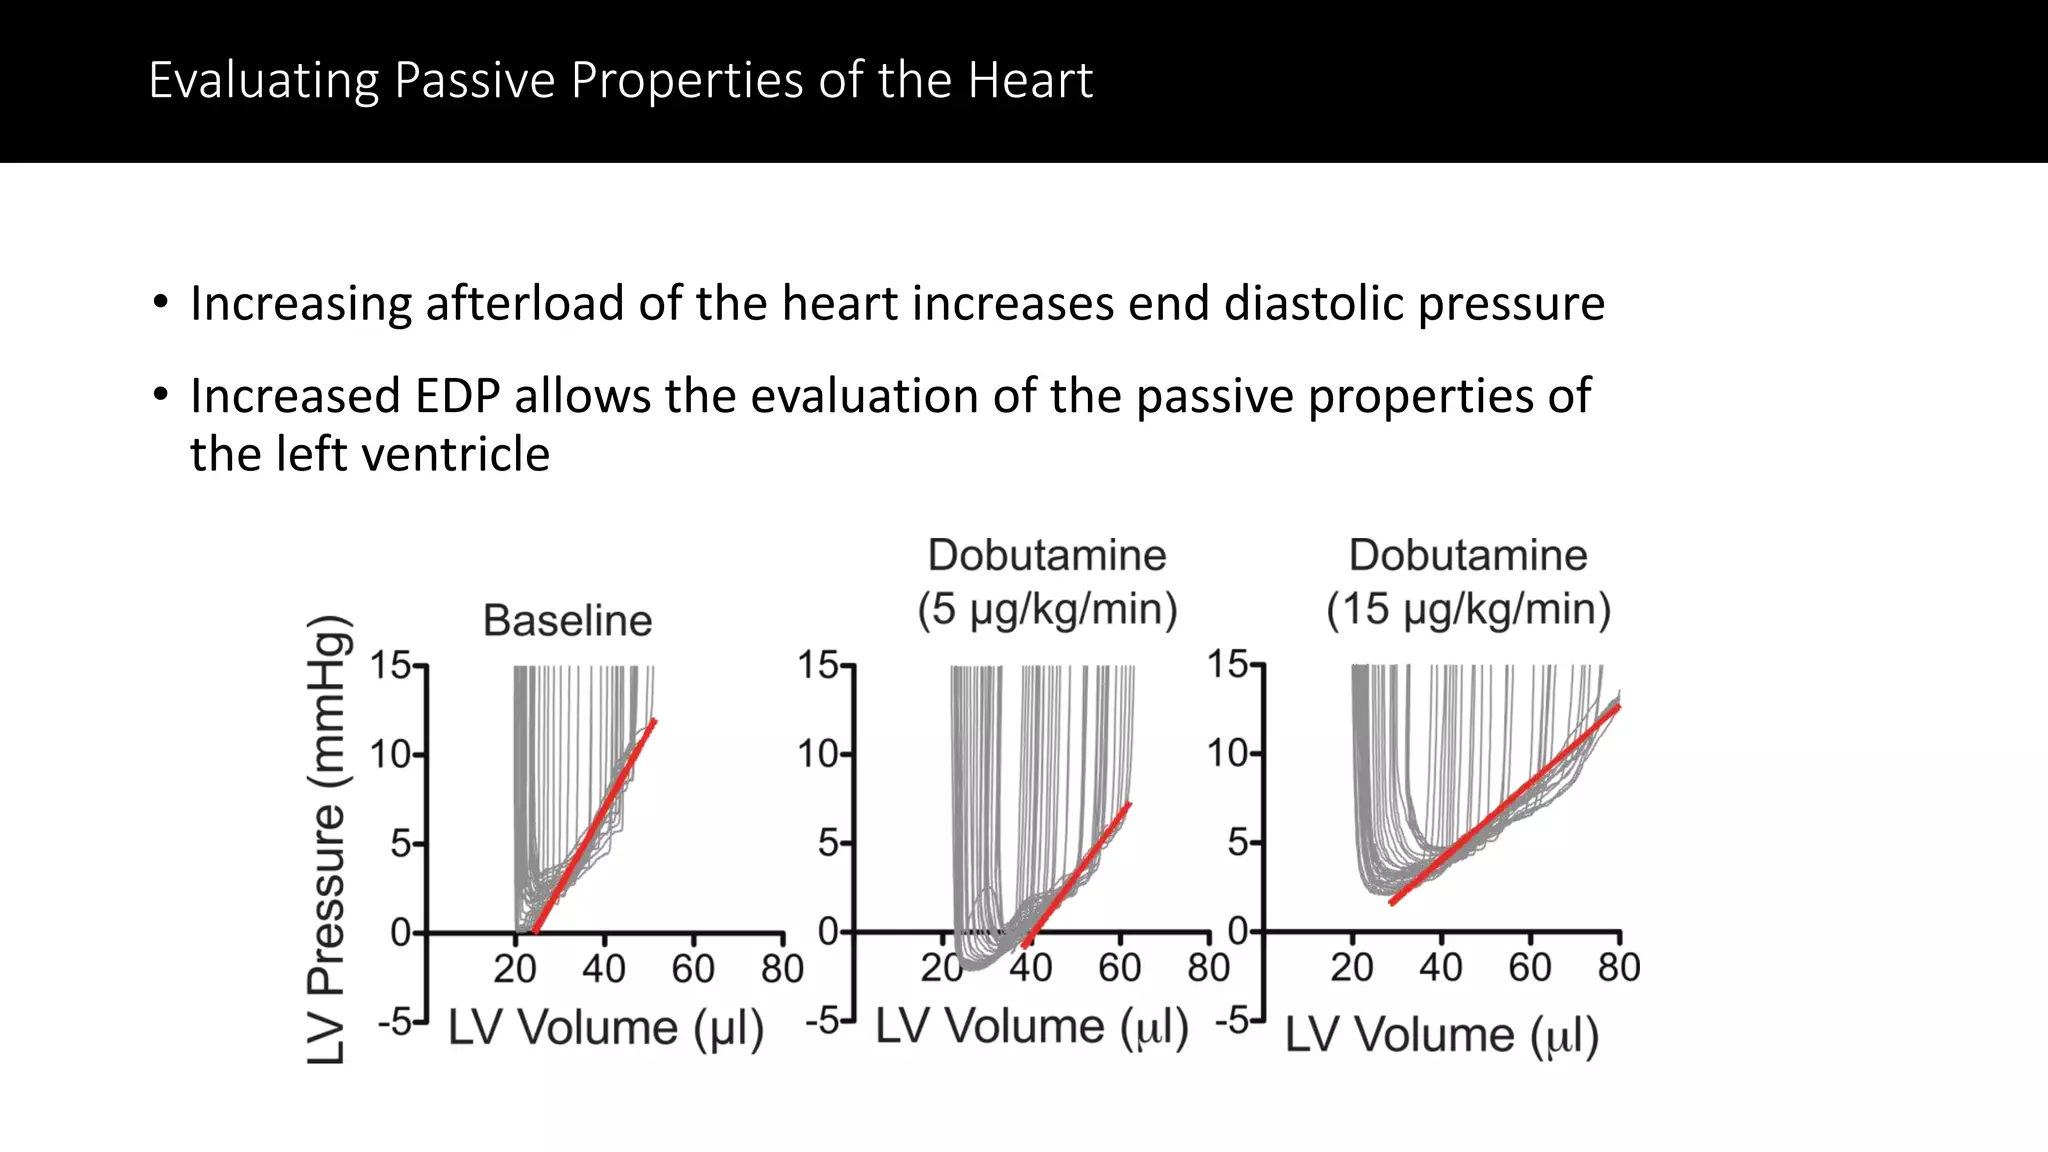
In this American Physiological Society (APS) webinar produced in partnership with ADInstruments, DeWayne Townsend, DVM, PhD and Adam Goodwill, PhD discuss how to collect and analyze quality pressure-volume loop data.
Specifically, they discuss why PV loops are considered the gold standard for measuring cardiac function in vivo, what equipment is required to collect PV loop data, and how to minimize variability in your data. The focus of the webinar is on data analysis – DeWayne and Adam demonstrate how to analyze load-independent measures of function and discuss what the data mean.
Key Learning Objectives Include:
– Why PV loops? What are the alternatives (e.g. echo, MRI, etc.) and how do PV loops compare?
– Why is the Starling effect important?
– Load independent measures: what are they and how are they measured? How are data analyzed and what do they mean?
– Equipment basics: what do you need to record PV loop data?
– What causes variability and how do you mitigate it?
Cancer cell metabolism: special Reference to Lactate Pathway
Cardiac PV Loop Data Analysis: Tips & Tricks
1. Cardiac PV Loop Data
Analysis: Tips & Tricks
DeWayne Townsend, DVM, PhD
Associate Professor, Department of
Integrative Biology and Physiology
University of Minnesota Medical School
Adam Goodwill, PhD
Assistant Research Professor,
Anatomy Cell Biology & Physiology
Indiana University School of Medicine
2. Cardiac PV Loop Data
Analysis: Tips & Tricks
Dr. DeWayne Townsend and Dr. Adam
Goodwill discuss the fundamentals of
pressure-volume loop analysis as a
means to study cardiac function.
3. InsideScientific is an online educational
environment designed for life science
researchers. Our goal is to aid in the
sharing and distribution of scientific
information regarding innovative
technologies, protocols, research tools
and laboratory services
4. To access webinar content,
Q&A reports, FAQ documents,
and information on lab
workshops,
subscribe to our mail list
5. Cardiac PV Loop Data
Analysis: Tips & Tricks
Copyright 2020 A. Goodwill and InsideScientific. All Rights Reserved.
Adam Goodwill, PhD
Assistant Research Professor,
Anatomy, Cell Biology & Physiology
Indiana University School of Medicine
6. WHY Pressure-Volume Loops? - Alternatives
Advantages Limitations
High Availability Technical Variability
Portable Acclimation needed
Inexpensive Quality Control Concerns
Serial Measurements Generally only capture data for short periods
Allows for assessment of chambers Data largely load dependent
Allows for use of conscious animals
High Accuracy & Reproducibility Expensive
Allows for assessment of chambers Requires contrast agents
High Spatial Resolution Cardiac gating necessary
Serial Measurements Lower temporal resolution
High tissue/blood contrast Signal to noise ratio limitations
Generally only capture data for short periods
Data largely load dependent
EchocardiographyCardiacMRI
Modified from: Lindsey, ML et al. Am J Physiol Heart Circ Physiol. 2018 Apr 1;314(4):H733-H752
7. WHY Pressure-Volume Loops? – Data
Boron, Walter & Boulpaep, Emile. Medical Physiology 2nd Edition
Abundance of data
• Pressure and volume for every
cardiac cycle
• Measured Parameters
• ESV, EDV, Pmax, Pmin
• PES, PED , SV, EF, CO
• Easily obtained load dependent
measures
8. WHY Pressure-Volume Loops? – Data
(Continuous) Classic Measures of Cardiac Function
• Tau
• Exponential decay of the ventricular
pressure during isovolumic relaxation
• dP/dt Min
• Maximum rate of rate of LV pressure
decrease (isovolumic index)
• Relaxation Time (RT)
• Duration of isovolumic relaxation
• Stroke Work (SW)
• Area of PV loop, often estimated by:
SV * Mean arterial Pressure
• dP/dt Max
• Maximal rate of LV pressure generation
(isovolumic index)
• Contraction Time (CT)
• Duration of isovolumic contraction
Measures are continuous through entire study
9. WHAT are Starling Effects and WHY are they Important?
What is a Starling Effect:
The greater the preload (stretch) on cardiac muscle fibers prior to contraction,
the greater their force of contraction. (NOT change in contractility)
Boron, Walter & Boulpaep, Emile. Medical Physiology 2nd Edition
What is Contractility?
The innate ability of the heart
muscle (cardiac muscle or
myocardium) to contract
(independent of preload)
13. WHY Pressure-Volume Loops?- Assessing Contractility
Boron, Walter & Boulpaep, Emile. Medical Physiology 2nd Edition
14. WHAT are load-independent measures? – Assessing Ventricular Compliance
• Diastolic volume is influenced by the loading conditions and elastic properties of the heart
• Decreases in diastolic function shift the end-diastolic pressure-volume relationship upward
• LV Compliance is a reciprocal of the slope of EDPVR
https://www.cvphysiology.com/Cardiac%20Function/CF014
15. WHY Pressure-Volume Loops? – Cardiac Energetics
External work (EW) – energy that propels blood from the
ventricles into the aorta or pulmonary artery
- stroke work = pressure x stroke volume
Potential work (PW/PE) – energy generated with
contraction that is NOT converted to external work
i.e. energy to stretch and lengthen viscous elements
in the ventricles.
Pressure Volume Area (PVA) – Sum of total work and
potential work. Directly proportionate to myocardial
oxygen consumption
Cardiac Power – external (stroke) work x HR
- work per unit time
Cardiac Efficiency – external work per unit energy
consumedKnaapen et al. Circulation 2007 Feb 20;115(7):918-27
16. Cardiac PV Loop Data
Analysis: Tips & Tricks
DeWayne Townsend,
DVM, PhD
Associate Professor, Department of
Integrative Biology and Physiology
University of Minnesota Medical School
Copyright 2020 D. Townsend and InsideScientific. All Rights Reserved.
17. Surgical and Anesthesia
• Blood loss is a big deal in mice
• Total blood volume is 77-88 ml/kg
• 1.54 – 1.76 mL in a 20 g mouse
• 2.31 – 2.64 mL in a 25 g mouse
• Thus losses of 0.1-0.2 mL are hemodynamically significant
• Insensible fluid loss
• Water lost through evaporation
• Respiratory loss (≈4ml/kg/hr)
• Exposed Tissue (≈2-3 ml/kg/hr)
• Recommend ≈5ml/kg IV 10% Albumin in 0.9% NaCl
• More if blood loss- 1 Q-tip ≈ 0.1 ml
• Must replace lost blood
Sources of Variability in PV Loops in Rodents
18. Catheter Placement – Carotid Approach
Advantages
• Closed-Chest Approach
• Ventilation not required
• Although often used to
allow respiratory control
Disadvantages
• Catheter placement
defined by aortic
anatomy
• Laparotomy required to
occlude the vena cava
• Potential for outflow
track obstruction in
smaller hearts
19. Catheter Placement – Apical Approach
Advantages
• Catheter Placement
can be optimized
• No outflow track
obstruction
• No additional surgery
for inferior vena cava
occlusion
Disadvantages
• Requires ventilation
• Extensive surgical
manipulation
• Potential to damage
the myocardium
20. Catheter Placement – Papillary Entrapment
• A ventricular pressure artifact
resulting from the direct
interaction of cardiac structures
with the pressure transducer.
21. • Positive pressure ventilation creates
changes in left ventricular pre-load
• This creates respiratory dependent
oscillation in left ventricular
pressure
• Collecting data during brief periods
of apnea results in more stable
measures of cardiac function
Respiratory Artifacts
23. Evaluating Passive Properties of the Heart
• Increasing afterload of the heart increases end diastolic pressure
• Increased EDP allows the evaluation of the passive properties of
the left ventricle
24. Analysis Issues
• Pause for 10–15 seconds after inferior vena caval occlusion
• The drop in blood pressure resulting from this maneuver activates the baroreceptor reflex.
• This increases the sympathetic nervous system output to the heart
• Any measures taken immediately after an occlusion will have increased contractility because
of this nervous input.
• Similar, but reversed, for abdominal compression
• Loop rejection
• Occasionally there will be an arrhythmic beat during a period of measurement.
• The data from these loops will be outliers and should be removed
• Removed loops should be recorded and original data maintained to preserve the integrity of
the data workflow
25. DeWayne Townsend, DVM, PhD
Associate Professor, Department of
Integrative Biology and Physiology
University of Minnesota Medical School
Adam Goodwill, PhD
Assistant Research Professor,
Anatomy Cell Biology & Physiology
Indiana University School of Medicine
Thank You!
To learn more about PV loop analysis solutions from
ADInstruments, please visit:
www.adinstruments.com/products/pv-loop