This document outlines the validation and determination of caffeine content in energy drinks using HPLC methods. It includes an introduction on caffeine, the principle of HPLC separation, materials and methods for sample preparation and instrument operation, results and discussion of the validation including calibration curves, precision, accuracy, specificity, LOD and LOQ. The method was found to be precise, accurate, specific and sensitive for quantifying caffeine levels in various energy drinks in under 3 minutes. In conclusion, the validated HPLC method provides an effective quality control technique for caffeine analysis in energy drinks.
![INTRODUCTION
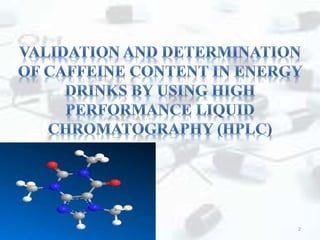
Naturally, Caffeine can be found in many leaves and seeds of many plants, there
is about more than 63 plant species around the world contain Caffeine. Its
chemical name is 1, 3, 5- trimethylxanthine and its chemical formula is
C8H10N4O2. Caffeine molecular mass is 194.19 g/mole, and its melting point is
236°C. Sublimation degree is 178°C. It was found that caffeine "1,3,7-trimethyl-
1H-purine-2,6(3H,7H)-dione" has also been recognised to play a significant role
in the pharmaceutical industries and is pharmaceutically important due to it’s
chemical properties. In blood, there in no highly amount of protein bound in
caffeine. Moreover, caffeine found in brain with high concentration due to the
lipophilic properties. The main techniques use to determine the levels of caffeine
are LC-Spectrophotometric [3], Spectrophotometric method[4,5,6], and
HPLC[7,8,9].
Fig 1. Structural form of Caffeine
4](https://image.slidesharecdn.com/caffeineppt-210613093327/85/VALIDATION-AND-DETERMINATION-OF-CAFFEINE-CONTENT-IN-ENERGY-DRINKS-BY-USING-HPLC-METHOD-4-320.jpg)
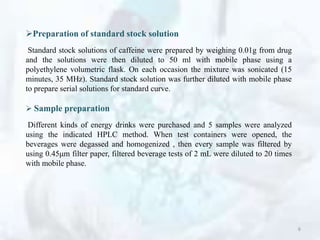

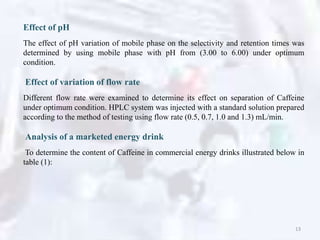
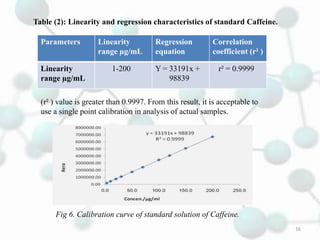
![Linearity and range
The linearity range was evaluated by using the standard solution prepared in the
mobile phase. The calibration range for caffeine was found to be 1 – 200 μg/mL. The
calibration graph was automatically drawn by plotting the value of peak area against
the concentration of caffeine.
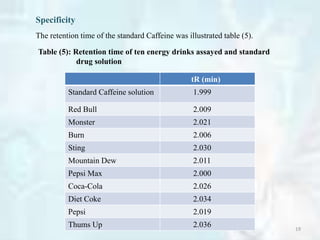
Specificity
The specificity of the proposed method was evaluated by contrasting chromatogram
acquired from standards Caffeine and that from marketed solutions.
Limits of detection and Limit of quantitation
Sensitivity of the proposed method was assessed as far as (LOD) and (LOQ)[11].
"LOD = 3 SD/S and LOQ = 10 SD /S, where S.D. is the standard deviation of y-
intercept and S is the slope of the line"
12](https://image.slidesharecdn.com/caffeineppt-210613093327/85/VALIDATION-AND-DETERMINATION-OF-CAFFEINE-CONTENT-IN-ENERGY-DRINKS-BY-USING-HPLC-METHOD-12-320.jpg)
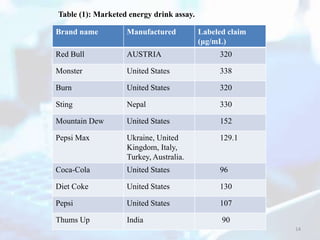
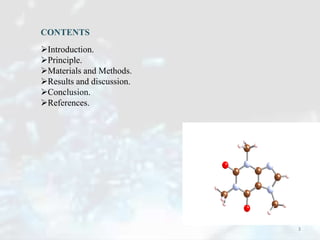
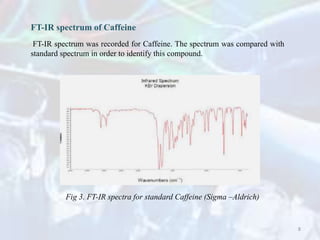
![Accuracy
Accuracy was examined by using three different concentrations for all samples.
In this study, the degree of agreement between a measured value and a true value
was determined by using the values of recoveries (%R, replicate analysis n = 3).
Table (4): Percentage recovery data for standard drug
Amount added
(µg/mL)
Amount found
(µg/mL) Recovery [%]
Caffeine
20 19.620 98.091
50 50.710 101.501
150 150.500 100.500
From these acceptable limit of percentage recovery, Estimation of caffeine can
be accurate quantitatively
18](https://image.slidesharecdn.com/caffeineppt-210613093327/85/VALIDATION-AND-DETERMINATION-OF-CAFFEINE-CONTENT-IN-ENERGY-DRINKS-BY-USING-HPLC-METHOD-18-320.jpg)


![APPLICATIONS OF GAS CHROMATOGRAPHY [APPLICATIONS OF GC] BY Prof. Dr. P.RAVISA...](https://cdn.slidesharecdn.com/ss_thumbnails/appicationsofgc-prs-130615130914-phpapp01-thumbnail.jpg?width=640&height=640&fit=bounds)


