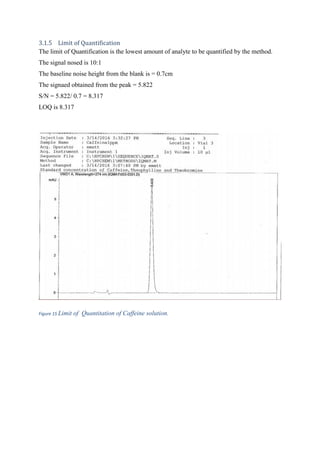
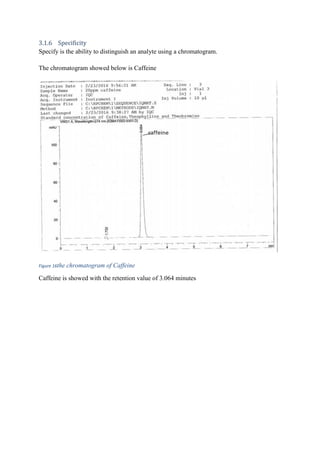
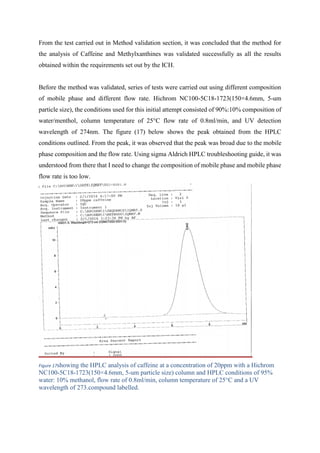
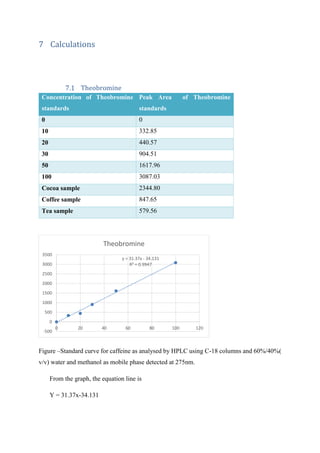
This document presents a study on the determination of methylxanthines (caffeine, theobromine, and theophylline) in cocoa, coffee, and tea using HPLC. The author develops and validates an HPLC method for extracting and analyzing the methylxanthine content of different samples. Results show theobromine is mainly present in cocoa, caffeine is abundant in coffee, and only trace amounts of theophylline are found in the three samples. Gas chromatography-mass spectrometry is also used to identify methylxanthines and observe their fragmentation patterns.


![8 References
Clark, I. & Landolt, H. P., 2015. Coffee, caffeine, and sleep: A systematic review of epidemiological
studies and randomized controlled trials. Elsvier journal, pp. 1-9.
Ashcroft, D. A. E., n.d. An Introduction to Mass Spectrometry, Leeds: s.n.
B.Fredholm, B., 2011. Pharamacokinetic and Metabolism o fNatural Methylxanthines in Aninal and
Man. Handbook of Experimental Pharamacology, Volume 200, p. 36.
Bennett Alan Weinberg and Bonnie K. Bealer, 2016. World of caffeine. [Online]
Available at: http://worldofcaffeine.com/controlling-pain/
Books, H., 2016. Wikicaffeine. [Online]
Available at: https://en.wikipedia.org/wiki/Caffeine
[Accessed 17 05 2016].
cutris, S., 2016. SPE lecture notes. Limerick Institue Of thechnology : s.n.
Douglas, F., n.d. GC/MS Analysis, s.l.: Scientific Testimomny .
E. M. Thurman, M. S. M., 2016. WikiSPE. [Online]
Available at:
https://www.google.ie/search?q=spe+extraction&espv=2&biw=1024&bih=667&site=webhp&source
=lnms&tbm=isch&sa=X&ved=0ahUKEwiokpWa8-
XMAhXMD8AKHQFYDBEQ_AUIBigB#imgrc=m29jiK9azdSbaM%3A
[Accessed 17 05 2016].
Greay, M., 2016. Liqiud Chromatography lecture notes. Limerick: Limerick Instiurtue of Technology.
Group, W. R., 2007. Drugbank. [Online]
Available at: http://www.drugbank.ca/drugs/DB01412
[Accessed 17 05 2016].
Health, W. K., 2009. Drugs.com. [Online]
Available at: http://www.drugs.com/npp/cocoa.html
[Accessed 25th March 2016].
Henry Vandyke Carter, H. G., 1918. Wiki Theobromine. [Online]
Available at: https://en.wikipedia.org/wiki/Theobromine#/media/File:Gray961.png
[Accessed 17 05 2016].
Igelige Gerald, D. E. A. a. A. A., 2014. Determination of CaffeineIn Beverages. American Journal of
Engineering Research (AJER), 3(8), pp. 124-137.
João Rodrigo Santos, A. O. R., 2012. Development of a chromatographic low pressure flow injection
system:Application to the anaysis of methylxanthine in coffee. Analytical Chimica Acta , Volume 715,
pp. 57-63.](https://image.slidesharecdn.com/8d431be8-1ad5-4e29-a53e-b6660f7084c5-160905115246/85/Methylxanthines-65-320.jpg)
![Labcompare, 2009. Labcompare. [Online]
Available at: www.labcompare.com
[Accessed 30 march 2016].
Magalhães, Luis M; Machado, Sandia; Marcela, Segundo A; Lopes, Joao A; Pascoa, Ricardo N.M.J,
2016. Rapid assessment of bioactive phenolics and methylxanthines in spent coffe grounds by FT-NIR
spectroscopy. Talanta, Issue 147, pp. 460-467.
Mashkouri, Nahid Najafi; Hamid, Ahmadi Seyed; Afshin, Khorrami Rajabi, 2003. Determination of
caffeine in black tea leaves by Fourier transform infrared spectrometry using multiple linear
regression. Mircochemistry Journal, Issue 75, pp. 151-158.
P.J.Higson, S., 2004. High -Perfromance Liquid Chromatography . In: Anaytical Chemistry . Oxford:
University Press , p. 237.
Paradkar, M.M, and Irudayaraj, 2002. Rapid determination of caffeine content in soft drinksusing
FTIR-ATR spectrosco. Food Chemistry, Issue 78, pp. 261-266.
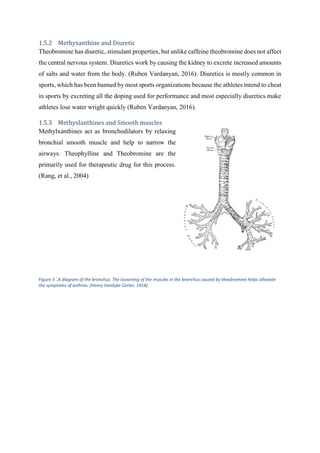
Rang, H., Dale, M., Ritter, J. & Flower, R., 2004. Drugs used in asthma. In: Phamarcology . Chichester,
England: John Wiley& sons Ltd, p. 345.
Ruben Vardanyan, V. H., 2016. Diuretics. Department of Chemistry and Biochemistry, University of
Arizona, pp. 317-327.
Saberi, H., 2010. Tea; A Globval History. London: Reaktion Books.
Scientific, C., 2013. Crawford Scientific. [Online]
Available at: http://www.crawfordscientific.com/Chromatography-Technical-Tips-Diode-Array-
Detector-Settings.html
[Accessed 11 04 2016].
Scientific, C., n.d. Chromaacademy. [Online]
Available at:
http://www.chromacademy.com/lms/sco5/Theory_Of_HPLC_Reverse_Phase_Chromatography.pdf
[Accessed 17 05 2016].
Sergio, A., Salvador , G. & Miguel , d. l. G., 2005. Solid-phase FT-Raman determination of caffeine in
energy drinks. Analytical Chimica Acta , 547(2), pp. 197-203.
Shu, Chem, n.d. Chem SHU. [Online]
Available at: http://hplc.chem.shu.edu/NEW/HPLC_Book/Introduction/int_typs.html
[Accessed 18th April 2016].
Tannenbanum, G., 1941. Chocolate: A Marvelous Natural Porduct of chemistry. Journal of Chemistry,
81(8), p. 1131.
Tavita, T. T., 2012. savalinews. [Online]
Available at: http://www.savalinews.com/2012/06/25/cocoa-coffee-projects-fruiting/
[Accessed 11 04 2016].](https://image.slidesharecdn.com/8d431be8-1ad5-4e29-a53e-b6660f7084c5-160905115246/85/Methylxanthines-66-320.jpg)
![University, S. H., n.d. Teaching.shu.ac. [Online]
Available at: http://teaching.shu.ac.uk/hwb/chemistry/tutorials/chrom/gaschrm.htm
[Accessed 17 05 2016].
vine, t. &., 2015. Seed and Vine. [Online]
Available at: http://seedandvine.com/product/coffee-tree-arabica-coffea
[Accessed 17 05 2016].
Waters, 2006 . New Mexico State University (College of Arts and science). [Online]
Available at: http://web.nmsu.edu/~kburke/Instrumentation/Waters_HPLC_MS_TitlePg.html
[Accessed 11 04 2016].
WikiTea, 2016. wikipedia. [Online]
Available at: https://en.wikipedia.org/wiki/Tea
[Accessed 17 05 2016].
Yesair, D., Branfman, A. & Callahan, M., 1984. The Methylxanthine Beverages and Foods:
Chemistry,Cosumption and health effect. New York : Alan R. Liss.Inc .](https://image.slidesharecdn.com/8d431be8-1ad5-4e29-a53e-b6660f7084c5-160905115246/85/Methylxanthines-67-320.jpg)