Download to read offline
![International Journal of Engineering Research and Development
e-ISSN: 2278-067X, p-ISSN: 2278-800X, www.ijerd.com
Volume 10, Issue 7 (July 2014), PP.15-21
Performance measurement of EDM parameters on high carbon-chromium
15
steel
Dhruv kant Rahi¹, Manish Vishwakarma2
1M.Tech,MED,MANIT Bhopal(INDIA)
2Asst.Professor, MED,,M.A.N.I.T.Bhopal(INDIA)
Abstract:- Electrical discharge machining (EDM) is an advance machining process primarily used for hard
metals which are not possible to machine. In die Sinking EDM process, two metal parts are submerged in an
insulating liquid and areconnected to a source of current which is switched on and off automatically. Parametric
analysis has been done by conducting a set of experiments on high carbon-chromium steel with copper and
graphite as electrodes and high carbon oil as the dielectric medium. This study focuses on the influence of
process parameter such as pulse on time, duty cycle, current, voltage gap and pressure on EDM and effect of
this process parameter on MRR, EWR and surface roughness has been studied.CCD was used for conducting
the experiment and developing empirical models for MRR, surface roughness and EWR with the help of
Minitab software.
Key terms:- CCD, ANOVA analysis and Material removal rate, Surface Roughness
I. INTRODUCTION
Electrical discharge machining is an advance machining process primarily used for hard and difficult
metals which are difficult to machine with traditional techniques. Only electrical conducting materials are
machined by this process. Material is removed from the work piece by a series of rapidly recurring current
discharge between two electrodes, separated by a dielectric fluid and subject to an electric voltage [1]. The EDM
process is best suited for making intricate cavities and contours which would be difficult to produce with normal
machine. At the present time EDM is a widespread technique used in industry for high – precision machining of
all type of conductive materials such as: metallic alloys, graphite, or even some ceramic materials of whatsoever
hardness. Regression analysis is a stabilized relationship between variables. Usually, the investigator seeks to
ascertain the causal effect of one variable upon another variable [2].
Petropoulos et al. [3] used statistical multi – parameter analysis to model surface finish in EDM
process. Multiple statistical regression models were developed and closed correlation was observed between
surface roughness and EDM input variables. Modelling of die-sinking EDM process for MRR, EWR and SR
was carried out by puertas et al. [4] using a factorial design of experiments and multiple regression analysis.
Significant variable were identified for each of the responses. Palanikumar [5] in his research using surface
responses methodologymodelled the surface roughness in machining of Glass Fibber reinforced plastic
composite materials. He employed four factors five levels central composite, rotatable design matrix for
experimental investigation and used ANOVA for validation of the model. Kanagarajan et al. [6] applied
response surface methodology along with multiple linear regression analysis to obtain second order response
equations for MRR and Ra in EDM machining WC/30%Co composite. The most influential parameters aiming
at maximizing MRR and minimizing surface roughness were identified by carefully examining surface and
contour plots of the response versus different combination of inputs parameters. S Gopalakannan et al. [7]they
are applied central composite design and analysis of variance to investigate the influence of process parameters
and their interaction on material removal rate, electrode wear rate and surface roughness and identified the
significant process parameters that affect the output characteristics.
In this work, the study is focused on the die-sinking EDM of high carbon high chromium steel with
electrodes of copper. Consequently, an analysis of the influence of process parameters such as pulse on time,
duty cycle, current, voltage gap and pressure over response variables such as material removal rate (MRR),
surface roughness and electrode wear rate (EWR) was performed. This was done using the techniques of surface
response methodology (CCD) for conducting series of experiment and analysis of variance (ANOVA) used for
analysis the data. The combined use of these techniques has allowed us to create the second- order models
which make it possible to explain the variability associated with each of the response variables studied.](https://image.slidesharecdn.com/c1071521-140906044536-phpapp02/85/C1071521-1-320.jpg)
![International Journal of Engineering Research and Development
e-ISSN: 2278-067X, p-ISSN: 2278-800X, www.ijerd.com
Volume 10, Issue 7 (July 2014), PP.15-21
Performance measurement of EDM parameters on high carbon-chromium
15
steel
Dhruv kant Rahi¹, Manish Vishwakarma2
1M.Tech,MED,MANIT Bhopal(INDIA)
2Asst.Professor, MED,,M.A.N.I.T.Bhopal(INDIA)
Abstract:- Electrical discharge machining (EDM) is an advance machining process primarily used for hard
metals which are not possible to machine. In die Sinking EDM process, two metal parts are submerged in an
insulating liquid and areconnected to a source of current which is switched on and off automatically. Parametric
analysis has been done by conducting a set of experiments on high carbon-chromium steel with copper and
graphite as electrodes and high carbon oil as the dielectric medium. This study focuses on the influence of
process parameter such as pulse on time, duty cycle, current, voltage gap and pressure on EDM and effect of
this process parameter on MRR, EWR and surface roughness has been studied.CCD was used for conducting
the experiment and developing empirical models for MRR, surface roughness and EWR with the help of
Minitab software.
Key terms:- CCD, ANOVA analysis and Material removal rate, Surface Roughness
I. INTRODUCTION
Electrical discharge machining is an advance machining process primarily used for hard and difficult
metals which are difficult to machine with traditional techniques. Only electrical conducting materials are
machined by this process. Material is removed from the work piece by a series of rapidly recurring current
discharge between two electrodes, separated by a dielectric fluid and subject to an electric voltage [1]. The EDM
process is best suited for making intricate cavities and contours which would be difficult to produce with normal
machine. At the present time EDM is a widespread technique used in industry for high – precision machining of
all type of conductive materials such as: metallic alloys, graphite, or even some ceramic materials of whatsoever
hardness. Regression analysis is a stabilized relationship between variables. Usually, the investigator seeks to
ascertain the causal effect of one variable upon another variable [2].
Petropoulos et al. [3] used statistical multi – parameter analysis to model surface finish in EDM
process. Multiple statistical regression models were developed and closed correlation was observed between
surface roughness and EDM input variables. Modelling of die-sinking EDM process for MRR, EWR and SR
was carried out by puertas et al. [4] using a factorial design of experiments and multiple regression analysis.
Significant variable were identified for each of the responses. Palanikumar [5] in his research using surface
responses methodologymodelled the surface roughness in machining of Glass Fibber reinforced plastic
composite materials. He employed four factors five levels central composite, rotatable design matrix for
experimental investigation and used ANOVA for validation of the model. Kanagarajan et al. [6] applied
response surface methodology along with multiple linear regression analysis to obtain second order response
equations for MRR and Ra in EDM machining WC/30%Co composite. The most influential parameters aiming
at maximizing MRR and minimizing surface roughness were identified by carefully examining surface and
contour plots of the response versus different combination of inputs parameters. S Gopalakannan et al. [7]they
are applied central composite design and analysis of variance to investigate the influence of process parameters
and their interaction on material removal rate, electrode wear rate and surface roughness and identified the
significant process parameters that affect the output characteristics.
In this work, the study is focused on the die-sinking EDM of high carbon high chromium steel with
electrodes of copper. Consequently, an analysis of the influence of process parameters such as pulse on time,
duty cycle, current, voltage gap and pressure over response variables such as material removal rate (MRR),
surface roughness and electrode wear rate (EWR) was performed. This was done using the techniques of surface
response methodology (CCD) for conducting series of experiment and analysis of variance (ANOVA) used for
analysis the data. The combined use of these techniques has allowed us to create the second- order models
which make it possible to explain the variability associated with each of the response variables studied.](https://image.slidesharecdn.com/c1071521-140906044536-phpapp02/75/C1071521-1-2048.jpg)
![Performance measurement of EDM parameters on high carbon-chromium steel
Table – 1 chemical composition of high carbon high chromium steel (%)[8]
C Mn Si Co Cr Mo V P Ni Cu S
1.4-1.6 0.60 0.60 1.0 11.00-13.00 7.00-1.20 1.10 0.03 0.30 0.25 0.03
17
2.3 Process Parameters and Their Levels
Table – 2process parameters and their levels
Parameters (unit)
Notation
Levels /coded
-2 -1 0 1 2
Pulse on time (μs) Ton 100 825 1550 2275 300
Duty cycle (%) Dc 1 8.75 16.5 24.25 32
Current (amp.) Ip 5 16.25 27.5 38.75 50
Voltage gap (volt) Vg 10 37.5 65 92.5 120
Pressure (N) F 0.1 0.2 0.3 0.4 0.5
There are various process parameters to be considered, but in this work we have considered five
process parameters such as pulse on time, duty cycle, current, voltage gap and pressure. The material removal
rate (MRR), surface roughness and electrode wear rate (EWR) selected as response variables.
Material removal rate is the volume of material removed from the work piece in one minute.
vo lume of material removed from work piece
MRR =
time of machining
Mm³/min..................................... [9]
EWR is the ratio of the difference of weight of the total before and after machining to the machining time.
EWR =
푊푡푎 − 푊푡푏
푡
푚푚3
푚푖푛
… … … … … … … … … … … … … … … … … … … … … … … … [10]
Where,
wta = weight of the tool before machining
wtb = weight of the tool after machining
t = machining time
1.4 METHODOLOGY
Design of experiment: experiments were designed by using Minitab software. Response surface
methodology was used as a tool for development of a prediction model of MRR and surface roughness.
RESPONSE SURFACE METHODOLOGY:
RSM was developed to model experimental responses and then migrated into the modelling of
numerical experiments [9]. The difference is in the type of error generated by the response. The application of
RSM to design optimization is aimed at reducing the cost of expensive analysis methods and their associated
numerical noise. Central composite design is generally used for fitting a second – order response surface model.
CCD contains an imbedded factorial or fractional factorial design with central points that is augmented with a
group of “star points” that a low estimation of curvature. Any central composite design can be built up from an
initial 2k or 2k-p design by adding axial points and centre points to the two level designs (Ref 9).](https://image.slidesharecdn.com/c1071521-140906044536-phpapp02/85/C1071521-3-320.jpg)
![Performance measurement of EDM parameters on high carbon-chromium steel
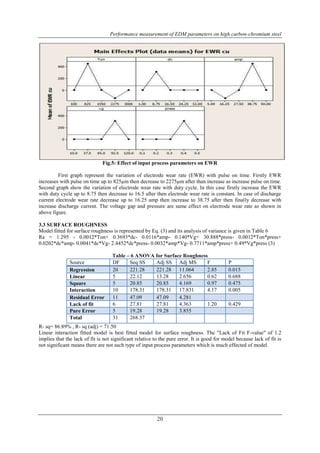
Fig.6: Effect of input process parameters on surface roughness
Fig. 6 Represent the effect of input process parameters on surface roughness.Surface roughness remains almost
same with the change in pulse on time. In case of duty cycle surface roughness increase up to 8075μm then
finally decrease. Surface roughness slightly increases with discharge current up to 16.25amp then decrease to
38.75amp after then increase the surface roughness. voltage gap does not much effective from 10-92.5 volt on
surface roughness bur after that surface roughness decrease with voltage gap. Last graph represent variation of
surface roughness with respect to pressure in the above mention figure.
IV. CONCLUSION
In the present work parametric analysis of die- sinking EDM process has been done based on
experimental results. Experiments based on the central composite design were conducted to develop empirical
models of the process.
Influence of input current and duty cycle is prominent over other machining parameters such as
pressure, voltage gap on material removal rate with copper electrode. Pulse on time and duty cycle is most
significant in the case of electrode wear rate with copper electrode. Duty cycle and pressure are mostsignificant
factor in the case of surface roughness over others operating parameters like pulse on time, voltage gap and
discharge current.
REFERENCES
[1]. Dr.Pradeepkumar, Dr. A.K. Sharma, IIT Roorkee: NPTEL, EDM process Alan O.sykes, Chicago
Working Paper in Law & Economics, An introduction to regression analysis, the inaugural coase
lecture, Petropoulos, N.M. Vaxevanidisand C. Pandazaras, modelling of surface finish in electro-discharge
machining based upon statistical multi-parameter analysis, J. Mater,process, technol,2004,
21
155-156, P 1247-1251.
[2]. I. Puertas, C.J. Luis and L. Alvarez, Analysis of the influence of EDM parameters on surface quality,
MRR and EW of WC-Co, J. Mater process, technol,2004, 153-154, P 1026-1032 palanikumar, K.,
2007. Modelling and analysis for surface roughness in machining glass fibre reinforced plastics using
response surface methodology. Mater des., 28: 2611-2618.
[3]. kanagarajan, D. Karthikeyan, R. Ppalanikumar, K. Sivaraj, 2009, influence of process parameters on
electric discharge machining of WC/30%Co composite, proc.IMechE, Part B: J.engineering
manufacture,222,PP,807-815.
[4]. S Gopalakannan,Tsenthilvelan,S Ranganathan,2012,modelling and optimization of EDM process
parameters on machining of Al 7075-B4C MMc using RSM, procedia engineering 38 (2012) 685- 690
Azom.com, 2014, D2 Tool Steel - High-Carbon, High-Chromium, Cold-Work Steel (UNS T30402),
(accessed 2014-6-7)
[5]. AkmAsifIqbal and Ahsan Ali Khan, Modelling and analysis of MRR, EWR, and surface Roughness in
EDM milling through response surface methodology, journal of engineering and applied science 154-
162 2010
[6]. S. Gopalakannan, T. Senthilvelan, application of response surface method on machining of Al-SiC
nano – composites, sciversesciencedirect measurement 46(2013) 2705-2715
[7]. Myers, R. H. and D. C. Montgomery. Response surface methodology: process and product
optimization using designed experiments, Second edition (2002) Wiley,New York](https://image.slidesharecdn.com/c1071521-140906044536-phpapp02/85/C1071521-7-320.jpg)

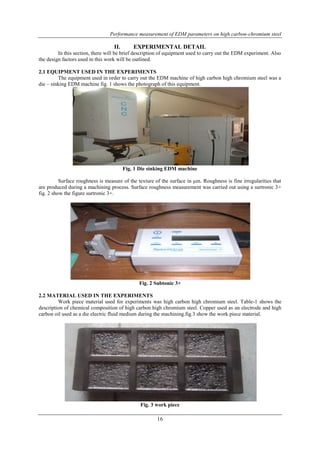
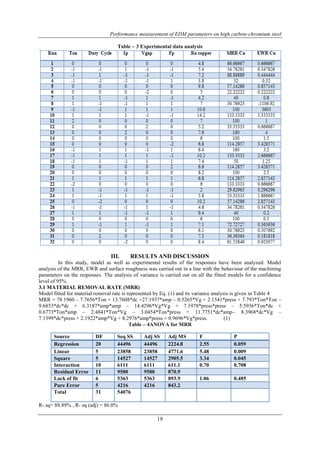
The document discusses a study on the effect of electrical discharge machining (EDM) parameters on high carbon-chromium steel. Central composite design was used to conduct experiments varying pulse on time, duty cycle, current, voltage gap, and pressure. Response variables of material removal rate, electrode wear rate, and surface roughness were analyzed. For material removal rate, the linear model best fit the data. Interaction effects best modeled electrode wear rate, with some parameters having high impact. The interaction model also best fit surface roughness data. Overall, the study used statistical methods to develop models relating EDM parameters to response variables for high carbon-chromium steel EDM.