Download to read offline
![IJRET: International Journal of Research in Engineering and Technology eISSN: 2319-1163 | pISSN: 2321-7308
_______________________________________________________________________________________
Volume: 04 Issue: 09 | September-2015, Available @ http://www.ijret.org 131
MODELING OF WEDM PROCESS FOR COMPLEX SHAPE USING
MULTILAYER PERCEPTRON AND RESPONSE SURFACE
METHODOLOGY
V. L. Bhambere1
, S. S. Khandare2
1
Research Scholar, BDCOE Sevagram, Wardha, M.S. India,
vijaylbhambere@gmail.com,+918308751751
2
Ex. princIpal, B.D.C.O.E Sewagram, Wardha, M.S. India,
shashikhan_ngp@hotmail.com
Abstract
Wire cut electric discharge machining is the present days requirement in manufacturing the intricate and complex shape parts as
required in the modern industrial products. The process being complex in nature for control over the machining process
parameters. In the present study Multilayer perceptron (MLP) model is developed to predict the Material removal rate. The
mathematical regression model is also developed by using Response Surface Methodology (RSM) to establish the relationshIp
between the MRR and input process parameters like pulse on time (Ton), Pulse off time (Toff), Peak current (IP) and Servo voltage
(SV). The predicted value by using MLP and RSM were compared with the experimental values. The average percentage errors
are found to be 1.29 and -0.36527 for MLP and RSM respectively. It is observed that the predicted values with RSM are closer to
experimental values as compared to MLP model.
Key Words: WEDM, Response Surface Methodology, Neural Network, Multi Layer Perception, Material Removal
Rate, Surface Roughness
--------------------------------------------------------------------***----------------------------------------------------------------------
1. INTRODUCTION
Wire electric discharge machining (WEDM) process has
created revolution in manufacturing industry. As
machining of hard and composite materials, super alloys
becomes easier to cut intricate shapes and complex
profiles. Producing the parts of high quality at high
production rate efficiency by optimizing the machining
conditions is the prime objective of WEDM. Optimal
machining conditions can be obtained by carrying out the
analysis of the input variables, response variables and
interaction between them. The most Significant
performance parameters in WEDM are cutting rate,
workpiece surface roughness, dimensional deviation and
kerf. Machining parameters includes pulse on, pulse off,
peak current, servo voltage, wire tension, water pressure
and wire speed. During the research work on WEDM
machine many researchers have focused on various aspects
related to WEDM which includes state of the art in wire
electric discharge machines, optimization of process
parameters on machining different workpiece materials
including different types of alloys of materials, composites
and many more newly investigated tougher materials
required in aerospace industries, tools and die making
industries etc. some have concentrated on wire breakage
phenomenon during the machining process and its effects
on obtainable surface finish and various methods to
overcome it. As well some have suggested the selection of
optimum process parameters on machine setting to get the
desired surface finish on machining. Puri A. B., et al. [8] in
this paper an analytical approach in the solution of the
wire-tool equation by considering multIple spark
discharges to investigate wire vibration effects in WEDM.
Portillo E., et al.[4] developed recurrent neural network
model to diagnose degraded cutting regimes in Wire
Electrical Discharge Machining process, which helps to
detect the degradation of the cutting process which results
in breakage of the wire electrode tool, productivity of the
process and accuracy required. In 2010 Reddy V. B., et al.
[9] developed to predict WEDM for chromium –
molybdenum –vanedium alloyed special steel an artificial
neural network model. The steel being used in automobile
industry. Similarly in 2014 Varun A., et al.[10]]
proposed to couple grey relational analysis (GRA) and
genetic algorithm (GA) for optimizing they conducted the
experiments with EN 353 work material for studying
various process parameters effects on the
response parameter. Spedding, T.A. and wang Z.Q. [1]
described the parametric combinationwith the use of
artificial neural network and they also characterised the
surface roughness and waviness along with cutting speed.
Trang Y. S. et al.[2] developed a neural network model to
determine pulse duration, time, open circuit voltage, peak
current, electric capacitance and wire speed servo reference
voltage for the estimation of cutting speed and surface.
Ramakrishnana R. and Karunamoorthyb L[3] developed
artificial neural network model with Taguchi parameter
design for modeling of CNC WEDM process. Caydas et al.](https://image.slidesharecdn.com/modelingofwedmprocessforcomplexshapeusingmultilayerperceptronandresponsesurfacemethodology-160916071052/85/Modeling-of-wedm-process-for-complex-shape-using-multilayer-perceptron-and-response-surface-methodology-1-320.jpg)
![IJRET: International Journal of Research in Engineering and Technology eISSN: 2319-1163 | pISSN: 2321-7308
_______________________________________________________________________________________
Volume: 04 Issue: 09 | September-2015, Available @ http://www.ijret.org 131
MODELING OF WEDM PROCESS FOR COMPLEX SHAPE USING
MULTILAYER PERCEPTRON AND RESPONSE SURFACE
METHODOLOGY
V. L. Bhambere1
, S. S. Khandare2
1
Research Scholar, BDCOE Sevagram, Wardha, M.S. India,
vijaylbhambere@gmail.com,+918308751751
2
Ex. princIpal, B.D.C.O.E Sewagram, Wardha, M.S. India,
shashikhan_ngp@hotmail.com
Abstract
Wire cut electric discharge machining is the present days requirement in manufacturing the intricate and complex shape parts as
required in the modern industrial products. The process being complex in nature for control over the machining process
parameters. In the present study Multilayer perceptron (MLP) model is developed to predict the Material removal rate. The
mathematical regression model is also developed by using Response Surface Methodology (RSM) to establish the relationshIp
between the MRR and input process parameters like pulse on time (Ton), Pulse off time (Toff), Peak current (IP) and Servo voltage
(SV). The predicted value by using MLP and RSM were compared with the experimental values. The average percentage errors
are found to be 1.29 and -0.36527 for MLP and RSM respectively. It is observed that the predicted values with RSM are closer to
experimental values as compared to MLP model.
Key Words: WEDM, Response Surface Methodology, Neural Network, Multi Layer Perception, Material Removal
Rate, Surface Roughness
--------------------------------------------------------------------***----------------------------------------------------------------------
1. INTRODUCTION
Wire electric discharge machining (WEDM) process has
created revolution in manufacturing industry. As
machining of hard and composite materials, super alloys
becomes easier to cut intricate shapes and complex
profiles. Producing the parts of high quality at high
production rate efficiency by optimizing the machining
conditions is the prime objective of WEDM. Optimal
machining conditions can be obtained by carrying out the
analysis of the input variables, response variables and
interaction between them. The most Significant
performance parameters in WEDM are cutting rate,
workpiece surface roughness, dimensional deviation and
kerf. Machining parameters includes pulse on, pulse off,
peak current, servo voltage, wire tension, water pressure
and wire speed. During the research work on WEDM
machine many researchers have focused on various aspects
related to WEDM which includes state of the art in wire
electric discharge machines, optimization of process
parameters on machining different workpiece materials
including different types of alloys of materials, composites
and many more newly investigated tougher materials
required in aerospace industries, tools and die making
industries etc. some have concentrated on wire breakage
phenomenon during the machining process and its effects
on obtainable surface finish and various methods to
overcome it. As well some have suggested the selection of
optimum process parameters on machine setting to get the
desired surface finish on machining. Puri A. B., et al. [8] in
this paper an analytical approach in the solution of the
wire-tool equation by considering multIple spark
discharges to investigate wire vibration effects in WEDM.
Portillo E., et al.[4] developed recurrent neural network
model to diagnose degraded cutting regimes in Wire
Electrical Discharge Machining process, which helps to
detect the degradation of the cutting process which results
in breakage of the wire electrode tool, productivity of the
process and accuracy required. In 2010 Reddy V. B., et al.
[9] developed to predict WEDM for chromium –
molybdenum –vanedium alloyed special steel an artificial
neural network model. The steel being used in automobile
industry. Similarly in 2014 Varun A., et al.[10]]
proposed to couple grey relational analysis (GRA) and
genetic algorithm (GA) for optimizing they conducted the
experiments with EN 353 work material for studying
various process parameters effects on the
response parameter. Spedding, T.A. and wang Z.Q. [1]
described the parametric combinationwith the use of
artificial neural network and they also characterised the
surface roughness and waviness along with cutting speed.
Trang Y. S. et al.[2] developed a neural network model to
determine pulse duration, time, open circuit voltage, peak
current, electric capacitance and wire speed servo reference
voltage for the estimation of cutting speed and surface.
Ramakrishnana R. and Karunamoorthyb L[3] developed
artificial neural network model with Taguchi parameter
design for modeling of CNC WEDM process. Caydas et al.](https://image.slidesharecdn.com/modelingofwedmprocessforcomplexshapeusingmultilayerperceptronandresponsesurfacemethodology-160916071052/75/Modeling-of-wedm-process-for-complex-shape-using-multilayer-perceptron-and-response-surface-methodology-1-2048.jpg)
![IJRET: International Journal of Research in Engineering and Technology eISSN: 2319-1163 | pISSN: 2321-7308
_______________________________________________________________________________________
Volume: 04 Issue: 09 | September-2015, Available @ http://www.ijret.org 132
[12] proposed adaptive neuro-fuzzy inference system
(ANFIS) model for the prediction of the white layer
thickness (WLT) and the average surface roughness
obtained as a function of the process parameters. Tomura
Shunsuke, et al.[11] clarify the mechanism that how
electromagnetic force is applied to the wire electrode in
wire electrical discharge machining (wire-EDM) is being
generated Poros Dariusz, et al.[7] experimentally
investigated the efficiency of wire electrical discharge
machining of difficult-to-machine materials with Uncoated
brass wire, 0.25mm diameter, brass CuZn20 coated brass
CuZn50 wire and zinc oxide coated brass wire were
utilized in the experimentation. Okada A., et al.[6]
proposed high-speed observation system for fine wire
EDM process. Nithin Aravind S. R., et.al [5] attempted to
determine the important machining parameters of brass
material for the performance measures like Material
removal rate and Surface roughness separately in WEDM
process.
The objective of this paper is to develop the neural network
and mathematical regression model to predict the surface
roughness for the given set of input conditions. The
Artificial neural network model is designed with the help
MLP to predict material removal rate. Experiments are
carried out on High carbon High Chromium tool steel
(HCHCR). The predicted values with ANN model and the
regression model are also compared with the experimental
values.
2. MATERIAL
The material used in this experiment is High carbon High
Chromium tool steel (HCHCR) having size 220mm Χ
220mm Χ40mm. The chemical composition of the HCHCR
workpiece material is given in table 1.
Table 1: Chemical Composition of the HCHCR Material
Constituent C Si Mn P S Cr Ni Mo Al Cu V Nb Ti
%
Composition
2.012 0.184 0.290 0.021 0.021 11.337 0.097 0.048 <0.001 0.036 0.051 0.004 0.001
3. EXPERIMENTAL PROCEDURE
The experiments were conducted on Electronica Sprintcut
734 DLX model. The Brass wire with 0.25mm diameter is
used in the experiment. Four input factors like pulse on
(Ton), pulse off (Toff), peak current (IP) and servo voltage
(SV) were selected as a control variable and the effects of
these input parameters are studied on Material Removal
Rate (MRR). The various input parameter values and their
level are given in Table 2. The thirty number of experiments
were conducted according to Central Composite Rotatable
Design of experiments (CCD). The prime objective of
employing the CCD is to reduce the number of experiments
to be performed. Four process parameters are examined at
three levels as presented in table 2. Program was developed
for the complex shape punch having hexagon on top face
and circle at bottom face by using Auto CAD Software. The
top view of machined 30 punches is shown in figure 1.
Minitab 14 software has been used for the design of
experiments. The experimental results obtained with CCD
experiments is shown in table 3. The MRR (grams per min)
is calculated as:
𝑀𝑅𝑅 =
(𝑊 𝑖− 𝑊 𝑓)
𝑡
(1)
Where,
Wi = Initial weight of work piece material
(gms)
Wf = Final weight of work piece material
(gms)
t = Time period of each trial in minutes
Figure 1: Top view for machined punches
Table 2: Process parameters, symbols, levels and their
ranges
Process
Parameters
Symbols Units
Range
(Machine
Units)
Levels
-1 0 1
Pulse On
time
Ton µs 120-130 120 125 130
Pulse Off
Time
Toff µs 40-58 40 49 58
Peak
Current
IP Amp 180-230 180 210 230
Servo
Voltage
SV V 7-20 7 13 20
4. RESPONSE SURFACE METHODOLOGY
RSM is useful for the modeling and analysis of experiments
in which a response of interest is influenced by several
variables and the objective is to optimize that response. The
initial requirement of RSM for achieving the accurate and
reliable measurements of response variables is design of
experiments. For modeling the input output parameters we](https://image.slidesharecdn.com/modelingofwedmprocessforcomplexshapeusingmultilayerperceptronandresponsesurfacemethodology-160916071052/85/Modeling-of-wedm-process-for-complex-shape-using-multilayer-perceptron-and-response-surface-methodology-2-320.jpg)
![IJRET: International Journal of Research in Engineering and Technology eISSN: 2319-1163 | pISSN: 2321-7308
_______________________________________________________________________________________
Volume: 04 Issue: 09 | September-2015, Available @ http://www.ijret.org 134
Table 4: Comparison between MRR values by Experiment,
RSM and ANN
Actual
MRR(HCHCR)
Predicted
MRR ANN
Output
Predicted
MRR RSM
ANN
(MLP)
%Error
RSM %
Error
0.048115 0.04817 0.04901 -0.11229 -1.87091
0.047317 0.04742 0.04619 -0.22039 2.38712
0.045 0.04520 0.04557 -0.43980 -1.25732
0.0412 0.04450 0.04518 -7.99922 -9.66786
0.026776 0.02674 0.02755 0.13492 -2.90350
0.01837 0.01815 0.01713 1.19099 6.75500
0.036741 0.03656 0.03644 0.48224 0.81627
0.0496 0.04450 0.04518 10.29097 8.90492
0.031315 0.03129 0.03204 0.08175 -2.30484
0.058193 0.05853 0.05831 -0.57397 -0.19571
0.061823 0.06094 0.06137 1.42618 0.73378
0.0425 0.04450 0.04518 -4.69572 -6.31332
0.0314 0.03140 0.03233 0.01559 -2.96850
0.044505 0.04456 0.04553 -0.11485 -2.30948
0.038303 0.03819 0.03773 0.30336 1.49541
0.04555 0.04450 0.04518 2.31541 0.80613
0.0165 0.01708 0.01802 -3.54145 -9.20179
0.0416 0.04147 0.04142 0.32418 0.43541
0.042 0.04205 0.04093 -0.11615 2.55768
0.027817 0.02765 0.02716 0.61060 2.36683
0.030878 0.03125 0.03014 -1.20732 2.40381
0.04555 0.04450 0.04518 2.31541 0.80613
0.0431 0.04450 0.04518 -3.23824 -4.83332
0.047126 0.04757 0.04710 -0.93603 0.06291
0.049812 0.04752 0.05027 4.59677 -0.92607
0.045 0.05004 0.04517 -11.20639 -0.38001
0.043882 0.03507 0.04418 20.07696 -0.68792
0.036582 0.03341 0.03621 8.66567 1.01586
0.053825 0.04823 0.05312 10.38640 1.30377
0.042897 0.03870 0.04203 9.77729 2.01097
Average % Error 1.28643 -0.36529
Figure 2: Comparison between MRR (HCHCR) values by
Experiment, RSM and ANN
5. RESULT AND CONCLUSION:
This paper presents the modeling of WEDM process for the
complex shape. Two models were developed for predicting
the material removal rate for manufacturing the complex
shape punches. We have used response surface methodology
for developing mathematical regression equation. The
Artificial Neural Network with MLP was aslo designed for
predicting the MRR. The values predicted by RSM and
ANN model are compared with experimental values and the
average percentage error is also calculated. IT is observed
that values predicted with both the models are
approximately same as the experimental values. the average
percentage error is 1.28643% and -0.36829% for ANN and
RSM model respectively.
REFERENCES
[1]. Spedding T. A. & Wang Z. Q. (1997),
Parametricoptimization and suface characterization of
wire electrical discharge machining process. Précis.
Eng. Vol. 20, pp. 5-15.
[2]. Tarng Y. S., Ma S. C. & Chung L. K. (1995),
Determination of optimal cutting parameters in wire
electrical discharge machining. International journal of
Machine Tools Manufacture. Vol. 35, pp. 1693-1701.
[3]. Ramakrishnana R. & Karunamoorthyb L. (2008),
Modeling and multi response optimization of inconel
718 on machining of CNC WEDM process. Journal of
Materials processing Technology, Vol. 207, pp. 343-
349.
[4]. Portillo E., Marcos M., Cabanes I., Zubizarreta A.,
Sanchez J.A. (2008), “Artificial Neural Networks for
Detecting Instability Trends in Different Workpiece
Thicknesses in a Machining Process”, 2008 American
Control Conference Westin Seattle Hotel, Seattle,
Washington, USA June 11-13.
[5]. Nithin Aravind S. R., Sowmyi S., Yuvara K. P. (2012),
“Optimization of Metal Removal Rate And Surface
Roughness on Wire Edm Using Taguchi Method”,
IEEE-International Conference On Advances In
Engineering, Science And Management (ICAESM -
2012) March 30, 31, 2012.
[6]. Okada A., Uno Y., Nakazawa M., Yamauchi T. (2010),
“Evaluations of spark distribution and wire vibration in
wire EDM by high-speed Observation”, CIRP Annals -
Manufacturing Technology 59, 231–234.
[7]. Poros Dariusz, Zaborski Stanisław (2009), “Semi-
empirical model of efficiency of wire electrical
discharge machining of hard-to-machine materials”,
journal of materials processing technology 209, 1247–
1253.
[8]. Puri A. B., Bhattacharyya B. (2003), “An analysis and
optimisation of the geometrical inaccuracy due to wire
lag phenomenon in WEDM”, International Journal of
Machine Tools & Manufacture 43, 151–159.
[9]. Reddy Vijaya Bhaskara., Vikaram kumar C. H. R.,
Reddy Hemachandra.K (2010), “Modeling Of Wire
EDM Process Using Back Propagation (BPN) and
General Regression Neural Networks (GRNN)”, IEEE
2010
0
0.01
0.02
0.03
0.04
0.05
0.06
0.07
1 6 11 16 21 26
MRR
Experiment NO.
Actual MRR
Predicted
MRR ANN
Output
Predicted
MRR RSM](https://image.slidesharecdn.com/modelingofwedmprocessforcomplexshapeusingmultilayerperceptronandresponsesurfacemethodology-160916071052/85/Modeling-of-wedm-process-for-complex-shape-using-multilayer-perceptron-and-response-surface-methodology-4-320.jpg)
![IJRET: International Journal of Research in Engineering and Technology eISSN: 2319-1163 | pISSN: 2321-7308
_______________________________________________________________________________________
Volume: 04 Issue: 09 | September-2015, Available @ http://www.ijret.org 135
[10]. Varun A., Venkaiah Nasina (2015), “Simultaneous
optimization of WEDM responses using grey relational
analysis coupled with genetic algorithm while
machining EN 353”, International Journal of Advance
Manufacturing Technology, 76:675-690.
[11]. Tomura Shunsuke, Kunieda Masanori (2009),
“Analysis of electromagnetic force in wire-EDM”,
Precision Engineering 33, 255–262.
[12]. Caydas Ulas, Hascalık Ahmet, Ekici Sami (2009), “An
adaptive neuro-fuzzy inference system (ANFIS) model
for wire-EDM”, Expert Systems with Applications 36,
6135–6139.](https://image.slidesharecdn.com/modelingofwedmprocessforcomplexshapeusingmultilayerperceptronandresponsesurfacemethodology-160916071052/85/Modeling-of-wedm-process-for-complex-shape-using-multilayer-perceptron-and-response-surface-methodology-5-320.jpg)

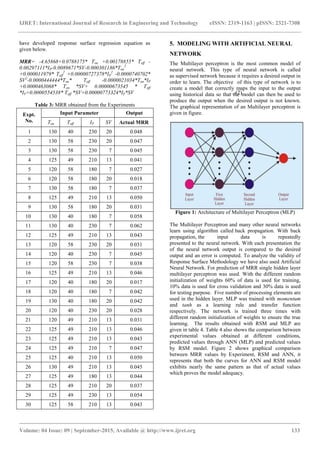
The document discusses a study on Wire Electric Discharge Machining (WEDM) using Multilayer Perceptron (MLP) and Response Surface Methodology (RSM) to model the material removal rate (MRR). It presents the development of both neural network and regression models based on input parameters and their effects on MRR, with experimental comparisons showing that RSM predictions are closer to actual values than MLP. The research highlights the importance of optimizing machining conditions for better manufacturing efficiency in the industry.