Downloaded 52 times
![• Particle update
– In CPSO, each particle is updated according to the following equations:
old
v new w vid
id
new
xid
old
xid
c1 r1
pbestid
old
xid
c2 r2
gbestd
old
xid
new
vid
• where w is the inertia weight that controls the impact of the previous velocity of a
particle.
• c1 and c2 are acceleration constants that control the distance a particle moves at each
generation.
• r1 and r2 are two random numbers between [0, 1].
old
new
• v id and v id represent the velocity of the new and old particles, respectively.
• Particles x old and x new denote the position of the current particle and the updated
id
id
particle, respectively.
10/21
Bioinformatics Lab.](https://image.slidesharecdn.com/random-140223100718-phpapp01/85/Feature-Selection-using-Complementary-Particle-Swarm-Optimization-for-DNA-Microarray-Data-10-320.jpg)
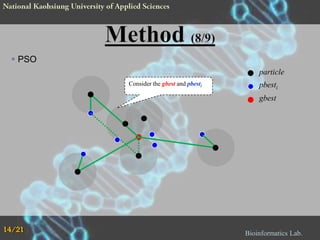
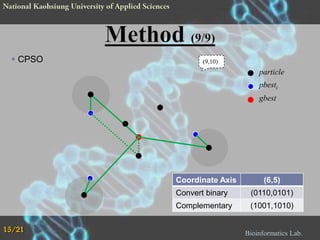
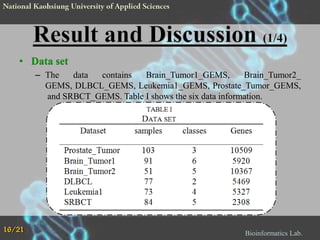
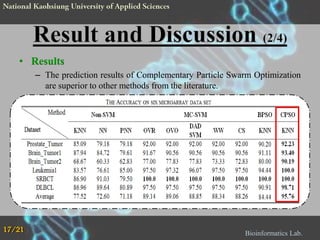

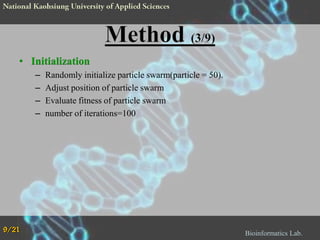
The document proposes a Complementary Particle Swarm Optimization (CPSO) method for feature selection in DNA microarray data. CPSO was designed to overcome limitations of standard PSO getting trapped in local optima. CPSO uses a complementary strategy to move particles to new search regions. It was tested on six microarray datasets and achieved lower classification errors than other methods. Future work will combine CPSO with K-Nearest Neighbors classification to potentially further improve performance.


![5G Explained! A High Level Overview [Introduction]](https://cdn.slidesharecdn.com/ss_thumbnails/5gexplainedahighleveloverview-260119165306-cc137a3e-thumbnail.jpg?width=640&height=640&fit=bounds)


