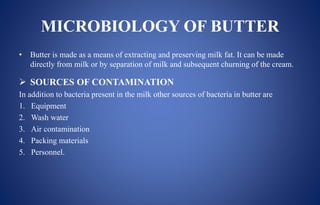
This document analyzes butter and describes its characteristics, composition, and production process. It discusses how butter is made from cream or milk, and defines butter as a fatty food containing at least 80% milk fat. The document outlines the steps to prepare butter samples, determine moisture, fat, curd, and salt content. It also discusses microbiological analysis of butter and how microorganisms are controlled. Sources of bacterial contamination during butter production are equipment, wash water, air, packaging, and personnel. Rancidity occurs when the enzyme lipase breaks down butter fat into fatty acids.
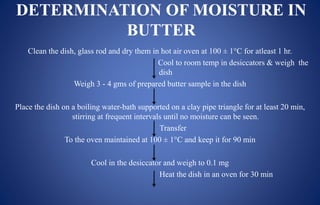
![PREPARATION OF SAMPLE OF
BUTTER
Warm the sample
Oven/water bath maintained at 37 ± 2°C
Shake
To obtain homogeneous fluid emulsion free from un softened pieces
[Note: In case, the sample does not mix up properly (water separation can be seen) reject the sample]
Heat (50 - 60°C)
Portion of emulsified butter in a beaker until the fat separates
Filter the fat layer into a dry vessel
Melt the filtered fat if necessary
Re-filter
To obtain clear fat free from water.](https://image.slidesharecdn.com/butteranalysis-210617064435/85/Butter-Analysis-5-320.jpg)
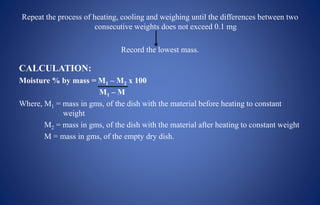
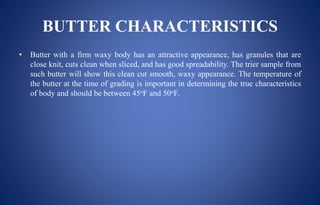
![Macerate the sediment twice with 20 to 25 ml of petroleum solvent. Decant again the fatty
solution into the filter paper.
Filter
Filtrate is collected in a clean, dried, tared 250 ml flat bottom flask containing 1 to 2 glass
beads.
With the aid of a wash-bottle containing petroleum solvent, wash all the fat and sediment
from the dish into the crucible or the filter paper.
Wash the crucible or the filter paper until free from fat, collecting all the filtrate in the conical
flask.
Preserve the filtrate for the determination of fat. Dry the crucible or filter paper in the oven
maintained at 100 ± 1°C for at least 30 min.
[Note: If fat is to be determined only, transfer all the filtrate to a pre-dried and weighed fat
flaks containing 2-3 glass beads. Rinse the conical flask with petroleum ether. Evaporate the
ether, first on the water-bath and then in the oven at 102 ± 2°C for 1 hour or till the time the
constant weight is obtained. Calculate the fat content form the residues obtained by using
the formula]](https://image.slidesharecdn.com/butteranalysis-210617064435/85/Butter-Analysis-9-320.jpg)
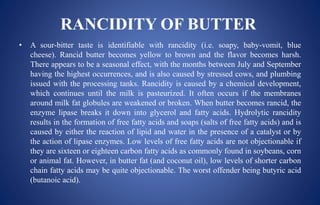
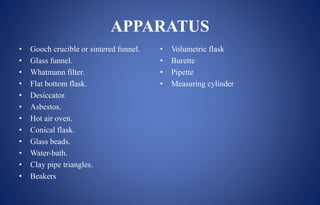
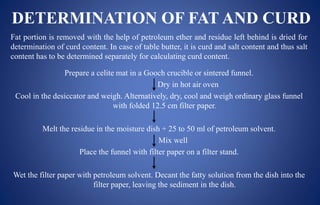
![DETERMINATION OF SALT CONTENT
IN BUTTER
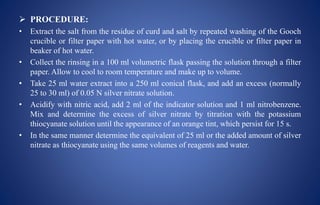
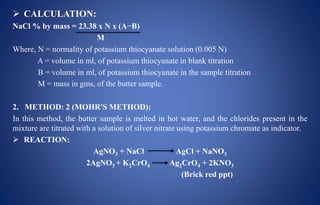
1. METHOD: 1 (VOLHARD'S METHOD):
In this method, salt present in the butter sample is extracted with hot water from the
dried fat-free residue obtained in moisture determination. The chlorides are precipitated
by adding excess of silver nitrate. The unused silver nitrate is titrated with potassium
thiocyanate using ferric ammonium sulphate indicator.
REACTION:
Ag+ (excess) + Cl- AgCl (solid)
Ag++ SCN- AgSCN (solid)
Fe+3 + SCN- [FeSCN]+2 (Reddish brown)](https://image.slidesharecdn.com/butteranalysis-210617064435/85/Butter-Analysis-11-320.jpg)