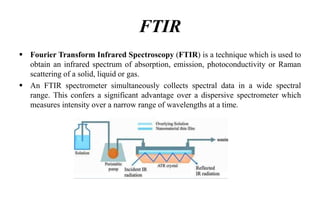
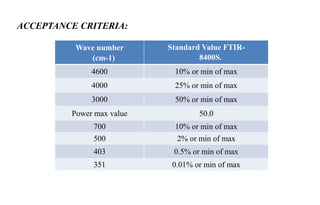
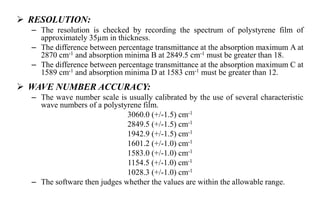
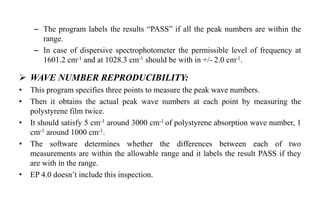
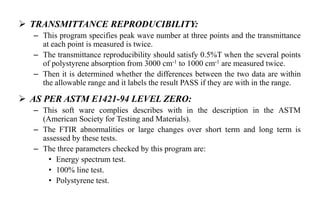
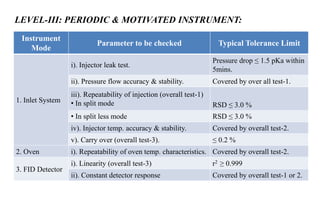
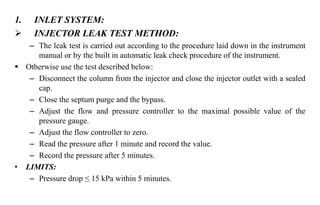
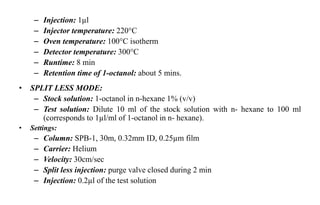
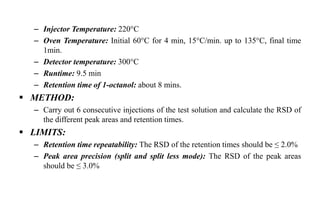
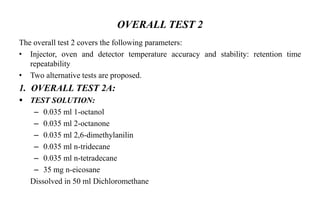
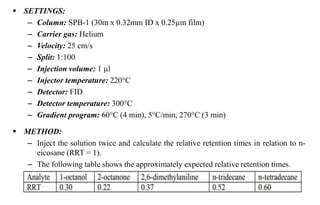
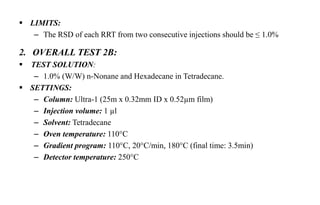
QUALIFICATION OF GC &
FTIR
Pharmaceutical Validation
Mehul H Jain
M. Pharmacy 1st Sem
Pharmaceutical Analysis
INTRODUCTION
 VALIDATION:
It is a act of demonstrating and documenting that the process operates
effectively and reproducibly to produce a product meeting its predetermined
specifications and quality attributes.
• The aim of validation is to show that the critical steps are under control and lead
continuously to the desirable quality.
 CALIBRATION:
Calibration is a comparison between measurements – one of known
magnitude or correctness made or set with one device and another measurement
made in as similar a way as possible with a second device.
 QUALIFICATION:
Qualification is an act or process to assure something complies with some
conditions, standard or specific requirements.
 Design Qualification:
Documented evidence which shows that the plant design agrees with the
design specifications of the customer.
 Installation Qualification:
Written evidence is given that all parts of equipment are installed according to
the equipment supplier’s and purchase specifications.
 Operational qualification:
Documented evidence which shows that all parts of the plant and equipment
work within their specifications and process parameters.
 Performance Qualification:
Provides documented evidence that all parts of a plant and other processes
produce products of specified quality under conditions of normal production for a
longer period of time.
FTIR
 Fourier Transform Infrared Spectroscopy (FTIR) is a technique which is used to
obtain an infrared spectrum of absorption, emission, photoconductivity or Raman
scattering of a solid, liquid or gas.
 An FTIR spectrometer simultaneously collects spectral data in a wide spectral
range. This confers a significant advantage over a dispersive spectrometer which
measures intensity over a narrow range of wavelengths at a time.
CALIBRATION
 WAVE NUMBER PRECISION:
– This is performed for substances with well known peak wave number(s)
position such as carbon dioxide, water vapor, polystyrene ,ammonia.
– Test is performed to know whether the exact peak wave numbers are shown at
that time of validation.
– Thus the result is obtained from the difference between the peak wave numbers
position for a substance with a well known peak wave numbers and the values
indicated by the system.
 0% TRANSMITTANCE:
– A sample which do not allow the transmission of light is measured in order to
investigate the 0% transmittance.
– This test thus can be used to find out error caused by stray light and secondary
emission spectra.
 100% TRANSMITTANCE:
– This is investigated by performing analysis with out a sample.
– By performing analysis with out the sample 100% transmittance can be
investigated.
 LINEARITY OF CURVE:
– A calibration curve for the % transmittance and the concentration is created and
the linearity of the inspected.
 REPRODUCIBILITY:
– A stable sample is measured twice with in a short period and confirmed whether
the variation in the measurement values such as wave numbers and
transmittance are obtained.
VALIDATION
• To perform FTIR validation and to confirm that it is operating properly, diverse IR
inspection was performed by measuring the spectra of polystyrene film.
INSTALLATION OF VALIDATION PROGRAM:
• Software validates the Shimadzu Fourier transform infrared spectrophotometer
IRPrestige-21/IRAffinity-1/FTIR-8000 series by the IR solution software to control
them and data processing.
• The program is automatically installed when the IR solution is installed, therefore the
Validation program does not need to be separately installed.
PERFORMANCE QUALIFICATION:
 POWER SPECTRUM:
– Power spectrum gives the plot of portion of signal's power(energy per unit time)
falling with in the given frequency bins.
– This test estimates the intensity of power spectrum at a specified wave numbers.
– When the measured intensity is equal to or larger than the criterion value, the test is
passed.
ACCEPTANCE CRITERIA:
Wave number
(cm-1)
Standard Value FTIR-
8400S.
4600 10% or min of max
4000 25% or min of max
3000 50% or min of max
Power max value 50.0
700 10% or min of max
500 2% or min of max
403 0.5% or min of max
351 0.01% or min of max
 RESOLUTION:
– The resolution is checked by recording the spectrum of polystyrene film of
approximately 35µm in thickness.
– The difference between percentage transmittance at the absorption maximum A at
2870 cm-1 and absorption minima B at 2849.5 cm-1 must be greater than 18.
– The difference between percentage transmittance at the absorption maximum C at
1589 cm-1 and absorption minima D at 1583 cm-1 must be greater than 12.
 WAVE NUMBER ACCURACY:
– The wave number scale is usually calibrated by the use of several characteristic
wave numbers of a polystyrene film.
3060.0 (+/-1.5) cm-1
2849.5 (+/-1.5) cm-1
1942.9 (+/-1.5) cm-1
1601.2 (+/-1.0) cm-1
1583.0 (+/-1.0) cm-1
1154.5 (+/-1.0) cm-1
1028.3 (+/-1.0) cm-1
– The software then judges whether the values are within the allowable range.
– The program labels the results “PASS” if all the peak numbers are within the
range.
– In case of dispersive spectrophotometer the permissible level of frequency at
1601.2 cm-1 and at 1028.3 cm-1 should be with in +/- 2.0 cm-1.
 WAVE NUMBER REPRODUCIBILITY:
• This program specifies three points to measure the peak wave numbers.
• Then it obtains the actual peak wave numbers at each point by measuring the
polystyrene film twice.
• It should satisfy 5 cm-1 around 3000 cm-1 of polystyrene absorption wave number, 1
cm-1 around 1000 cm-1.
• The software determines whether the differences between each of two
measurements are within the allowable range and it labels the result PASS if they
are with in the range.
• EP 4.0 doesn’t include this inspection.
 TRANSMITTANCE REPRODUCIBILITY:
– This program specifies peak wave number at three points and the transmittance
at each point is measured is twice.
– The transmittance reproducibility should satisfy 0.5%T when the several points
of polystyrene absorption from 3000 cm-1 to 1000 cm-1 are measured twice.
– Then it is determined whether the differences between the two data are within
the allowable range and it labels the result PASS if they are with in the range.
 AS PER ASTM E1421-94 LEVEL ZERO:
– This soft ware complies describes with in the description in the ASTM
(American Society for Testing and Materials).
– The FTIR abnormalities or large changes over short term and long term is
assessed by these tests.
– The three parameters checked by this program are:
• Energy spectrum test.
• 100% line test.
• Polystyrene test.
• ENERGY SPECTRUM TEST:
– Power spectra obtained in the inspection are compared with reference data and
the spectra are checked for changes over long periods.
• ONE HUNDRED PERCENT LINE TEST:
– 100% T line spectra are calculated for power spectra & are measured
continuously in inspection and the spectra are checked for changes over short
periods.
• POLYSTYRENE TEST:
– Evaluation is performed using differences between spectra obtained for
polystyrene film in inspection and the stored reference data.
– When the differences are within the standard, "pass” results.
– All of the above furnished data should be represented in Validation Report.
GAS CHROMATOGRAPHY
LEVEL-I : SELECTION OF INSTRUMENTS & SUPPLIERS:
– At level I of the qualification of a GC equipment (selection of instruments and
suppliers).
– It is recommended to select a manufacture of GC that can satisfy the needs of the
laboratory and works under ISO 9001 certification.
LEVEL-II OF EQUIPMENT QUALIFICATION:
 INSTALLATION & RELEASE FOR USE:
– It is recommended to check all requirements set during the selection of the
instrument, and calibration should be performed before putting into service by
an accredited external service supplier.
(or)
– Internally by appropriately qualified personnel, using certified reference buffers
according to an approved procedure.
LEVEL-III: PERIODIC & MOTIVATED INSTRUMENT:
Instrument
Mode
Parameter to be checked Typical Tolerance Limit
1. Inlet System
i). Injector leak test.
Pressure drop ≤ 1.5 pKa within
5mins.
ii). Pressure flow accuracy & stability. Covered by over all test-1.
iii). Repeatability of injection (overall test-1)
• In split mode RSD ≤ 3.0 %
• In split less mode RSD ≤ 3.0 %
iv). Injector temp. accuracy & stability. Covered by overall test-2.
v). Carry over (overall test-3). ≤ 0.2 %
2. Oven i). Repeatability of oven temp. characteristics. Covered by overall test-2.
3. FID Detector
i). Linearity (overall test-3) r2 ≥ 0.999
ii). Constant detector response Covered by overall test-1 or 2.
1. INLET SYSTEM:
 INJECTOR LEAK TEST METHOD:
– The leak test is carried out according to the procedure laid down in the instrument
manual or by the built in automatic leak check procedure of the instrument.
 Otherwise use the test described below:
– Disconnect the column from the injector and close the injector outlet with a sealed
cap.
– Close the septum purge and the bypass.
– Adjust the flow and pressure controller to the maximal possible value of the
pressure gauge.
– Adjust the flow controller to zero.
– Read the pressure after 1 minute and record the value.
– Record the pressure after 5 minutes.
• LIMITS:
– Pressure drop ≤ 15 kPa within 5 minutes.
 INLET PRESSURE FLOW ACCURACY AND STABILITY:
– A direct measurement of these parameters was not deemed practical or necessary,
but the optimal conditions of flow/pressure can be verified by the overall test 1.
• LIMITS:
– Refer to overall test 1.
 REPEATABILITY OF INJECTION:
– The verification of this parameter is covered by the overall test 1.
– This test is to be performed in both split and split less mode.
• LIMITS:
– Refer to overall test 1.
 INJECTOR TEMPERATURE ACCURACY AND STABILITY:
– Due to the fact that the temperature cannot be reliably measured without opening
and modifying the system and due to the difficulties of introducing a probe inside
this module, the verification of this parameter is considered to be covered by the
overall test 2.
• LIMITS:
– Refer to overall test 2.
 INJECTOR CARRY OVER:
– After having injected the solutions for the linearity test of the FID detector, in
increasing order, inject the blank and measure the peaks that correspond to the
major peaks (=analytes) in the linearity solutions.
– The verification of this parameter is covered by the overall test 3.
• LIMITS:
– Refer to overall test 3.
2. OVEN:
 REPEATABILITY OF OVEN TEMPERATURE CHARACTERISTICS:
– Due to the fact that the temperature cannot be reliably measured without opening
and modifying the system conditions and that even when introducing a probe inside
the oven, its location would not reflect the real temperature conditions at all points,
the verification of this parameter is covered by the overall tests 2A and 2B.
• LIMITS:
– Refer to overall test 2.
3. FID DETECTOR:
 FID DETECTOR LINEARITY:
– Increasing amounts of analyte are injected and a linear response should be
obtained.
– The verification of this parameter is covered by the overall test 3.
• LIMITS:
– Refer to overall test 3.
 CONSTANT FID DETECTOR RESPONSE:
– The proper and reproducible functioning of the FID can be demonstrated by
checking the peak areas obtained from a pre- defined standard solution.
– The verification of this parameter is covered by the overall test 1 or 2.
• LIMITS:
– Refer to overall test 1 or 2.
OVERALL TEST-1
The overall test 1 covers the following parameters:
• Pressure/flow accuracy and stability in the inlet system:
– Retention time repeatability
– Repeatability of injection: peak area precision
• In split mode
• In split less mode
The test may be combined with overall test 3.
• SPLIT MODE:
– Test solution: 1-octanol in n-hexane 1% (v/v).
• Settings:
– Column: SPB-1 (30m x 0.32mm ID x 0.25µm film)
– Carrier gas: Helium
– Velocity: 25cm/sec
– Split: 1:100
– Injection: 1µl
– Injector temperature: 220°C
– Oven temperature: 100°C isotherm
– Detector temperature: 300°C
– Runtime: 8 min
– Retention time of 1-octanol: about 5 mins.
• SPLIT LESS MODE:
– Stock solution: 1-octanol in n-hexane 1% (v/v)
– Test solution: Dilute 10 ml of the stock solution with n- hexane to 100 ml
(corresponds to 1µl/ml of 1-octanol in n- hexane).
• Settings:
– Column: SPB-1, 30m, 0.32mm ID, 0.25µm film
– Carrier: Helium
– Velocity: 30cm/sec
– Split less injection: purge valve closed during 2 min
– Injection: 0.2µl of the test solution
– Injector Temperature: 220°C
– Oven Temperature: Initial 60°C for 4 min, 15°C/min. up to 135°C, final time
1min.
– Detector temperature: 300°C
– Runtime: 9.5 min
– Retention time of 1-octanol: about 8 mins.
 METHOD:
– Carry out 6 consecutive injections of the test solution and calculate the RSD of
the different peak areas and retention times.
 LIMITS:
– Retention time repeatability: The RSD of the retention times should be ≤ 2.0%
– Peak area precision (split and split less mode): The RSD of the peak areas
should be ≤ 3.0%
OVERALL TEST 2
The overall test 2 covers the following parameters:
• Injector, oven and detector temperature accuracy and stability: retention time
repeatability
• Two alternative tests are proposed.
1. OVERALL TEST 2A:
 TEST SOLUTION:
– 0.035 ml 1-octanol
– 0.035 ml 2-octanone
– 0.035 ml 2,6-dimethylanilin
– 0.035 ml n-tridecane
– 0.035 ml n-tetradecane
– 35 mg n-eicosane
Dissolved in 50 ml Dichloromethane
 SETTINGS:
– Column: SPB-1 (30m x 0.32mm ID x 0.25µm film)
– Carrier gas: Helium
– Velocity: 25 cm/s
– Split: 1:100
– Injection volume: 1 µl
– Injector temperature: 220°C
– Detector: FID
– Detector temperature: 300°C
– Gradient program: 60°C (4 min), 5°C/min, 270°C (3 min)
 METHOD:
– Inject the solution twice and calculate the relative retention times in relation to n-
eicosane (RRT = 1).
– The following table shows the approximately expected relative retention times.
 LIMITS:
– The RSD of each RRT from two consecutive injections should be ≤ 1.0%
2. OVERALL TEST 2B:
 TEST SOLUTION:
– 1.0% (W/W) n-Nonane and Hexadecane in Tetradecane.
 SETTINGS:
– Column: Ultra-1 (25m x 0.32mm ID x 0.52µm film)
– Injection volume: 1 µl
– Solvent: Tetradecane
– Oven temperature: 110°C
– Gradient program: 110°C, 20°C/min, 180°C (final time: 3.5min)
– Detector temperature: 250°C

Qualification of GC & FTIR

  • 1.
    QUALIFICATION OF GC& FTIR Pharmaceutical Validation Mehul H Jain M. Pharmacy 1st Sem Pharmaceutical Analysis
  • 2.
    INTRODUCTION  VALIDATION: It isa act of demonstrating and documenting that the process operates effectively and reproducibly to produce a product meeting its predetermined specifications and quality attributes. • The aim of validation is to show that the critical steps are under control and lead continuously to the desirable quality.  CALIBRATION: Calibration is a comparison between measurements – one of known magnitude or correctness made or set with one device and another measurement made in as similar a way as possible with a second device.
  • 3.
     QUALIFICATION: Qualification isan act or process to assure something complies with some conditions, standard or specific requirements.
  • 4.
     Design Qualification: Documentedevidence which shows that the plant design agrees with the design specifications of the customer.  Installation Qualification: Written evidence is given that all parts of equipment are installed according to the equipment supplier’s and purchase specifications.  Operational qualification: Documented evidence which shows that all parts of the plant and equipment work within their specifications and process parameters.  Performance Qualification: Provides documented evidence that all parts of a plant and other processes produce products of specified quality under conditions of normal production for a longer period of time.
  • 5.
    FTIR  Fourier TransformInfrared Spectroscopy (FTIR) is a technique which is used to obtain an infrared spectrum of absorption, emission, photoconductivity or Raman scattering of a solid, liquid or gas.  An FTIR spectrometer simultaneously collects spectral data in a wide spectral range. This confers a significant advantage over a dispersive spectrometer which measures intensity over a narrow range of wavelengths at a time.
  • 6.
    CALIBRATION  WAVE NUMBERPRECISION: – This is performed for substances with well known peak wave number(s) position such as carbon dioxide, water vapor, polystyrene ,ammonia. – Test is performed to know whether the exact peak wave numbers are shown at that time of validation. – Thus the result is obtained from the difference between the peak wave numbers position for a substance with a well known peak wave numbers and the values indicated by the system.  0% TRANSMITTANCE: – A sample which do not allow the transmission of light is measured in order to investigate the 0% transmittance. – This test thus can be used to find out error caused by stray light and secondary emission spectra.
  • 7.
     100% TRANSMITTANCE: –This is investigated by performing analysis with out a sample. – By performing analysis with out the sample 100% transmittance can be investigated.  LINEARITY OF CURVE: – A calibration curve for the % transmittance and the concentration is created and the linearity of the inspected.  REPRODUCIBILITY: – A stable sample is measured twice with in a short period and confirmed whether the variation in the measurement values such as wave numbers and transmittance are obtained.
  • 8.
    VALIDATION • To performFTIR validation and to confirm that it is operating properly, diverse IR inspection was performed by measuring the spectra of polystyrene film. INSTALLATION OF VALIDATION PROGRAM: • Software validates the Shimadzu Fourier transform infrared spectrophotometer IRPrestige-21/IRAffinity-1/FTIR-8000 series by the IR solution software to control them and data processing. • The program is automatically installed when the IR solution is installed, therefore the Validation program does not need to be separately installed. PERFORMANCE QUALIFICATION:  POWER SPECTRUM: – Power spectrum gives the plot of portion of signal's power(energy per unit time) falling with in the given frequency bins. – This test estimates the intensity of power spectrum at a specified wave numbers. – When the measured intensity is equal to or larger than the criterion value, the test is passed.
  • 9.
    ACCEPTANCE CRITERIA: Wave number (cm-1) StandardValue FTIR- 8400S. 4600 10% or min of max 4000 25% or min of max 3000 50% or min of max Power max value 50.0 700 10% or min of max 500 2% or min of max 403 0.5% or min of max 351 0.01% or min of max
  • 10.
     RESOLUTION: – Theresolution is checked by recording the spectrum of polystyrene film of approximately 35µm in thickness. – The difference between percentage transmittance at the absorption maximum A at 2870 cm-1 and absorption minima B at 2849.5 cm-1 must be greater than 18. – The difference between percentage transmittance at the absorption maximum C at 1589 cm-1 and absorption minima D at 1583 cm-1 must be greater than 12.  WAVE NUMBER ACCURACY: – The wave number scale is usually calibrated by the use of several characteristic wave numbers of a polystyrene film. 3060.0 (+/-1.5) cm-1 2849.5 (+/-1.5) cm-1 1942.9 (+/-1.5) cm-1 1601.2 (+/-1.0) cm-1 1583.0 (+/-1.0) cm-1 1154.5 (+/-1.0) cm-1 1028.3 (+/-1.0) cm-1 – The software then judges whether the values are within the allowable range.
  • 11.
    – The programlabels the results “PASS” if all the peak numbers are within the range. – In case of dispersive spectrophotometer the permissible level of frequency at 1601.2 cm-1 and at 1028.3 cm-1 should be with in +/- 2.0 cm-1.  WAVE NUMBER REPRODUCIBILITY: • This program specifies three points to measure the peak wave numbers. • Then it obtains the actual peak wave numbers at each point by measuring the polystyrene film twice. • It should satisfy 5 cm-1 around 3000 cm-1 of polystyrene absorption wave number, 1 cm-1 around 1000 cm-1. • The software determines whether the differences between each of two measurements are within the allowable range and it labels the result PASS if they are with in the range. • EP 4.0 doesn’t include this inspection.
  • 12.
     TRANSMITTANCE REPRODUCIBILITY: –This program specifies peak wave number at three points and the transmittance at each point is measured is twice. – The transmittance reproducibility should satisfy 0.5%T when the several points of polystyrene absorption from 3000 cm-1 to 1000 cm-1 are measured twice. – Then it is determined whether the differences between the two data are within the allowable range and it labels the result PASS if they are with in the range.  AS PER ASTM E1421-94 LEVEL ZERO: – This soft ware complies describes with in the description in the ASTM (American Society for Testing and Materials). – The FTIR abnormalities or large changes over short term and long term is assessed by these tests. – The three parameters checked by this program are: • Energy spectrum test. • 100% line test. • Polystyrene test.
  • 13.
    • ENERGY SPECTRUMTEST: – Power spectra obtained in the inspection are compared with reference data and the spectra are checked for changes over long periods. • ONE HUNDRED PERCENT LINE TEST: – 100% T line spectra are calculated for power spectra & are measured continuously in inspection and the spectra are checked for changes over short periods. • POLYSTYRENE TEST: – Evaluation is performed using differences between spectra obtained for polystyrene film in inspection and the stored reference data. – When the differences are within the standard, "pass” results. – All of the above furnished data should be represented in Validation Report.
  • 14.
    GAS CHROMATOGRAPHY LEVEL-I :SELECTION OF INSTRUMENTS & SUPPLIERS: – At level I of the qualification of a GC equipment (selection of instruments and suppliers). – It is recommended to select a manufacture of GC that can satisfy the needs of the laboratory and works under ISO 9001 certification. LEVEL-II OF EQUIPMENT QUALIFICATION:  INSTALLATION & RELEASE FOR USE: – It is recommended to check all requirements set during the selection of the instrument, and calibration should be performed before putting into service by an accredited external service supplier. (or) – Internally by appropriately qualified personnel, using certified reference buffers according to an approved procedure.
  • 15.
    LEVEL-III: PERIODIC &MOTIVATED INSTRUMENT: Instrument Mode Parameter to be checked Typical Tolerance Limit 1. Inlet System i). Injector leak test. Pressure drop ≤ 1.5 pKa within 5mins. ii). Pressure flow accuracy & stability. Covered by over all test-1. iii). Repeatability of injection (overall test-1) • In split mode RSD ≤ 3.0 % • In split less mode RSD ≤ 3.0 % iv). Injector temp. accuracy & stability. Covered by overall test-2. v). Carry over (overall test-3). ≤ 0.2 % 2. Oven i). Repeatability of oven temp. characteristics. Covered by overall test-2. 3. FID Detector i). Linearity (overall test-3) r2 ≥ 0.999 ii). Constant detector response Covered by overall test-1 or 2.
  • 16.
    1. INLET SYSTEM: INJECTOR LEAK TEST METHOD: – The leak test is carried out according to the procedure laid down in the instrument manual or by the built in automatic leak check procedure of the instrument.  Otherwise use the test described below: – Disconnect the column from the injector and close the injector outlet with a sealed cap. – Close the septum purge and the bypass. – Adjust the flow and pressure controller to the maximal possible value of the pressure gauge. – Adjust the flow controller to zero. – Read the pressure after 1 minute and record the value. – Record the pressure after 5 minutes. • LIMITS: – Pressure drop ≤ 15 kPa within 5 minutes.
  • 17.
     INLET PRESSUREFLOW ACCURACY AND STABILITY: – A direct measurement of these parameters was not deemed practical or necessary, but the optimal conditions of flow/pressure can be verified by the overall test 1. • LIMITS: – Refer to overall test 1.  REPEATABILITY OF INJECTION: – The verification of this parameter is covered by the overall test 1. – This test is to be performed in both split and split less mode. • LIMITS: – Refer to overall test 1.  INJECTOR TEMPERATURE ACCURACY AND STABILITY: – Due to the fact that the temperature cannot be reliably measured without opening and modifying the system and due to the difficulties of introducing a probe inside this module, the verification of this parameter is considered to be covered by the overall test 2. • LIMITS: – Refer to overall test 2.
  • 18.
     INJECTOR CARRYOVER: – After having injected the solutions for the linearity test of the FID detector, in increasing order, inject the blank and measure the peaks that correspond to the major peaks (=analytes) in the linearity solutions. – The verification of this parameter is covered by the overall test 3. • LIMITS: – Refer to overall test 3. 2. OVEN:  REPEATABILITY OF OVEN TEMPERATURE CHARACTERISTICS: – Due to the fact that the temperature cannot be reliably measured without opening and modifying the system conditions and that even when introducing a probe inside the oven, its location would not reflect the real temperature conditions at all points, the verification of this parameter is covered by the overall tests 2A and 2B. • LIMITS: – Refer to overall test 2.
  • 19.
    3. FID DETECTOR: FID DETECTOR LINEARITY: – Increasing amounts of analyte are injected and a linear response should be obtained. – The verification of this parameter is covered by the overall test 3. • LIMITS: – Refer to overall test 3.  CONSTANT FID DETECTOR RESPONSE: – The proper and reproducible functioning of the FID can be demonstrated by checking the peak areas obtained from a pre- defined standard solution. – The verification of this parameter is covered by the overall test 1 or 2. • LIMITS: – Refer to overall test 1 or 2.
  • 20.
    OVERALL TEST-1 The overalltest 1 covers the following parameters: • Pressure/flow accuracy and stability in the inlet system: – Retention time repeatability – Repeatability of injection: peak area precision • In split mode • In split less mode The test may be combined with overall test 3. • SPLIT MODE: – Test solution: 1-octanol in n-hexane 1% (v/v). • Settings: – Column: SPB-1 (30m x 0.32mm ID x 0.25µm film) – Carrier gas: Helium – Velocity: 25cm/sec – Split: 1:100
  • 21.
    – Injection: 1µl –Injector temperature: 220°C – Oven temperature: 100°C isotherm – Detector temperature: 300°C – Runtime: 8 min – Retention time of 1-octanol: about 5 mins. • SPLIT LESS MODE: – Stock solution: 1-octanol in n-hexane 1% (v/v) – Test solution: Dilute 10 ml of the stock solution with n- hexane to 100 ml (corresponds to 1µl/ml of 1-octanol in n- hexane). • Settings: – Column: SPB-1, 30m, 0.32mm ID, 0.25µm film – Carrier: Helium – Velocity: 30cm/sec – Split less injection: purge valve closed during 2 min – Injection: 0.2µl of the test solution
  • 22.
    – Injector Temperature:220°C – Oven Temperature: Initial 60°C for 4 min, 15°C/min. up to 135°C, final time 1min. – Detector temperature: 300°C – Runtime: 9.5 min – Retention time of 1-octanol: about 8 mins.  METHOD: – Carry out 6 consecutive injections of the test solution and calculate the RSD of the different peak areas and retention times.  LIMITS: – Retention time repeatability: The RSD of the retention times should be ≤ 2.0% – Peak area precision (split and split less mode): The RSD of the peak areas should be ≤ 3.0%
  • 23.
    OVERALL TEST 2 Theoverall test 2 covers the following parameters: • Injector, oven and detector temperature accuracy and stability: retention time repeatability • Two alternative tests are proposed. 1. OVERALL TEST 2A:  TEST SOLUTION: – 0.035 ml 1-octanol – 0.035 ml 2-octanone – 0.035 ml 2,6-dimethylanilin – 0.035 ml n-tridecane – 0.035 ml n-tetradecane – 35 mg n-eicosane Dissolved in 50 ml Dichloromethane
  • 24.
     SETTINGS: – Column:SPB-1 (30m x 0.32mm ID x 0.25µm film) – Carrier gas: Helium – Velocity: 25 cm/s – Split: 1:100 – Injection volume: 1 µl – Injector temperature: 220°C – Detector: FID – Detector temperature: 300°C – Gradient program: 60°C (4 min), 5°C/min, 270°C (3 min)  METHOD: – Inject the solution twice and calculate the relative retention times in relation to n- eicosane (RRT = 1). – The following table shows the approximately expected relative retention times.
  • 25.
     LIMITS: – TheRSD of each RRT from two consecutive injections should be ≤ 1.0% 2. OVERALL TEST 2B:  TEST SOLUTION: – 1.0% (W/W) n-Nonane and Hexadecane in Tetradecane.  SETTINGS: – Column: Ultra-1 (25m x 0.32mm ID x 0.52µm film) – Injection volume: 1 µl – Solvent: Tetradecane – Oven temperature: 110°C – Gradient program: 110°C, 20°C/min, 180°C (final time: 3.5min) – Detector temperature: 250°C