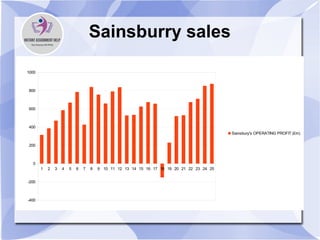
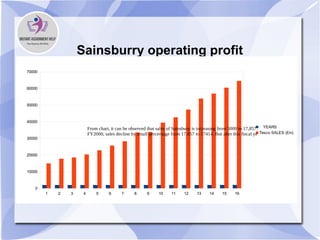
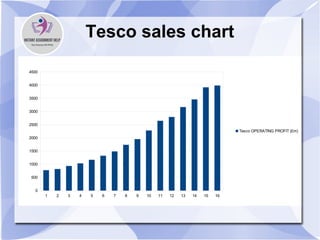
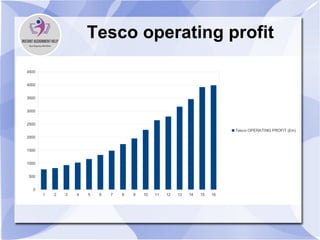
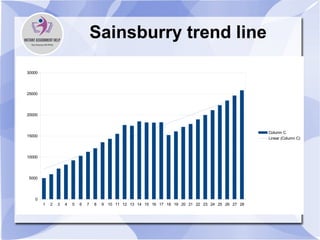
Business development stategy
Sainsburry sales
1 2 3 4 5 6 7 8 9 10 11 12 13 14 15 16 17 18 19 20 21 22 23 24 25
-400
-200
0
200
400
600
800
1000
Sainsbury's OPERATING PROFIT (£m)
Instant Assignment Help Australia
For More Info Visit:
www.instantassignmenthelp.com.au
+61 879 057 034
Analysis
From chart, it can be observed that sales of Sainsbury is increasing from 5000 to
17,857. But in FY2000, sales decline by small percentage from 17,857 to 17414.
But after this fiscal year sales increases and in 2012, it was 22294. On the basis
of analysis of overall trend it can be seen that firm gives a good performance and
sales consistently rise from 1998 to 2012.
Sainsburry operating profit
1 2 3 4 5 6 7 8 9 10 11 12 13 14 15 16
0
10000
20000
30000
40000
50000
60000
70000
YEARS
Tesco SALES (£m)
From chart, it can be observed that sales of Sainsbury is increasing from 5000 to 17,857. But in
FY2000, sales decline by small percentage from 17,857 to 17414. But after this fiscal year sales
increases and in 2012, it was 22294. On the basis of analysis of overall trend it can be seen that firm
Instant Assignment Help Australia
For More Info Visit:
www.instantassignmenthelp.com.au
+61 879 057 034
Analysis
On analysis of chart it can be seen that like sales operating profit of the firm is
also rising. But growth rate is not same in case of operating profit. This is proved
from the low correlation between sales and operating profit. In FY 2000 decline
is observed in sales and due to this reason operating profit of the firm also
decline. But after FY 2000 situation get changed and both sales and operating
profit get increased till FY 2012.
Tesco sales chart
1 2 3 4 5 6 7 8 9 10 11 12 13 14 15 16
0
500
1000
1500
2000
2500
3000
3500
4000
4500
Tesco OPERATING PROFIT (£m)
Instant Assignment Help Australia
For More Info Visit:
www.instantassignmenthelp.com.au
+61 879 057 034
Analysis
On analysis of chart it can be seen that sales of the firm is consistently rising from FY
1998 to FY 2012. this indicates that firm gives a marvellous performance and even crisis
of 2007 comes in existence it managed to increase sale of its product. This indicates that
firm prepare a good business strategy in order to maintain its sales. After 2007 there
were many business that run in loss and failed to compete in uncertain business
environment. But it was Tesco who managed its sales in proper manner. This indicates
that its management is very sound.
Tesco operating profit
1 2 3 4 5 6 7 8 9 10 11 12 13 14 15 16
0
500
1000
1500
2000
2500
3000
3500
4000
4500
Tesco OPERATING PROFIT (£m)
Instant Assignment Help Australia
For More Info Visit:
www.instantassignmenthelp.com.au
+61 879 057 034
Analysis
From chart it can be seen that firm operating profit is increasing continuously by
following sales. This indicates that both are moving in same direction and by nearby
percentage. This is also proved by the correlation value which is 0.99. this reflects that
by whatever percentage sales will change operating profit will also changed by the same
percentage. This also indicates that firm earning is dependent on sales completely. So,
Tesco even it is giving excellent performance must try to identify additional sources for
earning revenue. This will reduce firm dependency on sales foe earning target revenue.
Sainsburry trend line
1 2 3 4 5 6 7 8 9 10 11 12 13 14 15 16 17 18 19 20 21 22 23 24 25 26 27 28
0
5000
10000
15000
20000
25000
30000
Column C
Linear (Column C)
Instant Assignment Help Australia
For More Info Visit:
www.instantassignmenthelp.com.au
+61 879 057 034
Analysis
On analysis of chart it can be seen that most of the times firm sales is nearby to
the trend line. Minor up and down is observed in the chart. This is usual and not
a matter of concern for the firm. Deviation is above the trend line which is a
good indication. This indicates that firm will earn good profit in future and it can
break estimations that are made on the basis of trend line. So, it can be said that
firm in future will give a good performance.
Sales trend line of Tesco
1 2 3 4 5 6 7 8 9 10 11 12 13 14 15 16 17 18 19
0
10000
20000
30000
40000
50000
60000
70000
80000
90000
Column L
Linear (Column L)
Instant Assignment Help Australia
For More Info Visit:
www.instantassignmenthelp.com.au
+61 879 057 034
Analysis
From the above chart, it is estimated that on the basis of previous five year sales growth
rate, it is estimated that sales will be increased up to 76866 in 2015. Which is good
signal for the Tesco specially when economic environment is not in well condition and
Euro zone is facing a problem. But firm must not fully believe on the trend line because
it is formed only on the basis of past data. With change in situation these facts may
prove wrong. Hence, firm need to review its competitors time to time and also need to
make sure that it is changing its strategy with passage of time. This will help firm in
making trend line estimates actual in upcoming years.
Which factor given below mostly affect your
purchase decisions
1 2 3 4 5 6 7 8 9 10 11 12 13 14 15 16 17 18 19
0
10000
20000
30000
40000
50000
60000
70000
80000
90000
Column L
Linear (Column L)
Instant Assignment Help Australia
For More Info Visit:
www.instantassignmenthelp.com.au
+61 879 057 034
Analysis
In research it has been find out that quality is a factor that mostly
affect people purchase decisions in comparison to price. Hence,
Sainsbury must focus on quality instead of price.
Do you think that employees of Sainsbury treat
customers in proper manner
Excellent
Poor
Good
Average
Analysis
In research it has been identified that most of the people think that Sainsbury employees
are not serving customers in proper manner. For this table given below can be reviewed.
Thus, Sainsbury needs to provide training to its employees.
Instant Assignment Help Australia
For More Info Visit:
www.instantassignmenthelp.com.au
+61 879 057 034
Analysis
In research it has been find out that firm is providing products at the
reasonable price. This is evident from the fact given below.Hence it can
be said that firm is giving good performance.
Analysis
Network diagram is a technique that is used by the business firms in order to identify the
time period with in which their project will get complected. If project is completed in the
time period that is indicated by the network diagram then cost of project can be
minimized and time as an important resource can be used effectively. This technique
also help in utilizing human resource in the proper manner. This method mainly indicate
the sequence of activities that must be followed in order to complete project on time.
This sequence must be followed in proper manner in order to make sure that project will
be completed on time and in proper manner. Due to these specific benefits network
diagram technique is widely used in the project management by the project managers.
References
O'Leary, Z., 2013. The essential guide to doing your research project. Sage.
Scherz, N., et.al., 2010. Prognostic importance of hyponatremia in patients with acute
pulmonary embolism. American journal of respiratory and critical care medicine.
182(9). pp.1178-1183.
Yuri Gasparyan, A., et.al., 2011. Mean platelet volume: a link between thrombosis and
inflammation?. Current pharmaceutical design. 17(1). pp.47-58.
Instant Assignment Help Australia
For More Info Visit:
www.instantassignmenthelp.com.au
+61 879 057 034

Business development strategy

  • 1.
  • 2.
    Sainsburry sales 1 23 4 5 6 7 8 9 10 11 12 13 14 15 16 17 18 19 20 21 22 23 24 25 -400 -200 0 200 400 600 800 1000 Sainsbury's OPERATING PROFIT (£m)
  • 3.
    Instant Assignment HelpAustralia For More Info Visit: www.instantassignmenthelp.com.au +61 879 057 034
  • 4.
    Analysis From chart, itcan be observed that sales of Sainsbury is increasing from 5000 to 17,857. But in FY2000, sales decline by small percentage from 17,857 to 17414. But after this fiscal year sales increases and in 2012, it was 22294. On the basis of analysis of overall trend it can be seen that firm gives a good performance and sales consistently rise from 1998 to 2012.
  • 5.
    Sainsburry operating profit 12 3 4 5 6 7 8 9 10 11 12 13 14 15 16 0 10000 20000 30000 40000 50000 60000 70000 YEARS Tesco SALES (£m) From chart, it can be observed that sales of Sainsbury is increasing from 5000 to 17,857. But in FY2000, sales decline by small percentage from 17,857 to 17414. But after this fiscal year sales increases and in 2012, it was 22294. On the basis of analysis of overall trend it can be seen that firm
  • 6.
    Instant Assignment HelpAustralia For More Info Visit: www.instantassignmenthelp.com.au +61 879 057 034
  • 7.
    Analysis On analysis ofchart it can be seen that like sales operating profit of the firm is also rising. But growth rate is not same in case of operating profit. This is proved from the low correlation between sales and operating profit. In FY 2000 decline is observed in sales and due to this reason operating profit of the firm also decline. But after FY 2000 situation get changed and both sales and operating profit get increased till FY 2012.
  • 8.
    Tesco sales chart 12 3 4 5 6 7 8 9 10 11 12 13 14 15 16 0 500 1000 1500 2000 2500 3000 3500 4000 4500 Tesco OPERATING PROFIT (£m)
  • 9.
    Instant Assignment HelpAustralia For More Info Visit: www.instantassignmenthelp.com.au +61 879 057 034
  • 10.
    Analysis On analysis ofchart it can be seen that sales of the firm is consistently rising from FY 1998 to FY 2012. this indicates that firm gives a marvellous performance and even crisis of 2007 comes in existence it managed to increase sale of its product. This indicates that firm prepare a good business strategy in order to maintain its sales. After 2007 there were many business that run in loss and failed to compete in uncertain business environment. But it was Tesco who managed its sales in proper manner. This indicates that its management is very sound.
  • 11.
    Tesco operating profit 12 3 4 5 6 7 8 9 10 11 12 13 14 15 16 0 500 1000 1500 2000 2500 3000 3500 4000 4500 Tesco OPERATING PROFIT (£m)
  • 12.
    Instant Assignment HelpAustralia For More Info Visit: www.instantassignmenthelp.com.au +61 879 057 034
  • 13.
    Analysis From chart itcan be seen that firm operating profit is increasing continuously by following sales. This indicates that both are moving in same direction and by nearby percentage. This is also proved by the correlation value which is 0.99. this reflects that by whatever percentage sales will change operating profit will also changed by the same percentage. This also indicates that firm earning is dependent on sales completely. So, Tesco even it is giving excellent performance must try to identify additional sources for earning revenue. This will reduce firm dependency on sales foe earning target revenue.
  • 14.
    Sainsburry trend line 12 3 4 5 6 7 8 9 10 11 12 13 14 15 16 17 18 19 20 21 22 23 24 25 26 27 28 0 5000 10000 15000 20000 25000 30000 Column C Linear (Column C)
  • 15.
    Instant Assignment HelpAustralia For More Info Visit: www.instantassignmenthelp.com.au +61 879 057 034
  • 16.
    Analysis On analysis ofchart it can be seen that most of the times firm sales is nearby to the trend line. Minor up and down is observed in the chart. This is usual and not a matter of concern for the firm. Deviation is above the trend line which is a good indication. This indicates that firm will earn good profit in future and it can break estimations that are made on the basis of trend line. So, it can be said that firm in future will give a good performance.
  • 17.
    Sales trend lineof Tesco 1 2 3 4 5 6 7 8 9 10 11 12 13 14 15 16 17 18 19 0 10000 20000 30000 40000 50000 60000 70000 80000 90000 Column L Linear (Column L)
  • 18.
    Instant Assignment HelpAustralia For More Info Visit: www.instantassignmenthelp.com.au +61 879 057 034
  • 19.
    Analysis From the abovechart, it is estimated that on the basis of previous five year sales growth rate, it is estimated that sales will be increased up to 76866 in 2015. Which is good signal for the Tesco specially when economic environment is not in well condition and Euro zone is facing a problem. But firm must not fully believe on the trend line because it is formed only on the basis of past data. With change in situation these facts may prove wrong. Hence, firm need to review its competitors time to time and also need to make sure that it is changing its strategy with passage of time. This will help firm in making trend line estimates actual in upcoming years.
  • 20.
    Which factor givenbelow mostly affect your purchase decisions 1 2 3 4 5 6 7 8 9 10 11 12 13 14 15 16 17 18 19 0 10000 20000 30000 40000 50000 60000 70000 80000 90000 Column L Linear (Column L)
  • 21.
    Instant Assignment HelpAustralia For More Info Visit: www.instantassignmenthelp.com.au +61 879 057 034
  • 22.
    Analysis In research ithas been find out that quality is a factor that mostly affect people purchase decisions in comparison to price. Hence, Sainsbury must focus on quality instead of price.
  • 23.
    Do you thinkthat employees of Sainsbury treat customers in proper manner Excellent Poor Good Average
  • 24.
    Analysis In research ithas been identified that most of the people think that Sainsbury employees are not serving customers in proper manner. For this table given below can be reviewed. Thus, Sainsbury needs to provide training to its employees.
  • 25.
    Instant Assignment HelpAustralia For More Info Visit: www.instantassignmenthelp.com.au +61 879 057 034
  • 26.
    Analysis In research ithas been find out that firm is providing products at the reasonable price. This is evident from the fact given below.Hence it can be said that firm is giving good performance.
  • 27.
    Analysis Network diagram isa technique that is used by the business firms in order to identify the time period with in which their project will get complected. If project is completed in the time period that is indicated by the network diagram then cost of project can be minimized and time as an important resource can be used effectively. This technique also help in utilizing human resource in the proper manner. This method mainly indicate the sequence of activities that must be followed in order to complete project on time. This sequence must be followed in proper manner in order to make sure that project will be completed on time and in proper manner. Due to these specific benefits network diagram technique is widely used in the project management by the project managers.
  • 28.
    References O'Leary, Z., 2013.The essential guide to doing your research project. Sage. Scherz, N., et.al., 2010. Prognostic importance of hyponatremia in patients with acute pulmonary embolism. American journal of respiratory and critical care medicine. 182(9). pp.1178-1183. Yuri Gasparyan, A., et.al., 2011. Mean platelet volume: a link between thrombosis and inflammation?. Current pharmaceutical design. 17(1). pp.47-58.
  • 29.
    Instant Assignment HelpAustralia For More Info Visit: www.instantassignmenthelp.com.au +61 879 057 034