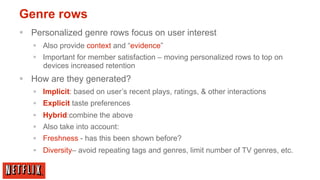
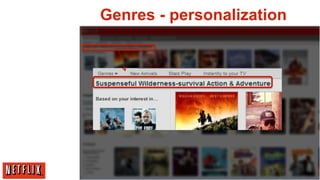
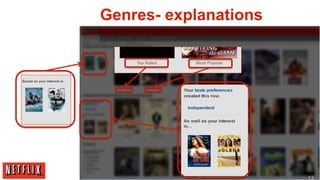
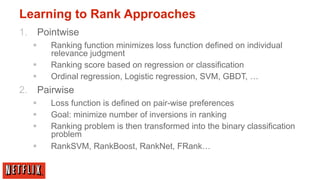
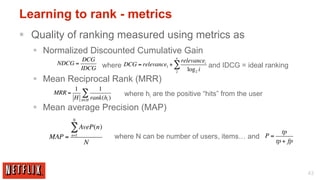
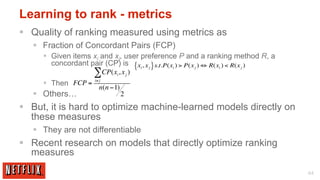
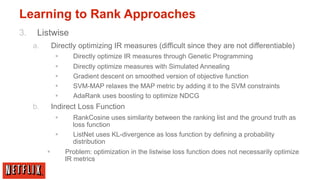
Download as PDF, PPTX


![SVD
X[n x m] = U[n x r] S [ r x r] (V[m x r])T
§ X: m x n matrix (e.g., m users, n videos)
§ U: m x r matrix (m users, r concepts)
§ S: r x r diagonal matrix (strength of each ‘concept’) (r: rank of the matrix)
§ V: r x n matrix (n videos, r concepts)](https://image.slidesharecdn.com/recsys2012tutorial-xamatriain-120914173557-phpapp01/85/Building-Large-scale-Real-world-Recommender-Systems-Recsys2012-tutorial-25-320.jpg)


![Offline/Online testing process
days Weeks to months
Offline Online A/B Rollout
Feature to
testing [success]
testing [success] all users
[fail]
51](https://image.slidesharecdn.com/recsys2012tutorial-xamatriain-120914173557-phpapp01/85/Building-Large-scale-Real-world-Recommender-Systems-Recsys2012-tutorial-51-320.jpg)
![Offline testing process
Initial
Hypothesis
Decide
Reformulate Model Rollout
Hypothesis Prototype Rollout
Train Model Feature to
[no] Wait for
all users
Try
offline
Online A/B
Results
Analyze
different
model?
[yes]
Test
testing
Results
[success]
[no] Hypothesis Significant
validated improvement
offline? on users?
[yes]
[fail] 52
[no]](https://image.slidesharecdn.com/recsys2012tutorial-xamatriain-120914173557-phpapp01/85/Building-Large-scale-Real-world-Recommender-Systems-Recsys2012-tutorial-52-320.jpg)
![Online A/B testing process
Choose
Design A/
Control
B Test
Group
Decide
Reformulate Model Rollout
Hypothesis Prototype Rollout
Train Model Feature to
[no] Wait for
offline all users
Try
Offline Results
Analyze
different
model? testing
[yes]
Test
Results
Significant
Hypothesis [success] improvement
validated on users?
[no] offline? [yes]
[no] 54](https://image.slidesharecdn.com/recsys2012tutorial-xamatriain-120914173557-phpapp01/85/Building-Large-scale-Real-world-Recommender-Systems-Recsys2012-tutorial-54-320.jpg)
![What to measure
§ Short-term metrics can sometimes be informative, and
may allow for faster decision-taking
§ At Netflix we use many such as hours streamed by users or
%hours from a given algorithm
§ But, be aware of several caveats of using early decision
mechanisms
Initial effects appear to trend.
See “Trustworthy Online
Controlled Experiments: Five
Puzzling Outcomes
Explained” [Kohavi et. Al. KDD
12]
57](https://image.slidesharecdn.com/recsys2012tutorial-xamatriain-120914173557-phpapp01/85/Building-Large-scale-Real-world-Recommender-Systems-Recsys2012-tutorial-57-320.jpg)


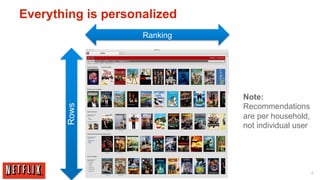
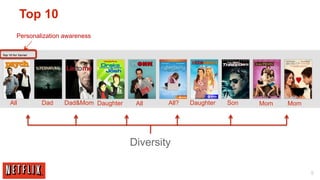
The document outlines the architecture and processes behind the personalization algorithms used by Netflix for its recommender system. It details the integration of consumer data science, big data models, and machine learning approaches in enhancing user engagement and retention. Additionally, it emphasizes the importance of metrics and A/B testing in optimizing these recommendation algorithms over time.