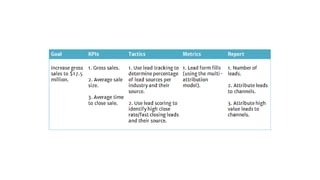
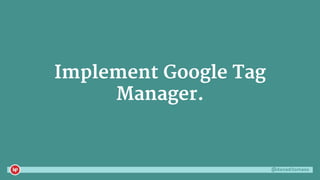
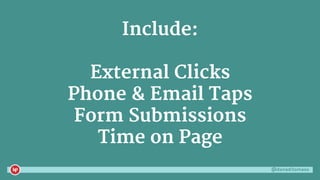
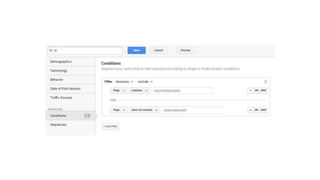
36. @danaditomaso
Typing in a URL or selecting a URL from the address bar
Using a bookmarked link
Clicking on a link from email or another messaging
program
Clicking on a link from a PDF, Word Doc, Google Doc, etc
etc
Clicking on a link from a mobile app
Clicking on a link from a https site to a http site
The temptation is there to just leap right in, but before you report on a single thing, you need to understand why you’re reporting in the first place.
Then you will understand what are the metrics that matter and be able to report on those, not on vanity metrics – those look nice but don’t actually relate to money in any actual way.
Start building a chart like this – this is the outline that you’ll use to build your framework.
This can be a really narrow way to look at things since just raw visitor numbers are frankly, meaningless. It doesn’t tell you where they came from, what their motivations were, or what they did. It gives you a ballpark, but you still don’t know what sport you’re playing when you’re there.
What you see in tools like Google Analytics aren’t the whole picture.
And of course, no one does. How often do you see an ad for a product you pay for already when you’re on a different device than the one that you use regularly to access that service?
If you have a really barebones site and therefore people don’t have to click around a lot, your session duration is probably totally wrong.
And how many people do you know who do this?
Nothing is worse than looking at your data and thinking that everything is stellar and then seeing that you’re not actually making any money.
There are a lot of great things that can be done with Google Tag Manager.
Here are things that you absolutely need in your GTM.
Do you have accordions? Chat? What else can you track that will help you understand what is going on?
Get this. It’s great. Then you can see how far people are engaging with your landing page. There is a sample of how you can use this for reporting in the link I provided.
This is for one of our clients – there is a clear pattern of page visits that says “this is a specific type of customer”. You can do this for any set of variables to isolate out different traffic from each other.
This is for the same client – each row is a persona and we’re specifically tracking how often each persona downloads one of their “how to guides”. In this case, we can see that the middle persona doesn’t give a crap about how to but the top persona is all about them, relatively speaking! This can help define how your content strategy and promotion can align with what your personas care about.
Do you have a login cookie or other session variable that you can set? If you push a logged in state to the data layer and have a different state for leads vs trial vs paid, you can then use that data to segment in Google Analytics.
Custom Dimensions is something you do, User ID is something you hook into with Google. There are pros and cons to both – and you could always implement both if you wanted to! There are links on how to create both in the document we’ve built.
This feels like sorcery but it isn’t.
This is the big question, right here.
This is for that same client, and it shows all their traffic and their conversion rate.
Here is the same data set from above but now only showing sessions from one of their key segments. See how organic goes from 0.94% to 5.47%, but paid actually stays pretty similar (3.28 before and 3.39 now)? That’s how you know you’re getting the right segment in via paid. Display on the other hand is still crap and we should probably give up on it.
It’s anything that Google couldn’t figure out. There wasn’t a campaign variable or an identifiable referrer.
Basically there are a lot of reasons why this could happen.
We have an easy custom report that shows you any direct traffic that isn’t your home page. Clearly that headshot post wasn’t typed in directly 234 times! There is a link to the report in the shared document, you can grab it for your own Google Analytics analysis.
What a great question! Lots of things should be events, but not goals.
Here’s a good rule of thumb — if the event you’re tracking is a thing that can be directly related to making your company money, it’s a goal. For example, a phone call, a form fill. If it isn’t, it’s an event. Time spent on site? NOT A GOAL. Make it an event. It really, really isn’t a goal.
You’ll see in that Google Tag Manager container that we share that there are lots of events – events are great! But they aren’t goals. If it’s a user interaction that doesn’t make you money, it’s an event.
Beyond the ones that I’ve already gone discussed, here are some more ideas if you’re not sure what you should be measuring or considering.
This is a pretty basic report to pull but how often do you look at top of funnel and bottom of funnel keywords? And consider the conversion rate, profit margins, intent, etc.
Do people request downloads or fill out forms more on a specific day or time? Or book appointments? For example, bankruptcy lawyers get more calls on Mondays. Home builders have more leads towards the weekend. Do you need to use AdWords scripts to swap out landing pages based on day or time? Both?
As you improve page speed, check out how conversion rate changes. I guarantee it’ll go up. If it doesn’t, well, you may have other issues.
Does it actually matter how far people get down your page for them to sign up for what you offer?
They are! You learn all kinds of cool things! You can absolutely fall into a Google Analytics hole and look up stuff all day.
Just looking at the data doesn’t mean that you’re fixing your funnel or taking the insights you have on conversion rate and trying out some new a/b tests. This framework is meant to support your efforts, not waste your time.
Resources and links to lots of things I covered are at the link! Feel free to email or tweet me with questions and I hope you find the resources useful as you build your own reporting frameworks.