Download to read offline


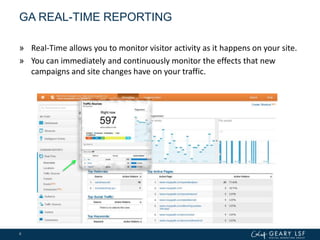
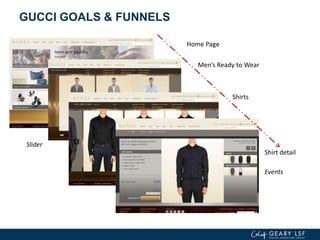
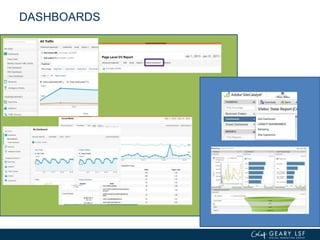


The document covers advanced topics in analytics, focusing on real-time reporting, eCommerce data, and effective use of Google Analytics for performance tracking and reporting. It emphasizes the importance of quality control in data reporting, segmenting traffic for deeper insights, and setting up effective goals and funnels for conversion tracking. Additionally, it discusses customizing dashboards, integrating other tools, and the value of understanding user behavior in enhancing eCommerce strategies.


![Google Analytics [Basics to Enhanced E-commerce]](https://cdn.slidesharecdn.com/ss_thumbnails/googleanalyticsbasicstoenhancede-commerce-190628103318-thumbnail.jpg?width=640&height=640&fit=bounds)


