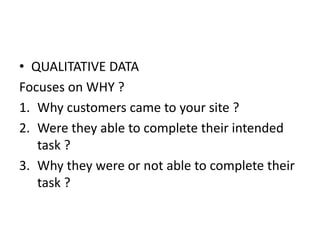
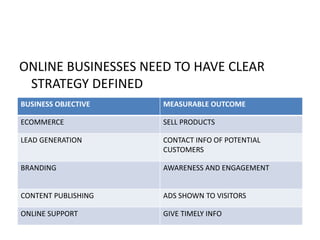
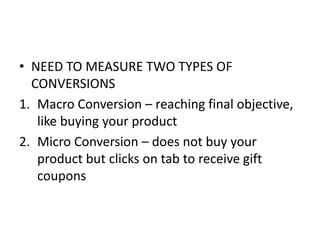
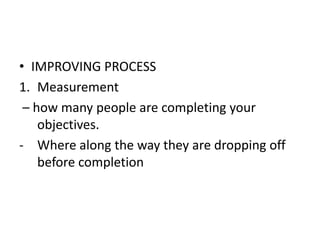
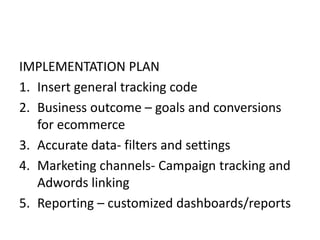
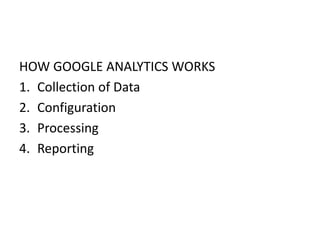
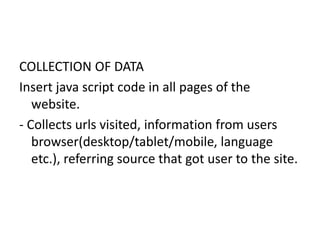
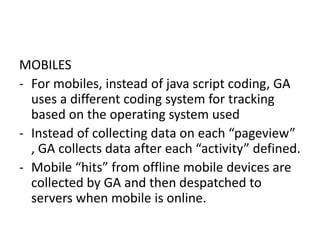
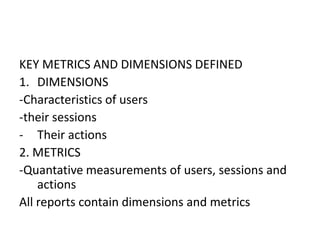
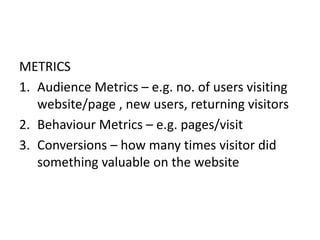
GOOGLE ANALYTICS
GOOGLE ANALYTICS
• DEFINITION:
Digital Analytics is the analysis of qualitative
and quantitative data from your business and
your competition to drive a continual
improvement of the online experience that
your customers and potential customers have
which translates to your desired outcomes,
both offline and online
• TRADITIONAL LIFE CYCLE OF CUSTOMER
1. Awareness – creating awareness
2. Acquisition- Acquiring interest
3. Engagement – engaging potential customers
4. Conversion – sales
5. Retention – retaining customers
• INTERNET MARKETING
With Digital Marketing, customers speed of
engagement and conversion has dramatically
increased thus making the traditional
customer cycle obsolete.
Thus we need to analyze the customer and not
from which channel he is coming from ….
To analyze this digital explosion of data we need
our Analytics program to be
1. Reliable
2. Easily Accessible
3. Holistic
4. Give Real Time analysis
• Quantitative Data
1. Size of your market
2. Geographic location of customer
3. Performance of your online marketing
4. What people do once they visit your website
• Now Google Analytics can trap information
from
1. Mobile applications
2. Cloud connected point of sales systems
3. CRM systems
4. Video Game Systems and consoles
5. Home appliances
• QUALITATIVE DATA
Focuses on WHY ?
1. Why customers came to your site ?
2. Were they able to complete their intended
task ?
3. Why they were or not able to complete their
task ?
ONLINE BUSINESSES NEED TO HAVE CLEAR
STRATEGY DEFINED
BUSINESS OBJECTIVE MEASURABLE OUTCOME
ECOMMERCE SELL PRODUCTS
LEAD GENERATION CONTACT INFO OF POTENTIAL
CUSTOMERS
BRANDING AWARENESS AND ENGAGEMENT
CONTENT PUBLISHING ADS SHOWN TO VISITORS
ONLINE SUPPORT GIVE TIMELY INFO
• NEED TO MEASURE TWO TYPES OF
CONVERSIONS
1. Macro Conversion – reaching final objective,
like buying your product
2. Micro Conversion – does not buy your
product but clicks on tab to receive gift
coupons
• IMPROVING PROCESS
1. Measurement
– how many people are completing your
objectives.
- Where along the way they are dropping off
before completion
2. Reports – package all data collected into a
readable format so that the decision makers
can study it and draw conclusions.
3. Analysis – finding out why sales objectives
were or were not achieved.
4. Test – try out different solutions to improve
performance
5. Improve- learn from this whole process and
use this knowledge in future.
• CORE ANALYSIS TECHNIQUES
1. SEGMENTATION- helps to isolate and analysis
sub sets of your data for deeper analysis.
-which marketing channel is working best for
you
- Which traffic is driving most conversions-Traffic
Source Report
YOU CAN SEGMENT DATA BY
- Date and Time ….
- Device….
- Marketing Channels…
- Geography…..
- Kind of customers, repeat or first time
customers….
• CONTEXT
- EXTERNAL CONTEXT – can compare your
performance to industry standards
- INTERNAL CONTEXT – compare you
performance to historical performance of your
company.
• CONVERSIONS AND CONVERSIONS
ATTRIBUTION
• MICRO AND MACRO CONVERSIONS
• Micro Conversions – Indicators that leads to
final sale/conversion
• Macro Conversions – Final point of
Sale/Conversion
• ATTRIBUTIONS
- Assigning credit to the conversion.
- Helps us to understand the “monetary value or
importance of each marketing channel”
1. Last Click Attribution – full value of the
transaction is given to the final channel.
2. First Click Attribution – full value is given to the
first channel
3. Linear Attribution – all channels get equal
importance
• CREATING MEASUREMENT PLANS
1. You first need
- To understand goals and objectives of your
business
- Understand and decode analytically info
- Implement and use Google Analytics
program.
• BUILDING YOUR ANALYTICS INFRASTRUCTURE
1. Define your measurement plan
2. Document technical infrastructure
3. Create implementation plan
4. Implement
5. Maintain and refine
• 5 STEPS TO MEASUREMENT PLANNING
1. Document business objectives
2. Identify strategies and tactics
3. Choose Key Performance Indicators(KPI)
4. Choose Segments
5. Choose targets
• EXAMPLE
1. You have website plus stores where you sell
eco friendly cotton bags.
2. You have also created a mobile app for selling
these bags
3. You maintain a blog to give info and
advantages of using eco friendly products.
BUSINESS OBJECTIVES :
1. To sell the bags
2. Help people understand the use of eco
friendly products and why they should not
use plastic bags
• FIRST STRATEGY – TO SELL BAGS
Tactics – Sell online , Drive people to our stores,
blog engagement.
KPI – revenue, avg sale per customer(online
sales) , store locator software, printing of
coupons ( offline sales) , frequent and recent
visits to blogs, how many liked the blog on
social sites or recommended our blog on
social sites.
• SEGEMENTS
1. Marketing channels- search , display , email
and social
2. Customer type – new and returning
customers
3. Geography – which stores are visited via
online .
IMPLEMENTATION PLAN
1. Insert general tracking code
2. Business outcome – goals and conversions
for ecommerce
3. Accurate data- filters and settings
4. Marketing channels- Campaign tracking and
Adwords linking
5. Reporting – customized dashboards/reports
MAINTAIN AND REFINE YOUR PLAN !!!!
HOW GOOGLE ANALYTICS WORKS
1. Collection of Data
2. Configuration
3. Processing
4. Reporting
COLLECTION OF DATA
Insert java script code in all pages of the
website.
- Collects urls visited, information from users
browser(desktop/tablet/mobile, language
etc.), referring source that got user to the site.
• One package of information collected by GA is
called a hit or an interaction
MOBILES
- For mobiles, instead of java script coding, GA
uses a different coding system for tracking
based on the operating system used
- Instead of collecting data on each “pageview”
, GA collects data after each “activity” defined.
- Mobile “hits” from offline mobile devices are
collected by GA and then despatched to
servers when mobile is online.
Once data is collected, Processing of data occurs
based on the configuration settings defined by
the user , and finally the processed data in
stored in the database for the perusal of the
user.
KEY METRICS AND DIMENSIONS DEFINED
1. DIMENSIONS
-Characteristics of users
-their sessions
- Their actions
2. METRICS
-Quantative measurements of users, sessions and
actions
All reports contain dimensions and metrics
METRICS
1. Audience Metrics – e.g. no. of users visiting
website/page , new users, returning visitors
2. Behaviour Metrics – e.g. pages/visit
3. Conversions – how many times visitor did
something valuable on the website
Sessions or visits
Sessions continue till the user stops interacting
on the website
GA gives maximum of 30 minutes per session,
after that GA stops recording activity.
Can extend sessions time out length in
configuration settings
For recording video views then you need to set
events measurements.
SETTING UP YOUR ACCOUNT
1. Open a GA account
2. Copy the tracking code in the header section of all the
pages of the website
3. Your website becomes one “property”
4. In your property set 3 views
- Unfiltered view – no special settings or filters are
added to the data
- Master View – contains all your settings and filters
- Test View – contains settings and filters that you may
want to implement in the Master View
IMPORTANT !!
1. Once data is processed it cannot be
reprocessed
2. Once a view is deleted it cannot be restored
3. New views start reporting data from date of
creation
FILTERS
Filters are applied to views to customize views
that are suitable to your business needs.
Filters can
1. Exclude data
2. Include data
3. Change data
GOALS
Are based on conversions
1. Micro Conversions – activities that might lead
up to eventual online sale. e.g. signing up for
newsletter
2. Macro Conversions- activity that is the final
goal ……e.g. making online purchase
Goals are configured at the View level , that
means that we can have different goals for
different views.
4 types of Goals
1. Destination – e.g. thanks.html
2. Duration – 5 minutes or more
3. Pages per visit
4. Event – playing a video
REPORTING
1. OVERVIEW
2. AUDIENCE REPORTS
-understand user behavior using frequency and
recency reports
-access geographic data
- View mobile data to your site
- Access custom dimension data
ACQUISITION REPORT
Which digital marketing channels are helping
- Understand the different traffic sources to
your site
- Find and analyze your marketing campaigns
ADWORDS REPORTS
Different from acquisition reports in 2 ways
-shows information specific to Adwords and the
campaign settings
- Makes use of cost data imported from
Adwords

Google Analytics

  • 1.
  • 2.
    GOOGLE ANALYTICS • DEFINITION: DigitalAnalytics is the analysis of qualitative and quantitative data from your business and your competition to drive a continual improvement of the online experience that your customers and potential customers have which translates to your desired outcomes, both offline and online
  • 3.
    • TRADITIONAL LIFECYCLE OF CUSTOMER 1. Awareness – creating awareness 2. Acquisition- Acquiring interest 3. Engagement – engaging potential customers 4. Conversion – sales 5. Retention – retaining customers
  • 4.
    • INTERNET MARKETING WithDigital Marketing, customers speed of engagement and conversion has dramatically increased thus making the traditional customer cycle obsolete. Thus we need to analyze the customer and not from which channel he is coming from ….
  • 5.
    To analyze thisdigital explosion of data we need our Analytics program to be 1. Reliable 2. Easily Accessible 3. Holistic 4. Give Real Time analysis
  • 6.
    • Quantitative Data 1.Size of your market 2. Geographic location of customer 3. Performance of your online marketing 4. What people do once they visit your website
  • 7.
    • Now GoogleAnalytics can trap information from 1. Mobile applications 2. Cloud connected point of sales systems 3. CRM systems 4. Video Game Systems and consoles 5. Home appliances
  • 8.
    • QUALITATIVE DATA Focuseson WHY ? 1. Why customers came to your site ? 2. Were they able to complete their intended task ? 3. Why they were or not able to complete their task ?
  • 9.
    ONLINE BUSINESSES NEEDTO HAVE CLEAR STRATEGY DEFINED BUSINESS OBJECTIVE MEASURABLE OUTCOME ECOMMERCE SELL PRODUCTS LEAD GENERATION CONTACT INFO OF POTENTIAL CUSTOMERS BRANDING AWARENESS AND ENGAGEMENT CONTENT PUBLISHING ADS SHOWN TO VISITORS ONLINE SUPPORT GIVE TIMELY INFO
  • 10.
    • NEED TOMEASURE TWO TYPES OF CONVERSIONS 1. Macro Conversion – reaching final objective, like buying your product 2. Micro Conversion – does not buy your product but clicks on tab to receive gift coupons
  • 11.
    • IMPROVING PROCESS 1.Measurement – how many people are completing your objectives. - Where along the way they are dropping off before completion
  • 12.
    2. Reports –package all data collected into a readable format so that the decision makers can study it and draw conclusions. 3. Analysis – finding out why sales objectives were or were not achieved. 4. Test – try out different solutions to improve performance 5. Improve- learn from this whole process and use this knowledge in future.
  • 13.
    • CORE ANALYSISTECHNIQUES 1. SEGMENTATION- helps to isolate and analysis sub sets of your data for deeper analysis. -which marketing channel is working best for you - Which traffic is driving most conversions-Traffic Source Report
  • 14.
    YOU CAN SEGMENTDATA BY - Date and Time …. - Device…. - Marketing Channels… - Geography….. - Kind of customers, repeat or first time customers….
  • 15.
    • CONTEXT - EXTERNALCONTEXT – can compare your performance to industry standards - INTERNAL CONTEXT – compare you performance to historical performance of your company.
  • 16.
    • CONVERSIONS ANDCONVERSIONS ATTRIBUTION • MICRO AND MACRO CONVERSIONS • Micro Conversions – Indicators that leads to final sale/conversion • Macro Conversions – Final point of Sale/Conversion
  • 17.
    • ATTRIBUTIONS - Assigningcredit to the conversion. - Helps us to understand the “monetary value or importance of each marketing channel” 1. Last Click Attribution – full value of the transaction is given to the final channel. 2. First Click Attribution – full value is given to the first channel 3. Linear Attribution – all channels get equal importance
  • 18.
    • CREATING MEASUREMENTPLANS 1. You first need - To understand goals and objectives of your business - Understand and decode analytically info - Implement and use Google Analytics program.
  • 19.
    • BUILDING YOURANALYTICS INFRASTRUCTURE 1. Define your measurement plan 2. Document technical infrastructure 3. Create implementation plan 4. Implement 5. Maintain and refine
  • 20.
    • 5 STEPSTO MEASUREMENT PLANNING 1. Document business objectives 2. Identify strategies and tactics 3. Choose Key Performance Indicators(KPI) 4. Choose Segments 5. Choose targets
  • 21.
    • EXAMPLE 1. Youhave website plus stores where you sell eco friendly cotton bags. 2. You have also created a mobile app for selling these bags 3. You maintain a blog to give info and advantages of using eco friendly products.
  • 22.
    BUSINESS OBJECTIVES : 1.To sell the bags 2. Help people understand the use of eco friendly products and why they should not use plastic bags
  • 23.
    • FIRST STRATEGY– TO SELL BAGS Tactics – Sell online , Drive people to our stores, blog engagement. KPI – revenue, avg sale per customer(online sales) , store locator software, printing of coupons ( offline sales) , frequent and recent visits to blogs, how many liked the blog on social sites or recommended our blog on social sites.
  • 24.
    • SEGEMENTS 1. Marketingchannels- search , display , email and social 2. Customer type – new and returning customers 3. Geography – which stores are visited via online .
  • 25.
    IMPLEMENTATION PLAN 1. Insertgeneral tracking code 2. Business outcome – goals and conversions for ecommerce 3. Accurate data- filters and settings 4. Marketing channels- Campaign tracking and Adwords linking 5. Reporting – customized dashboards/reports
  • 26.
    MAINTAIN AND REFINEYOUR PLAN !!!!
  • 27.
    HOW GOOGLE ANALYTICSWORKS 1. Collection of Data 2. Configuration 3. Processing 4. Reporting
  • 28.
    COLLECTION OF DATA Insertjava script code in all pages of the website. - Collects urls visited, information from users browser(desktop/tablet/mobile, language etc.), referring source that got user to the site.
  • 29.
    • One packageof information collected by GA is called a hit or an interaction
  • 30.
    MOBILES - For mobiles,instead of java script coding, GA uses a different coding system for tracking based on the operating system used - Instead of collecting data on each “pageview” , GA collects data after each “activity” defined. - Mobile “hits” from offline mobile devices are collected by GA and then despatched to servers when mobile is online.
  • 31.
    Once data iscollected, Processing of data occurs based on the configuration settings defined by the user , and finally the processed data in stored in the database for the perusal of the user.
  • 32.
    KEY METRICS ANDDIMENSIONS DEFINED 1. DIMENSIONS -Characteristics of users -their sessions - Their actions 2. METRICS -Quantative measurements of users, sessions and actions All reports contain dimensions and metrics
  • 33.
    METRICS 1. Audience Metrics– e.g. no. of users visiting website/page , new users, returning visitors 2. Behaviour Metrics – e.g. pages/visit 3. Conversions – how many times visitor did something valuable on the website
  • 34.
    Sessions or visits Sessionscontinue till the user stops interacting on the website GA gives maximum of 30 minutes per session, after that GA stops recording activity. Can extend sessions time out length in configuration settings For recording video views then you need to set events measurements.
  • 35.
    SETTING UP YOURACCOUNT 1. Open a GA account 2. Copy the tracking code in the header section of all the pages of the website 3. Your website becomes one “property” 4. In your property set 3 views - Unfiltered view – no special settings or filters are added to the data - Master View – contains all your settings and filters - Test View – contains settings and filters that you may want to implement in the Master View
  • 36.
    IMPORTANT !! 1. Oncedata is processed it cannot be reprocessed 2. Once a view is deleted it cannot be restored 3. New views start reporting data from date of creation
  • 37.
    FILTERS Filters are appliedto views to customize views that are suitable to your business needs. Filters can 1. Exclude data 2. Include data 3. Change data
  • 38.
    GOALS Are based onconversions 1. Micro Conversions – activities that might lead up to eventual online sale. e.g. signing up for newsletter 2. Macro Conversions- activity that is the final goal ……e.g. making online purchase
  • 39.
    Goals are configuredat the View level , that means that we can have different goals for different views. 4 types of Goals 1. Destination – e.g. thanks.html 2. Duration – 5 minutes or more 3. Pages per visit 4. Event – playing a video
  • 40.
    REPORTING 1. OVERVIEW 2. AUDIENCEREPORTS -understand user behavior using frequency and recency reports -access geographic data - View mobile data to your site - Access custom dimension data
  • 41.
    ACQUISITION REPORT Which digitalmarketing channels are helping - Understand the different traffic sources to your site - Find and analyze your marketing campaigns
  • 42.
    ADWORDS REPORTS Different fromacquisition reports in 2 ways -shows information specific to Adwords and the campaign settings - Makes use of cost data imported from Adwords