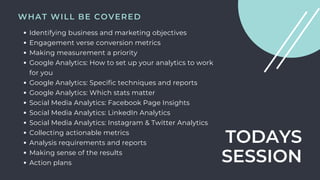
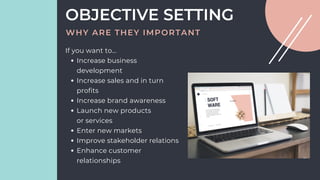
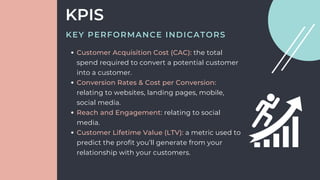
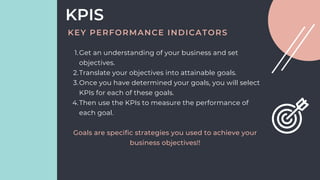
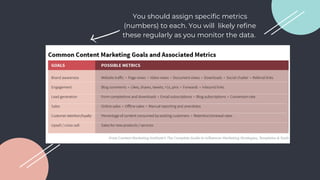
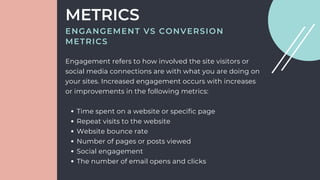
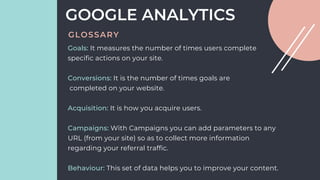
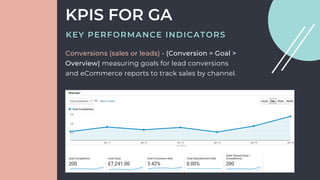
DATA ANALYTICS
BY JESSICA LE MERLE
Co-founder of Afundi
Digital marketing specialist
Passionate about imparting knowledge
Creative and big thinker
Survive on coffee
Dog lover in particular our puppy Charlie
Proud woman in business
Planner and strategist
Proudly South African
Love our Island
1.
2.
3.
4.
5.
6.
7.
8.
9.
10.
10 THINGS ABOUT ME
fundi
/ˈFƱNDI/
an expert in a particular area.    
a word from the Bantu family of African
languages, meaning a learned person,
usually used for as (master) craftsman,
expert or genius.     
an enthusiast for a subject or activity.  
someone who knows a lot about a subject
noun
noun: fundi; plural noun: fundis.    
1.
2.
3.
4.
Afundi is a full-service software development and
collaborative digital agency for brands and
businesses that refuse to blend in.
In this digital era, we deliver exceptional web and
software development, strategic branding,
compelling storytelling, and note-perfect design.
We are a forward-thinking collective of data-
driven strategists, marketing specialists, and
creative technologists who combine our
individual passions and affinities to inspire digital
transformation, customising our approach to fit a
client’s needs and their brand’s DNA.
We build brands, create desire, and craft results-
based digital strategies for transformative growth.
We’re not just an agency: we’re an extension to
your internal teams, agile enough to drill down
into your brand’s philosophy and knowledgeable
enough to deliver seamless solutions with
measurable results.
Collaboration is at the heart of everything we do,
allowing our clients to get back to focusing on
what really matters: their business.
TODAYS
SESSION
Identifying business and marketing objectives
Engagement verse conversion metrics
Making measurement a priority
Google Analytics: How to set up your analytics to work
for you
Google Analytics: Specific techniques and reports
Google Analytics: Which stats matter
Social Media Analytics: Facebook Page Insights
Social Media Analytics: LinkedIn Analytics
Social Media Analytics: Instagram & Twitter Analytics
Collecting actionable metrics
Analysis requirements and reports
Making sense of the results
Action plans
WHAT WILL BE COVERED
You can’t manage what you
don’t measure!!
Increase business
development
Increase sales and in turn
profits
Increase brand awareness
Launch new products
or services
Enter new markets
Improve stakeholder relations
Enhance customer
relationships
If you want to...
OBJECTIVE SETTING
WHY ARE THEY IMPORTANT
Specific – Can the detail in the information sufficient to
pinpoint problems or opportunities? Is the objective
sufficiently detailed to measure real-world problems
and opportunities?
Measurable – Can a quantitative or qualitative attribute
be applied to create a metric?
Actionable – Can the information be used to improve
performance? If the objective doesn’t change behaviour
to help them improve performance, there is little point
in it!
OBJECTIVE SETTING
SMART OBJECTIVES
Relevant – Can the information be applied to
the specific problem faced?
Time bound/based – Can objectives be set for
different time periods as targets to review against?
OBJECTIVE SETTING
SMART OBJECTIVES
Ultimately you need to ensure you put in place
strategies that:
1) Build on your strengths (S).
2) Minimise your weaknesses (W).
3) Capitalise on your opportunities (O).
4) Counteract your threats (T).
OBJECTIVE SETTING
SMART OBJECTIVES
It is essential to business and marketing success that
you pin point key performance indicators. It is a metric
which is used to determine how you are performing
against your business objectives.
KPIS
KEY PERFORMANCE INDICATORS
Customer Acquisition Cost (CAC): the total
spend required to convert a potential customer
into a customer.
Conversion Rates & Cost per Conversion:
relating to websites, landing pages, mobile,
social media.
Reach and Engagement: relating to social
media.
Customer Lifetime Value (LTV): a metric used to
predict the profit you’ll generate from your
relationship with your customers.
KPIS
KEY PERFORMANCE INDICATORS
Get an understanding of your business and set
objectives.
Translate your objectives into attainable goals.
Once you have determined your goals, you will select
KPIs for each of these goals.
Then use the KPIs to measure the performance of
each goal.
1.
2.
3.
4.
Goals are specific strategies you used to achieve your
business objectives!!
KPIS
KEY PERFORMANCE INDICATORS
You should assign specific metrics
(numbers) to each. You will likely refine
these regularly as you monitor the data.
Time spent on a website or specific page
Repeat visits to the website
Website bounce rate
Number of pages or posts viewed
Social engagement
The number of email opens and clicks
Engagement refers to how involved the site visitors or
social media connections are with what you are doing on
your sites. Increased engagement occurs with increases
or improvements in the following metrics:
METRICS
ENGANGEMENT VS CONVERSION
METRICS
Sales (service or product)
Contact form submission
A call or live chat take up
Request of more info
Downloads of a brochure, ebook, white paper,
infographic, user manual, etc.
Conversions refer to the number of people who follow
through with a desired, measurable action. Increased
conversions occur with an increase in the following
metrics:
METRICS
ENGANGEMENT VS CONVERSION
METRICS
METRICS
Website traffic volume
Website traffic referrals
Email subscriber database growth
Social media fans, connections and followers
Back links
Awareness refers to the company or brand the
customer thinks of first when he or she needs a
product or service. Essentially brand/company
loyalty. Increased awareness occurs with an increase
in the following metrics:
AWARENESS METRICS
Vanity metrics: Numbers or stats that look good on paper,
but don’t really mean anything important. For example, site
visitors, Facebook followers, Twitter followers and page
views.
Actionable metrics: Stats that tie to specific and repeatable
tasks you can improve to assist with reaching your goals.
For example, email opt-in rate, purchases, email open rate,
and click-through-rate.
METRICS
VANITY VERSUS ACTIONABLE
Return On Investment (ROI) - divide your
gain from investment by the cost of
investment.
Cost Per Lead / Acquisition (CPL/CPA) -
divide the total costs associated with
acquisition by total new customers,
within a specific time period.
Bounce Rate
Rate of Return Visitors
Conversion Rate
Unique visitors
Source attribution
METRICS
ACTIONABLE METRICS
The purpose of measurement is ultimately to drive
future improvements in performance
Pick a date each month and use that day to review
Ensure you compile a report that includes
actionable items
Share the report
Set targets
Ensure you also do a month to month
comparison, as well as review year to year
Look at industry standards
Using tools to assist you will make life easier
Ensure you assign the right people to the job
MEASUREMENT
MAKING IT A PRIORITY
It's free.
It's powerful.
You can measure who visits
your website, where they come
from and how they’re
interacting with your website.
You can see if your social media
and online marketing activity is
proving useful.
If you haven't already jumped onto
GA here's why you should...
GOOGLE ANALYTICS
WHY
Dimensions: A dimension is a descriptive attribute of an
object that can take different values. Some of the examples
of dimensions that you see in Google Analytics include
Browser, Exit Page, Screens, Session Duration, etc.
Metrics: These are individual elements of dimensions which
can be measured in the form of a sum or a ratio. Examples
include Screen Views, Average Session Duration, Page or
Session, etc.
Sessions: It is a period of time during which a user is actively
engaged with your website (within a date range).
GOOGLE ANALYTICS
GLOSSARY
Users: They are the ones who have had at least one
session within the selected date range. It includes both
new as well as returning users.
Page Views: It is the total number of pages viewed.
Pages/Session: It shows how many pages a visitor visited
on your site. Here, repeated views of a single page are
also counted.
Bounce Rate: It shows visitor moved from your site after
single page visit.
GOOGLE ANALYTICS
GLOSSARY
Goals: It measures the number of times users complete
specific actions on your site.
Conversions: It is the number of times goals are
completed on your website.
Acquisition: It is how you acquire users.
Campaigns: With Campaigns you can add parameters to any
URL (from your site) so as to collect more information
regarding your referral traffic.
Behaviour: This set of data helps you to improve your content.
GOOGLE ANALYTICS
GLOSSARY
Set up your GA account using an
email address you will ALWAYS
have access to.
Once you set up your GA account
ensure you add to your website
and double check it is working.
Ensure you are filtering out your
own traffic (IP address).
Ensure you are filtering out BOT
(junk) traffic.
Connect your Google Search
Console so you can see the
keywords people are using to find
your website.
SETTING UP GA
TOP TIPS
Watch this video:
SETTING UP GA
TOP TIPS
Type of device they are on
Where they are coming from
Are they repeat or new users
Interests
Referral traffic
Organic traffic
Paid search
Social
Audience Reports - These reports tell you about
the users that accessed your website.
Acquisition Reports - These reports help
determine how someone arrived at your site.
GA TYPES OF REPORTS
AUDIENCE & ACQUISITION
Which pages did the visit
Which landing pages are most popular
How long someone spent on selected pages
Site search (if applicable)
Downloads
Contact form submission
Sales/purchases
Behaviour Reports – This report focuses on what users did
on your website.
Conversion Reports – These reports cover pages or actions
that you hope visitors to your site will accomplish, and then
be able to see how often those conversions occur
GA TYPES OF REPORTS
BEHAVIOUR & CONVERSION REPORTS
Conversions (sales or leads) - (Conversion > Goal >
Overview) measuring goals for lead conversions
and eCommerce reports to track sales by channel.
KPIS FOR GA
KEY PERFORMANCE INDICATORS
Average time on page - (Behaviour > Site Content > All
Pages). This is important in the context of what you are
selling, whether it be services or products.
Bounce rate - (Behaviour > Site Content > All Pages) A
high bounce rate could mean your content is not
engaging your audience and therefore you need to
make some changes.
Page Views - (Behaviour > Site Content > All Pages)
This is particularly important when it comes to your
objectives. For example, if you are trying to educate
your audience with blogs it is important to understand
are your blogs being viewed.
KPIS FOR GA
KEY PERFORMANCE INDICATORS
Acquisition - This is important in telling you where your
traffic is coming from. If you are putting a lot of effort
into social media but not seeing traffic from that
source you may need to reconsider your strategy.
KPIS FOR GA
KEY PERFORMANCE INDICATORS
Number of visitors/page views to
your website from social media
Number of hash-tagged posts
Number of “likes”
Number of social shares
Number of audiences reached
through social networks
SOCIAL MEDIA
BRAND AWARENESS
Growth rate of fans and
followers
Average number of likes per
post
Average number of comments
per post
Average shares per post
Number of advocates per month
SOCIAL MEDIA
ENGAGEMENT
Number of subscribers to your email
list
Number of downloads
Number of promotion redemptions
Number of purchases
Number of app downloads
Number of calls and or contact
submissions
SOCIAL MEDIA
CONVERSION
Actions on Page: The combined total clicks for your
contact information and call-to-action button
Page views: Total views of your Facebook Page,
including by people not logged into Facebook.
Page Previews: The number of times people hovered
their mouse over your Page information to see a
preview of your Page.
Page Likes: The number of new likes.
Post reach: The number of people who saw your posts
in their timeline.
Story reach: The number of people who saw your
Stories.
FACEBOOK
INSIGHTS SUMMARY
Recommendations: The number of people who
recommended your Page.
Post engagement: A combined total of post likes,
comments, shares, and other engagements.
Responsiveness: An evaluation of how often and how fast
you respond to messages.
Videos: The number of video views of three seconds of more.
Page followers: The number of new followers
Orders: Your orders and earnings. (if you are selling via
Facebook).
You then will see your latest posts (5 in total) and other pages
to watch.
FACEBOOK
INSIGHTS SUMMARY
Reach and engagement: How many people saw your
posts and who interacted with them?
Actions: What actions do people take on your Page
such as visit your website?
People: What are the demographics of the people who
visit your Page? When do people visit your Page?
Posts: How are your posts performing (and over
different time periods).
Did you know you can go back two years so you can
really compare results over time. You can also export
data to review and edit.
FACEBOOK
WHAT REALLY MATTERS
LINKEDIN
WHAT CAN YOU MONITOR
Visitors: Data on people who visit your
LinkedIn page
Updates: Engagement metrics for
content posted on your LinkedIn page
Followers: Information about people who
subscribe to your page.
Did you know you can change the time
period as well as aggregate mobile and
desktop for certain metrics. You can also
export data to review and edit.
LINKEDIN
MEASURING UPDATES
Impressions: The number of times a post was shown to
LinkedIn users.
Video Views: The number of times your video was watched.
Clicks: The number of times your company name, content or
logo has been clicked on.
CTR: Click through rate (number of clicks divided by
impressions)
Interactions: The number of engagements on your post.
Follows: The number of new followers you gained from a
sponsored update. If your post is organic this will be empty.
Engagement: The number of interactions divided by
impressions.
A social media advertising
clickthrough rate (CTR) of 2 - 5 % is
deemed good.
Page Views
Unique Visitors
Custom Button links
Demographics
Total followers
New followers
(per date range)
Follower profiles (latest)
Demographics
Companies to track/monitor
Visitor stats:
Follower stats:
LINKEDIN
VISITORS & FOLLOWERS
Tweet Impressions
Top Tweets
Tweet Engagement &
engagement rate
Follower growth
Profile visits
Mentions
Video Content
Performance
TWITTER
WHAT MATTERS
TWITTER
WHAT MATTERS
Impressions: The number of times your posts have been
seen during the specific time frame.
Interactions: The number of actions taken on your
account/profile.
Reach: The number of unique Instagram accounts that have
seen any of your posts.
Profile Visits: The total number of profile views.
Website Clicks: The number of times visitors have clicked
the link to your website from your profile.
Call/email clicks: the number of times visitors have clicked
the call/email button from your profile.
Mentions: the number of times your account’s handle has
been mentioned by other Instagram users.
INSTAGRAM
PROFILE ANALYTICS
Top locations: This information allows you to see
the top five cities and countries where your
followers come from.
Age range: How old are your followers? This is an
easy way to find out. Instagram breaks it down
with the following ranges: 13-17, 18-24, 25-34, 35-
44, 45-54, 55-64, 65+.
Gender: Male or female
Most Active Times (hours): The average time of
day your followers are on Instagram.
Most Active Times (days): The days of the week
your followers are most active.
INSTAGRAM
AUDIENCE ANALYTICS
Interactions: Visits to your profile, hyperlink clicks, or
using the call/email button in your post.
Discovery: The number of accounts reached through
discovery who are not currently following you.
Follows: How many new followers you received from
a post.
Reach: How many unique accounts the post reached.
Impressions: The number of times your post was
viewed.
Saves: The number of unique accounts that saved
your post to their personal saved folder
Comments: The number of comments on your post
INSTAGRAM
POST ANALYTICS
Impressions
Reach
Page Views
Website link clicks on social
CTA button clicks on social
Website clicks
Engagement (comments in particular)
If you want to increase your brand awareness:
If you want to generate sales or leads:
If you want to build a community or improve comms:
REPORTING
ANALYSING THE RESULTS
SEO/website report – Traffic volumes, sources and
conversions.
PPC report – Click-through rates and cost-per-
conversion data.
Social media reports – Audience analytics and
campaign data.
Email marketing report – Click-through rates,
engagement levels and conversion data.
You may want to split your reports:
REPORTING
ANALYSING THE RESULTS
High bounce rate - you may want to check your load speed.
Low engagement rate - you may need to look at improving
your posts & introduce video or imagery.
Social media referral traffic is low - you may need to
improve your social media content strategy and rate of
posting.
Low repeat users/traffic - you may want to take post more
insightful dynamic content.
Incomplete goals/low conversion - you may wan to assess
whether your check out process or form is user friendly.
Taking action:
REPORTING
ANALYSING THE RESULTS
TOOLS
USEFUL 3RD PARTY SOFTWARE
Google Analytics: analytics.google.com
Setting up GA: https://www.orbitmedia.com/blog/how-to-setup-google-
analytics/
Setting up a goal in GA:
https://support.google.com/analytics/answer/1032415?hl=en
12 useful GA reports: https://neilpatel.com/blog/expert-google-analytics-
reports/
Facebook insights: https://buffer.com/library/facebook-insights/
Twitter analytics: https://business.twitter.com/en/blog/7-useful-insights-
twitter-analytics.html
LinkedIn analytics: https://business.linkedin.com/marketing-
solutions/reporting-analytics
Social Media Reporting: https://sproutsocial.com/features/social-media-
analytics/
Social Media Reporting: https://www.hootsuite.com
USEFUL LINKS
GET IN TOUCH
jessica@afundi.im
/jessica le merle
www.afundi.im
EMAIL ADDRESS
LINKEDIN
WEBSITE ADDRESS

Data analytics-training - Jess Le Merle

  • 1.
  • 2.
    Co-founder of Afundi Digitalmarketing specialist Passionate about imparting knowledge Creative and big thinker Survive on coffee Dog lover in particular our puppy Charlie Proud woman in business Planner and strategist Proudly South African Love our Island 1. 2. 3. 4. 5. 6. 7. 8. 9. 10. 10 THINGS ABOUT ME
  • 3.
    fundi /ˈFƱNDI/ an expert ina particular area.     a word from the Bantu family of African languages, meaning a learned person, usually used for as (master) craftsman, expert or genius.      an enthusiast for a subject or activity.   someone who knows a lot about a subject noun noun: fundi; plural noun: fundis.     1. 2. 3. 4.
  • 4.
    Afundi is afull-service software development and collaborative digital agency for brands and businesses that refuse to blend in. In this digital era, we deliver exceptional web and software development, strategic branding, compelling storytelling, and note-perfect design. We are a forward-thinking collective of data- driven strategists, marketing specialists, and creative technologists who combine our individual passions and affinities to inspire digital transformation, customising our approach to fit a client’s needs and their brand’s DNA.
  • 5.
    We build brands,create desire, and craft results- based digital strategies for transformative growth. We’re not just an agency: we’re an extension to your internal teams, agile enough to drill down into your brand’s philosophy and knowledgeable enough to deliver seamless solutions with measurable results. Collaboration is at the heart of everything we do, allowing our clients to get back to focusing on what really matters: their business.
  • 6.
    TODAYS SESSION Identifying business andmarketing objectives Engagement verse conversion metrics Making measurement a priority Google Analytics: How to set up your analytics to work for you Google Analytics: Specific techniques and reports Google Analytics: Which stats matter Social Media Analytics: Facebook Page Insights Social Media Analytics: LinkedIn Analytics Social Media Analytics: Instagram & Twitter Analytics Collecting actionable metrics Analysis requirements and reports Making sense of the results Action plans WHAT WILL BE COVERED
  • 7.
    You can’t managewhat you don’t measure!!
  • 8.
    Increase business development Increase salesand in turn profits Increase brand awareness Launch new products or services Enter new markets Improve stakeholder relations Enhance customer relationships If you want to... OBJECTIVE SETTING WHY ARE THEY IMPORTANT
  • 9.
    Specific – Canthe detail in the information sufficient to pinpoint problems or opportunities? Is the objective sufficiently detailed to measure real-world problems and opportunities? Measurable – Can a quantitative or qualitative attribute be applied to create a metric? Actionable – Can the information be used to improve performance? If the objective doesn’t change behaviour to help them improve performance, there is little point in it! OBJECTIVE SETTING SMART OBJECTIVES
  • 10.
    Relevant – Canthe information be applied to the specific problem faced? Time bound/based – Can objectives be set for different time periods as targets to review against? OBJECTIVE SETTING SMART OBJECTIVES
  • 11.
    Ultimately you needto ensure you put in place strategies that: 1) Build on your strengths (S). 2) Minimise your weaknesses (W). 3) Capitalise on your opportunities (O). 4) Counteract your threats (T). OBJECTIVE SETTING SMART OBJECTIVES
  • 12.
    It is essentialto business and marketing success that you pin point key performance indicators. It is a metric which is used to determine how you are performing against your business objectives. KPIS KEY PERFORMANCE INDICATORS
  • 13.
    Customer Acquisition Cost(CAC): the total spend required to convert a potential customer into a customer. Conversion Rates & Cost per Conversion: relating to websites, landing pages, mobile, social media. Reach and Engagement: relating to social media. Customer Lifetime Value (LTV): a metric used to predict the profit you’ll generate from your relationship with your customers. KPIS KEY PERFORMANCE INDICATORS
  • 14.
    Get an understandingof your business and set objectives. Translate your objectives into attainable goals. Once you have determined your goals, you will select KPIs for each of these goals. Then use the KPIs to measure the performance of each goal. 1. 2. 3. 4. Goals are specific strategies you used to achieve your business objectives!! KPIS KEY PERFORMANCE INDICATORS
  • 15.
    You should assignspecific metrics (numbers) to each. You will likely refine these regularly as you monitor the data.
  • 16.
    Time spent ona website or specific page Repeat visits to the website Website bounce rate Number of pages or posts viewed Social engagement The number of email opens and clicks Engagement refers to how involved the site visitors or social media connections are with what you are doing on your sites. Increased engagement occurs with increases or improvements in the following metrics: METRICS ENGANGEMENT VS CONVERSION METRICS
  • 17.
    Sales (service orproduct) Contact form submission A call or live chat take up Request of more info Downloads of a brochure, ebook, white paper, infographic, user manual, etc. Conversions refer to the number of people who follow through with a desired, measurable action. Increased conversions occur with an increase in the following metrics: METRICS ENGANGEMENT VS CONVERSION METRICS
  • 18.
    METRICS Website traffic volume Websitetraffic referrals Email subscriber database growth Social media fans, connections and followers Back links Awareness refers to the company or brand the customer thinks of first when he or she needs a product or service. Essentially brand/company loyalty. Increased awareness occurs with an increase in the following metrics: AWARENESS METRICS
  • 19.
    Vanity metrics: Numbersor stats that look good on paper, but don’t really mean anything important. For example, site visitors, Facebook followers, Twitter followers and page views. Actionable metrics: Stats that tie to specific and repeatable tasks you can improve to assist with reaching your goals. For example, email opt-in rate, purchases, email open rate, and click-through-rate. METRICS VANITY VERSUS ACTIONABLE
  • 20.
    Return On Investment(ROI) - divide your gain from investment by the cost of investment. Cost Per Lead / Acquisition (CPL/CPA) - divide the total costs associated with acquisition by total new customers, within a specific time period. Bounce Rate Rate of Return Visitors Conversion Rate Unique visitors Source attribution METRICS ACTIONABLE METRICS
  • 21.
    The purpose ofmeasurement is ultimately to drive future improvements in performance Pick a date each month and use that day to review Ensure you compile a report that includes actionable items Share the report Set targets Ensure you also do a month to month comparison, as well as review year to year Look at industry standards Using tools to assist you will make life easier Ensure you assign the right people to the job MEASUREMENT MAKING IT A PRIORITY
  • 22.
    It's free. It's powerful. Youcan measure who visits your website, where they come from and how they’re interacting with your website. You can see if your social media and online marketing activity is proving useful. If you haven't already jumped onto GA here's why you should... GOOGLE ANALYTICS WHY
  • 23.
    Dimensions: A dimensionis a descriptive attribute of an object that can take different values. Some of the examples of dimensions that you see in Google Analytics include Browser, Exit Page, Screens, Session Duration, etc. Metrics: These are individual elements of dimensions which can be measured in the form of a sum or a ratio. Examples include Screen Views, Average Session Duration, Page or Session, etc. Sessions: It is a period of time during which a user is actively engaged with your website (within a date range). GOOGLE ANALYTICS GLOSSARY
  • 24.
    Users: They arethe ones who have had at least one session within the selected date range. It includes both new as well as returning users. Page Views: It is the total number of pages viewed. Pages/Session: It shows how many pages a visitor visited on your site. Here, repeated views of a single page are also counted. Bounce Rate: It shows visitor moved from your site after single page visit. GOOGLE ANALYTICS GLOSSARY
  • 25.
    Goals: It measuresthe number of times users complete specific actions on your site. Conversions: It is the number of times goals are completed on your website. Acquisition: It is how you acquire users. Campaigns: With Campaigns you can add parameters to any URL (from your site) so as to collect more information regarding your referral traffic. Behaviour: This set of data helps you to improve your content. GOOGLE ANALYTICS GLOSSARY
  • 26.
    Set up yourGA account using an email address you will ALWAYS have access to. Once you set up your GA account ensure you add to your website and double check it is working. Ensure you are filtering out your own traffic (IP address). Ensure you are filtering out BOT (junk) traffic. Connect your Google Search Console so you can see the keywords people are using to find your website. SETTING UP GA TOP TIPS
  • 27.
  • 28.
    Type of devicethey are on Where they are coming from Are they repeat or new users Interests Referral traffic Organic traffic Paid search Social Audience Reports - These reports tell you about the users that accessed your website. Acquisition Reports - These reports help determine how someone arrived at your site. GA TYPES OF REPORTS AUDIENCE & ACQUISITION
  • 29.
    Which pages didthe visit Which landing pages are most popular How long someone spent on selected pages Site search (if applicable) Downloads Contact form submission Sales/purchases Behaviour Reports – This report focuses on what users did on your website. Conversion Reports – These reports cover pages or actions that you hope visitors to your site will accomplish, and then be able to see how often those conversions occur GA TYPES OF REPORTS BEHAVIOUR & CONVERSION REPORTS
  • 30.
    Conversions (sales orleads) - (Conversion > Goal > Overview) measuring goals for lead conversions and eCommerce reports to track sales by channel. KPIS FOR GA KEY PERFORMANCE INDICATORS
  • 31.
    Average time onpage - (Behaviour > Site Content > All Pages). This is important in the context of what you are selling, whether it be services or products. Bounce rate - (Behaviour > Site Content > All Pages) A high bounce rate could mean your content is not engaging your audience and therefore you need to make some changes. Page Views - (Behaviour > Site Content > All Pages) This is particularly important when it comes to your objectives. For example, if you are trying to educate your audience with blogs it is important to understand are your blogs being viewed. KPIS FOR GA KEY PERFORMANCE INDICATORS
  • 32.
    Acquisition - Thisis important in telling you where your traffic is coming from. If you are putting a lot of effort into social media but not seeing traffic from that source you may need to reconsider your strategy. KPIS FOR GA KEY PERFORMANCE INDICATORS
  • 33.
    Number of visitors/pageviews to your website from social media Number of hash-tagged posts Number of “likes” Number of social shares Number of audiences reached through social networks SOCIAL MEDIA BRAND AWARENESS
  • 34.
    Growth rate offans and followers Average number of likes per post Average number of comments per post Average shares per post Number of advocates per month SOCIAL MEDIA ENGAGEMENT
  • 35.
    Number of subscribersto your email list Number of downloads Number of promotion redemptions Number of purchases Number of app downloads Number of calls and or contact submissions SOCIAL MEDIA CONVERSION
  • 36.
    Actions on Page:The combined total clicks for your contact information and call-to-action button Page views: Total views of your Facebook Page, including by people not logged into Facebook. Page Previews: The number of times people hovered their mouse over your Page information to see a preview of your Page. Page Likes: The number of new likes. Post reach: The number of people who saw your posts in their timeline. Story reach: The number of people who saw your Stories. FACEBOOK INSIGHTS SUMMARY
  • 37.
    Recommendations: The numberof people who recommended your Page. Post engagement: A combined total of post likes, comments, shares, and other engagements. Responsiveness: An evaluation of how often and how fast you respond to messages. Videos: The number of video views of three seconds of more. Page followers: The number of new followers Orders: Your orders and earnings. (if you are selling via Facebook). You then will see your latest posts (5 in total) and other pages to watch. FACEBOOK INSIGHTS SUMMARY
  • 39.
    Reach and engagement:How many people saw your posts and who interacted with them? Actions: What actions do people take on your Page such as visit your website? People: What are the demographics of the people who visit your Page? When do people visit your Page? Posts: How are your posts performing (and over different time periods). Did you know you can go back two years so you can really compare results over time. You can also export data to review and edit. FACEBOOK WHAT REALLY MATTERS
  • 41.
    LINKEDIN WHAT CAN YOUMONITOR Visitors: Data on people who visit your LinkedIn page Updates: Engagement metrics for content posted on your LinkedIn page Followers: Information about people who subscribe to your page. Did you know you can change the time period as well as aggregate mobile and desktop for certain metrics. You can also export data to review and edit.
  • 43.
    LINKEDIN MEASURING UPDATES Impressions: Thenumber of times a post was shown to LinkedIn users. Video Views: The number of times your video was watched. Clicks: The number of times your company name, content or logo has been clicked on. CTR: Click through rate (number of clicks divided by impressions) Interactions: The number of engagements on your post. Follows: The number of new followers you gained from a sponsored update. If your post is organic this will be empty. Engagement: The number of interactions divided by impressions.
  • 44.
    A social mediaadvertising clickthrough rate (CTR) of 2 - 5 % is deemed good.
  • 45.
    Page Views Unique Visitors CustomButton links Demographics Total followers New followers (per date range) Follower profiles (latest) Demographics Companies to track/monitor Visitor stats: Follower stats: LINKEDIN VISITORS & FOLLOWERS
  • 46.
    Tweet Impressions Top Tweets TweetEngagement & engagement rate Follower growth Profile visits Mentions Video Content Performance TWITTER WHAT MATTERS
  • 47.
  • 48.
    Impressions: The numberof times your posts have been seen during the specific time frame. Interactions: The number of actions taken on your account/profile. Reach: The number of unique Instagram accounts that have seen any of your posts. Profile Visits: The total number of profile views. Website Clicks: The number of times visitors have clicked the link to your website from your profile. Call/email clicks: the number of times visitors have clicked the call/email button from your profile. Mentions: the number of times your account’s handle has been mentioned by other Instagram users. INSTAGRAM PROFILE ANALYTICS
  • 49.
    Top locations: Thisinformation allows you to see the top five cities and countries where your followers come from. Age range: How old are your followers? This is an easy way to find out. Instagram breaks it down with the following ranges: 13-17, 18-24, 25-34, 35- 44, 45-54, 55-64, 65+. Gender: Male or female Most Active Times (hours): The average time of day your followers are on Instagram. Most Active Times (days): The days of the week your followers are most active. INSTAGRAM AUDIENCE ANALYTICS
  • 50.
    Interactions: Visits toyour profile, hyperlink clicks, or using the call/email button in your post. Discovery: The number of accounts reached through discovery who are not currently following you. Follows: How many new followers you received from a post. Reach: How many unique accounts the post reached. Impressions: The number of times your post was viewed. Saves: The number of unique accounts that saved your post to their personal saved folder Comments: The number of comments on your post INSTAGRAM POST ANALYTICS
  • 51.
    Impressions Reach Page Views Website linkclicks on social CTA button clicks on social Website clicks Engagement (comments in particular) If you want to increase your brand awareness: If you want to generate sales or leads: If you want to build a community or improve comms: REPORTING ANALYSING THE RESULTS
  • 52.
    SEO/website report –Traffic volumes, sources and conversions. PPC report – Click-through rates and cost-per- conversion data. Social media reports – Audience analytics and campaign data. Email marketing report – Click-through rates, engagement levels and conversion data. You may want to split your reports: REPORTING ANALYSING THE RESULTS
  • 53.
    High bounce rate- you may want to check your load speed. Low engagement rate - you may need to look at improving your posts & introduce video or imagery. Social media referral traffic is low - you may need to improve your social media content strategy and rate of posting. Low repeat users/traffic - you may want to take post more insightful dynamic content. Incomplete goals/low conversion - you may wan to assess whether your check out process or form is user friendly. Taking action: REPORTING ANALYSING THE RESULTS
  • 55.
  • 56.
    Google Analytics: analytics.google.com Settingup GA: https://www.orbitmedia.com/blog/how-to-setup-google- analytics/ Setting up a goal in GA: https://support.google.com/analytics/answer/1032415?hl=en 12 useful GA reports: https://neilpatel.com/blog/expert-google-analytics- reports/ Facebook insights: https://buffer.com/library/facebook-insights/ Twitter analytics: https://business.twitter.com/en/blog/7-useful-insights- twitter-analytics.html LinkedIn analytics: https://business.linkedin.com/marketing- solutions/reporting-analytics Social Media Reporting: https://sproutsocial.com/features/social-media- analytics/ Social Media Reporting: https://www.hootsuite.com USEFUL LINKS
  • 57.
    GET IN TOUCH jessica@afundi.im /jessicale merle www.afundi.im EMAIL ADDRESS LINKEDIN WEBSITE ADDRESS