Download as PDF, PPTX


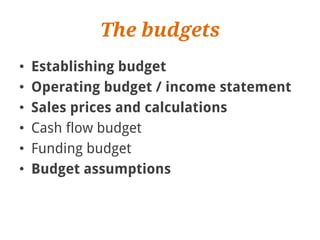
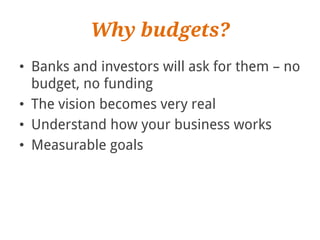


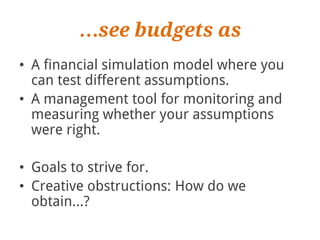
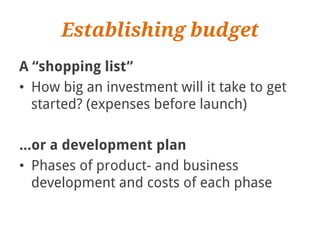
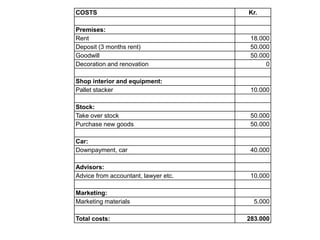
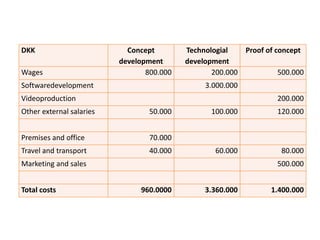

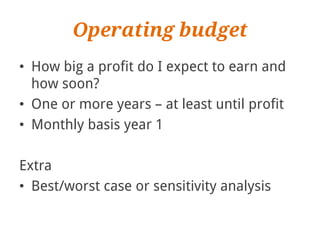
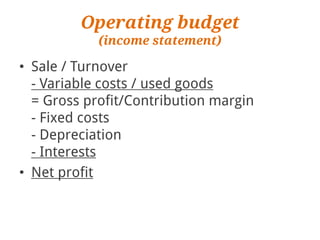
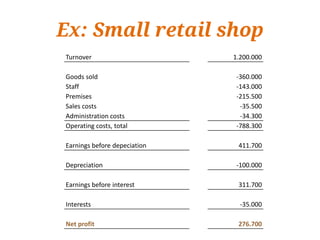
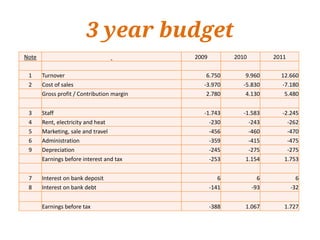
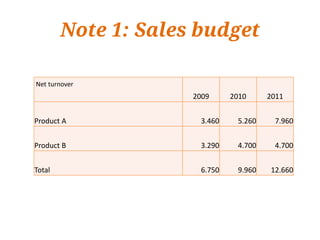
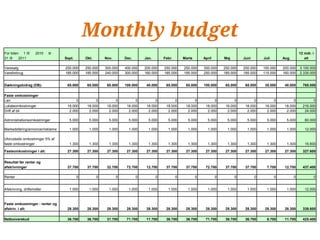
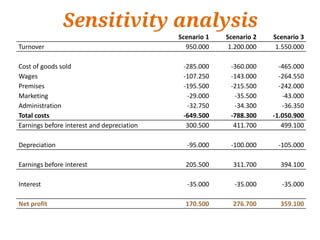
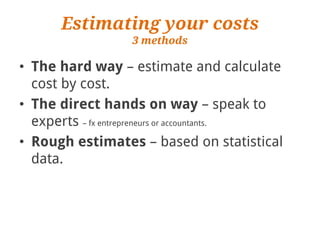


The document provides guidance on creating budgets for a new business. It discusses the importance of budgets for obtaining funding from investors and banks, and how budgets can help turn a business vision into measurable goals. It recommends establishing budgets for startup costs, operating costs, sales prices, cash flow, and funding needs. Sample budgets are provided, including operating budgets showing income statements and cash flow over multiple years. The document stresses that budgets should be used as a financial simulation and management tool rather than an attempt to precisely predict the future, as startups involve experimentation.


