Download as PDF, PPTX
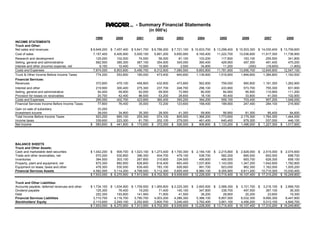
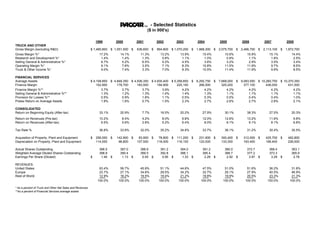
This document provides financial statements and selected statistics for PACRI from 1999-2008. It shows income statements, balance sheets, and key metrics for PACRI's Truck and Other business as well as its Financial Services business. Over this period, PACRI grew net income from $583.6 million in 1999 to $1.017 billion in 2008, while revenues declined slightly from $8.648 billion to $13.709 billion. International revenues increased as a percentage of total revenues from 36.6% to 68.2% during this time period.


