SlideShare a Scribd company logo
1 of 7
Download to read offline
UNISYS CORPORATION
            CONSOLIDATED STATEMENTS OF INCOME
            (Millions, except per share data)

                                       Three Months
                                      Ended March 31
                                    ------------------
                                      2006       2005
                                    --------   --------
Revenue
  Services                          $1,176.4    $1,107.7
  Technology                           211.4       258.9
                                    --------    --------
                                     1,387.8     1,366.6
Costs and expenses
  Cost of revenue:
    Services                         1,076.5       981.4
    Technology                         109.4       124.9
                                    --------    --------
                                     1,185.9     1,106.3
 Selling, general and
   administrative                      295.4     261.6
 Research and development               75.3      64.9
                                    --------  --------
                                     1,556.6   1,432.8
                                    --------  --------
Operating loss                        (168.8)    (66.2)

Interest expense                         19.8      12.6
Other income
  (expense), net                       153.4       0.5
                                    --------  --------
Loss before income taxes               (35.2)    (78.3)
Benefit for income taxes                (7.3)    (32.8)
                                    --------  --------
Net loss                              ($27.9)   ($45.5)
                                    ========  ========
Loss per share
Basic                                ($ .08) ($ .13)
                                    ======== ========
Diluted                              ($ .08) ($ .13)
                                    ======== ========
Shares used in the per share
  computations (thousands):
  Basic                              342,458     338,248
                                    ========    ========
  Diluted                            342,458     338,248
                                    ========    ========
UNISYS CORPORATION
                            SEGMENT RESULTS

                               (Millions)

                                        Elimi-
                             Total      nations    Services* Technology*
                            --------    --------   --------   ----------
Three Months Ended
March 31, 2006
------------------
Customer revenue            $1,387.8               $1,176.4      $211.4
Intersegment                             ($42.6)        3.4        39.2
                             --------   --------    --------    --------
Total revenue               $1,387.8     ($42.6)   $1,179.8      $250.6
                             ========   ========    ========    ========

Gross profit percent           14.5%                  15.2%       41.9%
                             ========               ========    ========
Operating loss
  percent                     (12.2%)                 (0.9%)      (5.4%)
                             ========               ========    ========
Three Months Ended
March 31, 2005
------------------
Customer revenue            $1,366.6               $1,107.7      $258.9
Intersegment                             ($59.9)        4.8        55.1
                             --------   --------    --------    --------
Total revenue               $1,366.6     ($59.9)   $1,112.5      $314.0
                             ========   ========    ========    ========

Gross profit percent           19.0%                  11.0%       47.7%
                             ========               ========    ========
Operating profit
  (loss) percent               (4.8%)                 (6.8%)       6.1%
                             ========               ========    ========

* 2006 results exclude charges for cost reductions and
related actions booked in March 2006
UNISYS CORPORATION
                     CONSOLIDATED BALANCE SHEETS
                              (Millions)
                                              March 31,    December 31,
                                                 2006          2005
                                             ----------     ----------
Assets
Current assets
  Cash and cash equivalents                     $980.2         $642.5
  Accounts and notes receivable, net           1,066.4        1,111.5
  Inventories
     Parts and finished equipment                  100.8        103.4
     Work in process and materials                  88.0         90.7
  Deferred income taxes                             88.1         68.2
  Prepaid expense and other
    current assets                                158.1         137.0
                                             ----------    ----------
 Total                                          2,481.6       2,153.3
                                             ----------    ----------
Properties                                      1,339.3       1,320.8
  Less accumulated depreciation
    and amortization                              963.7         934.4
                                             ----------    ----------
  Properties, net                                 375.6         386.4
                                             ----------    ----------
Outsourcing assets, net                           407.0         416.0
Marketable software, net                          320.4         327.6
Investments at equity                               1.1         207.8
Prepaid pension cost                            1,333.2          66.1
Deferred income taxes                             138.4         138.4
Goodwill                                          192.1         192.0
Other long-term assets                            138.3         141.3
                                             ----------    ----------
  Total                                        $5,387.7      $4,028.9
                                             ==========    ==========
Liabilities and stockholders' equity (deficit)
Current liabilities
  Notes payable                                   $19.7         $18.1
  Current maturities of long-term debt             58.7          58.8
  Accounts payable                                445.3         444.6
  Other accrued liabilities                     1,403.0       1,293.3
                                             ----------    ----------
  Total                                         1,926.7       1,814.8
                                             ----------    ----------
Long-term debt                                  1,049.1       1,049.0
Accrued pension liabilities                       351.9         506.9
Other long-term liabilities                       679.1         690.8
Stockholders' equity (deficit)
  Common stock                                      3.5           3.4
  Accumulated deficit                          (2,136.0)     (2,108.1)
  Other capital                                 3,922.8       3,917.0
  Accumulated other comprehensive loss           (409.4)     (1,844.9)
                                             ----------    ----------
  Stockholders' equity (deficit)                1,380.9         (32.6)
                                             ----------    ----------
  Total                                        $5,387.7      $4,028.9
                                             ==========    ==========
UNISYS CORPORATION
                   CONSOLIDATED STATEMENTS OF CASH FLOWS
                                (Millions)
                                                     Three Months Ended
                                                           March 31
                                                     -------------------
                                                      2006          2005
                                                     -------       -------
Cash flows from operating activities
Net loss                                              ($27.9)       ($45.5)
Add (deduct) items to reconcile
  net loss to net cash provided
  by operating activities:
Equity loss                                              4.3           4.3
Employee stock compensation
  expense (income)                                       1.7           (.4)
Depreciation and amortization
  of properties                                         30.3          30.0
Depreciation and amortization of
  outsourcing assets                                    35.0          34.7
Amortization of marketable software                     33.1          28.5
Gain on sale of NUL shares
  and other investments                               (153.2)
Increase in deferred income taxes, net                 (19.8)          (.3)
Decrease in receivables, net                            67.0          90.5
Decrease (increase) in inventories                       4.3          (6.5)
Increase (decrease) in accounts
  payable and other accrued liabilities                 94.5        (225.1)
(Decrease) increase in other
  liabilities                                          (14.6)         97.7
Increase in other assets                               (30.8)        (16.4)
Other                                                    3.0          35.3
                                                      -------       -------
Net cash provided by operating
  activities                                            26.9          26.8
                                                      -------       -------
Cash flows from investing activities
  Proceeds from investments                          1,869.3       1,779.9
  Purchases of investments                          (1,870.6)     (1,776.8)
  Investment in marketable software                    (27.1)        (33.0)
  Capital additions of properties                      (21.6)        (22.4)
  Capital additions of outsourcing assets              (24.6)        (41.9)
  Proceeds from sale of NUL shares
    and other investments                              380.6
                                                      -------       -------
Net cash provided by (used for)
  investing activities                                 306.0         (94.2)
                                                      -------       -------
Cash flows from financing activities
  Net proceeds from
    short-term borrowings                                1.6           1.7
  Proceeds from employee stock plans                       .6          6.6
  Payments of long-term debt                                        (150.3)
                                                      -------       -------
Net cash provided by (used for)
  financing activities                                   2.2        (142.0)
                                                      -------       -------
Effect of exchange rate changes on cash
  and cash equivalents                                   2.6          (9.5)
                                                      -------       -------
Increase (decrease) in cash
  and cash equivalents                                 337.7        (218.9)
Cash and cash equivalents, beginning of
  period                                               642.5         660.5
                                                      -------       -------
Cash and cash equivalents, end of period              $980.2        $441.6
                                                      =======       =======
Reconciliation of GAAP to Non-GAAP
Financial Information

The preceding release presents information with and
without pension expense. Unisys believes that this
information will enhance an overall understanding
of its financial performance due to the significant
change in pension expense from period to period
and the non-operational nature of pension expense.
The presentation of non-GAAP information is not
meant to be considered in isolation or as a substitute
for results prepared in accordance with accounting
principles generally accepted in the United States.
UNISYS CORPORATION
                   RECONCILIATION OF GAAP TO NON-GAAP
                   CONSOLIDATED STATEMENTS OF INCOME
                   (Millions, except per share data)

                                             Three Months Ended
                                               March 31, 2006
                                       ----------------------------
                                       US GAAP       Less      Without
                                          as       Pension     Pension
                                       Reported    Expense     Expense
                                      --------    --------   --------
Revenue                               $1,387.8                $1,387.8

Costs and expenses
  Cost of revenue                      1,185.9      ($7.7)     1,178.2
  Selling, general and
    administrative                       295.4      (1.8)        293.6
  Research and development                75.3       1.6          76.9
                                      --------  --------      --------
                                       1,556.6      (7.9)      1,548.7
                                      --------  --------      --------
Operating loss                          (168.8)      7.9        (160.9)

Interest expense                          19.8                    19.8
Other income
  (expense), net                         153.4                   153.4
                                      --------    --------    --------
Loss before
  income taxes                           (35.2)         7.9      (27.3)
Benefit for
  income taxes                            (7.3)      5.8          (1.5)
                                      --------  --------      --------
Net loss                                ($27.9)     $2.1        ($25.8)
                                      ========  ========      ========
Loss per share                         ($ .08)    $ .00        ($ .08)
                                      ========  ========      ========

                                             Three Months Ended
                                               March 31, 2005
                                       ----------------------------
                                       US GAAP       Less      Without
                                          as       Pension     Pension
                                       Reported    Expense     Expense
                                      --------    --------   --------
Revenue                               $1,366.6                $1,366.6

Costs and expenses
  Cost of revenue                      1,106.3     ($32.8)     1,073.5
  Selling, general and
    administrative                       261.6      (9.1)        252.5
  Research and development                64.9      (4.9)         60.0
                                      --------  --------      --------
                                       1,432.8     (46.8)      1,386.0
                                      --------  --------      --------
Operating loss                           (66.2)     46.8         (19.4)

Interest expense                          12.6                    12.6
Other income
  (expense), net                           0.5                     0.5
                                      --------    --------    --------
Loss before
  income taxes                           (78.3)      46.8        (31.5)
Benefit for
  income taxes                           (32.8)     15.0         (17.8)
                                      --------  --------      --------
Net loss                                ($45.5)    $31.8        ($13.7)
                                      ========  ========      ========
Loss per share                         ($ .13)    $ .09        ($ .04)
                                      ========  ========      ========
UNISYS CORPORATION
             RECONCILIATION OF GAAP TO NON-GAAP
                SEGMENT RESULTS OF OPERATIONS
                         (Millions)

                                    Three Months Ended
                                      March 31, 2006
                               ----------------------------
                                           Less     Without
                                  As      Pension   Pension
                               Reported Expense     Expense
                               -------- -------- --------
Services Segment *
   Total revenue               $1,179.8           $1,179.8
   Gross profit                   179.1    ($8.1)    187.2
     % of revenue                  15.2%              15.9%
   Operating loss                 (10.5)    (9.6)     (0.9)
     % of revenue                  -0.9%              -0.1%

Technology Segment *
   Total revenue                  250.6                  250.6
   Gross profit                   105.1      0.4         104.7
     % of revenue                  41.9%                  41.8%
   Operating loss                 (13.5)     1.7         (15.2)
     % of revenue                  -5.4%                  -6.1%

Total Company
   Total revenue                1,387.8              1,387.8
   Gross profit                   201.9     (7.7)      209.6
     % of revenue                  14.5%                15.1%
   Operating loss                (168.8)    (7.9)     (160.9)
     % of revenue                 -12.2%               -11.6%
                                    Three Months Ended
                                      March 31, 2005
                               ----------------------------
                                           Less     Without
                                  As      Pension   Pension
                               Reported Expense     Expense
                               -------- -------- --------
Services Segment
   Total revenue               $1,112.5           $1,112.5
   Gross profit                   122.2    ($31.8)   154.0
     % of revenue                  11.0%              13.8%
   Operating loss                 (75.1)   (39.4)    (35.7)
     % of revenue                  -6.8%              -3.2%

Technology Segment
   Total revenue                  314.0                  314.0
   Gross profit                   149.7     (1.0)        150.7
     % of revenue                  47.7%                  48.0%
   Operating income                19.3     (7.4)         26.7
     % of revenue                   6.1%                   8.5%

Total Company
   Total revenue                1,366.6              1,366.6
   Gross profit                   260.3    (32.8)      293.1
     % of revenue                  19.0%                21.4%
   Operating loss                 (66.2)   (46.8)      (19.4)
     % of revenue                  -4.8%                -1.4%
* 2006 results exclude charges for cost reductions and
related actions booked in March 2006

More Related Content

What's hot

unisys 4Q08_SPR
unisys 4Q08_SPRunisys 4Q08_SPR
unisys 4Q08_SPRfinance36
 
unisys 4Q06_SPR
unisys 4Q06_SPRunisys 4Q06_SPR
unisys 4Q06_SPRfinance36
 
unisys 2Q07_SPR
unisys 2Q07_SPRunisys 2Q07_SPR
unisys 2Q07_SPRfinance36
 
unisys 2Q08_SPR
unisys 2Q08_SPRunisys 2Q08_SPR
unisys 2Q08_SPRfinance36
 
unisys 2Q04_SPR
unisys 2Q04_SPRunisys 2Q04_SPR
unisys 2Q04_SPRfinance36
 
unisys 4Q07_SPR
unisys 4Q07_SPRunisys 4Q07_SPR
unisys 4Q07_SPRfinance36
 
unisys 3Q08_SPR
unisys 3Q08_SPRunisys 3Q08_SPR
unisys 3Q08_SPRfinance36
 
unisys 2001_1Q_10Q
unisys 2001_1Q_10Qunisys 2001_1Q_10Q
unisys 2001_1Q_10Qfinance36
 
unisys 2001_2Q_10Q
unisys 2001_2Q_10Qunisys 2001_2Q_10Q
unisys 2001_2Q_10Qfinance36
 
unisys 3Q04_SPR
unisys 3Q04_SPRunisys 3Q04_SPR
unisys 3Q04_SPRfinance36
 
unisys 2001_3Q_10Q
unisys 2001_3Q_10Qunisys 2001_3Q_10Q
unisys 2001_3Q_10Qfinance36
 
unisys 3Q05_SPR
unisys 3Q05_SPRunisys 3Q05_SPR
unisys 3Q05_SPRfinance36
 
unisys 2002_2Q_10Q
unisys 2002_2Q_10Qunisys 2002_2Q_10Q
unisys 2002_2Q_10Qfinance36
 
unisys 3Q06_SPR
unisys 3Q06_SPRunisys 3Q06_SPR
unisys 3Q06_SPRfinance36
 
unisys 2005_3Q_10Q
unisys 2005_3Q_10Qunisys 2005_3Q_10Q
unisys 2005_3Q_10Qfinance36
 
unisys 2005_1Q_10Q
unisys 2005_1Q_10Qunisys 2005_1Q_10Q
unisys 2005_1Q_10Qfinance36
 
MHK-ar1999_financial
MHK-ar1999_financialMHK-ar1999_financial
MHK-ar1999_financialfinance30
 
unisys 2Q04_10Q
unisys 2Q04_10Qunisys 2Q04_10Q
unisys 2Q04_10Qfinance36
 

What's hot (18)

unisys 4Q08_SPR
unisys 4Q08_SPRunisys 4Q08_SPR
unisys 4Q08_SPR
 
unisys 4Q06_SPR
unisys 4Q06_SPRunisys 4Q06_SPR
unisys 4Q06_SPR
 
unisys 2Q07_SPR
unisys 2Q07_SPRunisys 2Q07_SPR
unisys 2Q07_SPR
 
unisys 2Q08_SPR
unisys 2Q08_SPRunisys 2Q08_SPR
unisys 2Q08_SPR
 
unisys 2Q04_SPR
unisys 2Q04_SPRunisys 2Q04_SPR
unisys 2Q04_SPR
 
unisys 4Q07_SPR
unisys 4Q07_SPRunisys 4Q07_SPR
unisys 4Q07_SPR
 
unisys 3Q08_SPR
unisys 3Q08_SPRunisys 3Q08_SPR
unisys 3Q08_SPR
 
unisys 2001_1Q_10Q
unisys 2001_1Q_10Qunisys 2001_1Q_10Q
unisys 2001_1Q_10Q
 
unisys 2001_2Q_10Q
unisys 2001_2Q_10Qunisys 2001_2Q_10Q
unisys 2001_2Q_10Q
 
unisys 3Q04_SPR
unisys 3Q04_SPRunisys 3Q04_SPR
unisys 3Q04_SPR
 
unisys 2001_3Q_10Q
unisys 2001_3Q_10Qunisys 2001_3Q_10Q
unisys 2001_3Q_10Q
 
unisys 3Q05_SPR
unisys 3Q05_SPRunisys 3Q05_SPR
unisys 3Q05_SPR
 
unisys 2002_2Q_10Q
unisys 2002_2Q_10Qunisys 2002_2Q_10Q
unisys 2002_2Q_10Q
 
unisys 3Q06_SPR
unisys 3Q06_SPRunisys 3Q06_SPR
unisys 3Q06_SPR
 
unisys 2005_3Q_10Q
unisys 2005_3Q_10Qunisys 2005_3Q_10Q
unisys 2005_3Q_10Q
 
unisys 2005_1Q_10Q
unisys 2005_1Q_10Qunisys 2005_1Q_10Q
unisys 2005_1Q_10Q
 
MHK-ar1999_financial
MHK-ar1999_financialMHK-ar1999_financial
MHK-ar1999_financial
 
unisys 2Q04_10Q
unisys 2Q04_10Qunisys 2Q04_10Q
unisys 2Q04_10Q
 

Viewers also liked

unisys 2004_4Q_10K
unisys 2004_4Q_10Kunisys 2004_4Q_10K
unisys 2004_4Q_10Kfinance36
 
Hexion 3CEE2ED8-8446-4BEA-B451-85C020EE965F_4Q2008InvestorCallFinal
Hexion 3CEE2ED8-8446-4BEA-B451-85C020EE965F_4Q2008InvestorCallFinalHexion 3CEE2ED8-8446-4BEA-B451-85C020EE965F_4Q2008InvestorCallFinal
Hexion 3CEE2ED8-8446-4BEA-B451-85C020EE965F_4Q2008InvestorCallFinalfinance36
 
unisys 10308921
unisys 10308921unisys 10308921
unisys 10308921finance36
 
unisys 2007_4Q_10K
unisys 2007_4Q_10Kunisys 2007_4Q_10K
unisys 2007_4Q_10Kfinance36
 
HXN2007Q2ConfCallFinal
HXN2007Q2ConfCallFinalHXN2007Q2ConfCallFinal
HXN2007Q2ConfCallFinalfinance36
 
micron technollogy 2006_8-K_Lexar_FINAL
micron technollogy 2006_8-K_Lexar_FINALmicron technollogy 2006_8-K_Lexar_FINAL
micron technollogy 2006_8-K_Lexar_FINALfinance36
 
micron technollogy 8-K_082205_nicholson
micron technollogy 8-K_082205_nicholsonmicron technollogy 8-K_082205_nicholson
micron technollogy 8-K_082205_nicholsonfinance36
 
micron technollogy 8-K_111804_Incentive_Plan
micron technollogy 8-K_111804_Incentive_Planmicron technollogy 8-K_111804_Incentive_Plan
micron technollogy 8-K_111804_Incentive_Planfinance36
 
unisys 07248801
unisys 07248801unisys 07248801
unisys 07248801finance36
 
micron technollogy other_events2006_9_06
micron technollogy other_events2006_9_06micron technollogy other_events2006_9_06
micron technollogy other_events2006_9_06finance36
 
micron technollogy entry_into_materials_definitive_agreement_053006
micron technollogy entry_into_materials_definitive_agreement_053006micron technollogy entry_into_materials_definitive_agreement_053006
micron technollogy entry_into_materials_definitive_agreement_053006finance36
 
Hexion Q307lEarningsCall
Hexion Q307lEarningsCallHexion Q307lEarningsCall
Hexion Q307lEarningsCallfinance36
 
unisys 2006_3Q_10Q
unisys 2006_3Q_10Qunisys 2006_3Q_10Q
unisys 2006_3Q_10Qfinance36
 

Viewers also liked (13)

unisys 2004_4Q_10K
unisys 2004_4Q_10Kunisys 2004_4Q_10K
unisys 2004_4Q_10K
 
Hexion 3CEE2ED8-8446-4BEA-B451-85C020EE965F_4Q2008InvestorCallFinal
Hexion 3CEE2ED8-8446-4BEA-B451-85C020EE965F_4Q2008InvestorCallFinalHexion 3CEE2ED8-8446-4BEA-B451-85C020EE965F_4Q2008InvestorCallFinal
Hexion 3CEE2ED8-8446-4BEA-B451-85C020EE965F_4Q2008InvestorCallFinal
 
unisys 10308921
unisys 10308921unisys 10308921
unisys 10308921
 
unisys 2007_4Q_10K
unisys 2007_4Q_10Kunisys 2007_4Q_10K
unisys 2007_4Q_10K
 
HXN2007Q2ConfCallFinal
HXN2007Q2ConfCallFinalHXN2007Q2ConfCallFinal
HXN2007Q2ConfCallFinal
 
micron technollogy 2006_8-K_Lexar_FINAL
micron technollogy 2006_8-K_Lexar_FINALmicron technollogy 2006_8-K_Lexar_FINAL
micron technollogy 2006_8-K_Lexar_FINAL
 
micron technollogy 8-K_082205_nicholson
micron technollogy 8-K_082205_nicholsonmicron technollogy 8-K_082205_nicholson
micron technollogy 8-K_082205_nicholson
 
micron technollogy 8-K_111804_Incentive_Plan
micron technollogy 8-K_111804_Incentive_Planmicron technollogy 8-K_111804_Incentive_Plan
micron technollogy 8-K_111804_Incentive_Plan
 
unisys 07248801
unisys 07248801unisys 07248801
unisys 07248801
 
micron technollogy other_events2006_9_06
micron technollogy other_events2006_9_06micron technollogy other_events2006_9_06
micron technollogy other_events2006_9_06
 
micron technollogy entry_into_materials_definitive_agreement_053006
micron technollogy entry_into_materials_definitive_agreement_053006micron technollogy entry_into_materials_definitive_agreement_053006
micron technollogy entry_into_materials_definitive_agreement_053006
 
Hexion Q307lEarningsCall
Hexion Q307lEarningsCallHexion Q307lEarningsCall
Hexion Q307lEarningsCall
 
unisys 2006_3Q_10Q
unisys 2006_3Q_10Qunisys 2006_3Q_10Q
unisys 2006_3Q_10Q
 

Similar to unisys 1Q06_SPR

unisys 2Q04_SPR
unisys 2Q04_SPRunisys 2Q04_SPR
unisys 2Q04_SPRfinance36
 
unisys 2Q04_SPR
unisys 2Q04_SPRunisys 2Q04_SPR
unisys 2Q04_SPRfinance36
 
unisys 2002_3Q_10Q
unisys 2002_3Q_10Qunisys 2002_3Q_10Q
unisys 2002_3Q_10Qfinance36
 
unisys 2005_2Q_10Q
unisys 2005_2Q_10Qunisys 2005_2Q_10Q
unisys 2005_2Q_10Qfinance36
 
unisys 2003_1Q_10Q
unisys 2003_1Q_10Qunisys 2003_1Q_10Q
unisys 2003_1Q_10Qfinance36
 
u.s.bancorp3Q 2004 Business Line Schedules
u.s.bancorp3Q 2004 Business Line Schedules  u.s.bancorp3Q 2004 Business Line Schedules
u.s.bancorp3Q 2004 Business Line Schedules finance13
 
Maxim 2Q FISCAL 2009 RESULTS
Maxim 2Q FISCAL 2009 RESULTSMaxim 2Q FISCAL 2009 RESULTS
Maxim 2Q FISCAL 2009 RESULTSearningsreport
 
Verizon Reports Sustained Revenue Growth and Continued Strong Cash Flows fo...
 	Verizon Reports Sustained Revenue Growth and Continued Strong Cash Flows fo... 	Verizon Reports Sustained Revenue Growth and Continued Strong Cash Flows fo...
Verizon Reports Sustained Revenue Growth and Continued Strong Cash Flows fo...finance2
 
aetna table 2007 1st
aetna table 2007 1staetna table 2007 1st
aetna table 2007 1stfinance9
 
aetna table 2006 4th
aetna table 2006 4thaetna table 2006 4th
aetna table 2006 4thfinance9
 
4Q06OpStats_FNAL_022307
4Q06OpStats_FNAL_0223074Q06OpStats_FNAL_022307
4Q06OpStats_FNAL_022307finance49
 
4Q06OpStats_FNAL_022307
4Q06OpStats_FNAL_0223074Q06OpStats_FNAL_022307
4Q06OpStats_FNAL_022307finance49
 

Similar to unisys 1Q06_SPR (14)

unisys 2Q04_SPR
unisys 2Q04_SPRunisys 2Q04_SPR
unisys 2Q04_SPR
 
unisys 2Q04_SPR
unisys 2Q04_SPRunisys 2Q04_SPR
unisys 2Q04_SPR
 
unisys 2002_3Q_10Q
unisys 2002_3Q_10Qunisys 2002_3Q_10Q
unisys 2002_3Q_10Q
 
Q1 2009 Earning Report of Metals Usa Inc.
Q1 2009 Earning Report of Metals Usa Inc.Q1 2009 Earning Report of Metals Usa Inc.
Q1 2009 Earning Report of Metals Usa Inc.
 
unisys 2005_2Q_10Q
unisys 2005_2Q_10Qunisys 2005_2Q_10Q
unisys 2005_2Q_10Q
 
Q1 2009 Earning Report of Stockeryale Inc.
Q1 2009 Earning Report of Stockeryale Inc.Q1 2009 Earning Report of Stockeryale Inc.
Q1 2009 Earning Report of Stockeryale Inc.
 
unisys 2003_1Q_10Q
unisys 2003_1Q_10Qunisys 2003_1Q_10Q
unisys 2003_1Q_10Q
 
u.s.bancorp3Q 2004 Business Line Schedules
u.s.bancorp3Q 2004 Business Line Schedules  u.s.bancorp3Q 2004 Business Line Schedules
u.s.bancorp3Q 2004 Business Line Schedules
 
Maxim 2Q FISCAL 2009 RESULTS
Maxim 2Q FISCAL 2009 RESULTSMaxim 2Q FISCAL 2009 RESULTS
Maxim 2Q FISCAL 2009 RESULTS
 
Verizon Reports Sustained Revenue Growth and Continued Strong Cash Flows fo...
 	Verizon Reports Sustained Revenue Growth and Continued Strong Cash Flows fo... 	Verizon Reports Sustained Revenue Growth and Continued Strong Cash Flows fo...
Verizon Reports Sustained Revenue Growth and Continued Strong Cash Flows fo...
 
aetna table 2007 1st
aetna table 2007 1staetna table 2007 1st
aetna table 2007 1st
 
aetna table 2006 4th
aetna table 2006 4thaetna table 2006 4th
aetna table 2006 4th
 
4Q06OpStats_FNAL_022307
4Q06OpStats_FNAL_0223074Q06OpStats_FNAL_022307
4Q06OpStats_FNAL_022307
 
4Q06OpStats_FNAL_022307
4Q06OpStats_FNAL_0223074Q06OpStats_FNAL_022307
4Q06OpStats_FNAL_022307
 

More from finance36

unisys 2001_10K
unisys 2001_10Kunisys 2001_10K
unisys 2001_10Kfinance36
 
unisys 2002_1Q_10Q
unisys 2002_1Q_10Qunisys 2002_1Q_10Q
unisys 2002_1Q_10Qfinance36
 
unisys 2002_10K
unisys 2002_10Kunisys 2002_10K
unisys 2002_10Kfinance36
 
unisys 2003_2Q_10Q
unisys 2003_2Q_10Qunisys 2003_2Q_10Q
unisys 2003_2Q_10Qfinance36
 
unisys 2003_3Q_10Q
unisys 2003_3Q_10Qunisys 2003_3Q_10Q
unisys 2003_3Q_10Qfinance36
 
unisys 2003_4Q_10K
unisys 2003_4Q_10Kunisys 2003_4Q_10K
unisys 2003_4Q_10Kfinance36
 
unisys 1Q04_10Q
unisys 1Q04_10Qunisys 1Q04_10Q
unisys 1Q04_10Qfinance36
 
unisys 3Q04_10Q
unisys 3Q04_10Qunisys 3Q04_10Q
unisys 3Q04_10Qfinance36
 
unisys 2005_4Q_10K
unisys 2005_4Q_10Kunisys 2005_4Q_10K
unisys 2005_4Q_10Kfinance36
 

More from finance36 (9)

unisys 2001_10K
unisys 2001_10Kunisys 2001_10K
unisys 2001_10K
 
unisys 2002_1Q_10Q
unisys 2002_1Q_10Qunisys 2002_1Q_10Q
unisys 2002_1Q_10Q
 
unisys 2002_10K
unisys 2002_10Kunisys 2002_10K
unisys 2002_10K
 
unisys 2003_2Q_10Q
unisys 2003_2Q_10Qunisys 2003_2Q_10Q
unisys 2003_2Q_10Q
 
unisys 2003_3Q_10Q
unisys 2003_3Q_10Qunisys 2003_3Q_10Q
unisys 2003_3Q_10Q
 
unisys 2003_4Q_10K
unisys 2003_4Q_10Kunisys 2003_4Q_10K
unisys 2003_4Q_10K
 
unisys 1Q04_10Q
unisys 1Q04_10Qunisys 1Q04_10Q
unisys 1Q04_10Q
 
unisys 3Q04_10Q
unisys 3Q04_10Qunisys 3Q04_10Q
unisys 3Q04_10Q
 
unisys 2005_4Q_10K
unisys 2005_4Q_10Kunisys 2005_4Q_10K
unisys 2005_4Q_10K
 

Recently uploaded

Certified Kala Jadu, Black magic specialist in Rawalpindi and Bangali Amil ba...
Certified Kala Jadu, Black magic specialist in Rawalpindi and Bangali Amil ba...Certified Kala Jadu, Black magic specialist in Rawalpindi and Bangali Amil ba...
Certified Kala Jadu, Black magic specialist in Rawalpindi and Bangali Amil ba...batoole333
 
Famous Kala Jadu, Black magic expert in Oman Or Kala ilam expert in Kuwait
Famous Kala Jadu, Black magic expert in Oman Or Kala ilam expert in KuwaitFamous Kala Jadu, Black magic expert in Oman Or Kala ilam expert in Kuwait
Famous Kala Jadu, Black magic expert in Oman Or Kala ilam expert in Kuwaitbatoole333
 
Black magic specialist in Canada (Kala ilam specialist in UK) Bangali Amil ba...
Black magic specialist in Canada (Kala ilam specialist in UK) Bangali Amil ba...Black magic specialist in Canada (Kala ilam specialist in UK) Bangali Amil ba...
Black magic specialist in Canada (Kala ilam specialist in UK) Bangali Amil ba...batoole333
 
najoomi asli amil baba kala jadu expert rawalpindi bangladesh uk usa
najoomi asli amil baba kala jadu expert rawalpindi bangladesh uk usanajoomi asli amil baba kala jadu expert rawalpindi bangladesh uk usa
najoomi asli amil baba kala jadu expert rawalpindi bangladesh uk usamazhshah570
 
asli amil baba bengali black magic kala jadu expert in uk usa canada france c...
asli amil baba bengali black magic kala jadu expert in uk usa canada france c...asli amil baba bengali black magic kala jadu expert in uk usa canada france c...
asli amil baba bengali black magic kala jadu expert in uk usa canada france c...israjan914
 
cost-volume-profit analysis.ppt(managerial accounting).pptx
cost-volume-profit analysis.ppt(managerial accounting).pptxcost-volume-profit analysis.ppt(managerial accounting).pptx
cost-volume-profit analysis.ppt(managerial accounting).pptxazadalisthp2020i
 
20240514-Calibre-Q1-2024-Conference-Call-Presentation.pdf
20240514-Calibre-Q1-2024-Conference-Call-Presentation.pdf20240514-Calibre-Q1-2024-Conference-Call-Presentation.pdf
20240514-Calibre-Q1-2024-Conference-Call-Presentation.pdfAdnet Communications
 
GIFT City Overview India's Gateway to Global Finance
GIFT City Overview  India's Gateway to Global FinanceGIFT City Overview  India's Gateway to Global Finance
GIFT City Overview India's Gateway to Global FinanceGaurav Kanudawala
 
APPLIED ECONOMICS Sept 9FGHFGHFHGFGHFHGFHGFH
APPLIED ECONOMICS Sept 9FGHFGHFHGFGHFHGFHGFHAPPLIED ECONOMICS Sept 9FGHFGHFHGFGHFHGFHGFH
APPLIED ECONOMICS Sept 9FGHFGHFHGFGHFHGFHGFHgeloencina777
 
Benefits & Risk Of Stock Loans
Benefits & Risk Of Stock LoansBenefits & Risk Of Stock Loans
Benefits & Risk Of Stock LoansMartinRowse
 
Lion One Corporate Presentation May 2024
Lion One Corporate Presentation May 2024Lion One Corporate Presentation May 2024
Lion One Corporate Presentation May 2024Adnet Communications
 
No 1 Top Love marriage specialist baba ji amil baba kala ilam powerful vashik...
No 1 Top Love marriage specialist baba ji amil baba kala ilam powerful vashik...No 1 Top Love marriage specialist baba ji amil baba kala ilam powerful vashik...
No 1 Top Love marriage specialist baba ji amil baba kala ilam powerful vashik...batoole333
 
Q1 2024 Conference Call Presentation vF.pdf
Q1 2024 Conference Call Presentation vF.pdfQ1 2024 Conference Call Presentation vF.pdf
Q1 2024 Conference Call Presentation vF.pdfAdnet Communications
 
Bank of Tomorrow White Paper For Reading
Bank of Tomorrow White Paper For ReadingBank of Tomorrow White Paper For Reading
Bank of Tomorrow White Paper For ReadingNghiaPham100
 
Production and Cost of the firm with curves
Production and Cost of the firm with curvesProduction and Cost of the firm with curves
Production and Cost of the firm with curvesArifa Saeed
 
Black magic specialist in Saudi Arabia (Kala jadu expert in UK) Bangali Amil ...
Black magic specialist in Saudi Arabia (Kala jadu expert in UK) Bangali Amil ...Black magic specialist in Saudi Arabia (Kala jadu expert in UK) Bangali Amil ...
Black magic specialist in Saudi Arabia (Kala jadu expert in UK) Bangali Amil ...batoole333
 
Strategic Resources May 2024 Corporate Presentation
Strategic Resources May 2024 Corporate PresentationStrategic Resources May 2024 Corporate Presentation
Strategic Resources May 2024 Corporate PresentationAdnet Communications
 
Retail sector trends for 2024 | European Business Review
Retail sector trends for 2024  | European Business ReviewRetail sector trends for 2024  | European Business Review
Retail sector trends for 2024 | European Business ReviewAntonis Zairis
 

Recently uploaded (20)

Certified Kala Jadu, Black magic specialist in Rawalpindi and Bangali Amil ba...
Certified Kala Jadu, Black magic specialist in Rawalpindi and Bangali Amil ba...Certified Kala Jadu, Black magic specialist in Rawalpindi and Bangali Amil ba...
Certified Kala Jadu, Black magic specialist in Rawalpindi and Bangali Amil ba...
 
Famous Kala Jadu, Black magic expert in Oman Or Kala ilam expert in Kuwait
Famous Kala Jadu, Black magic expert in Oman Or Kala ilam expert in KuwaitFamous Kala Jadu, Black magic expert in Oman Or Kala ilam expert in Kuwait
Famous Kala Jadu, Black magic expert in Oman Or Kala ilam expert in Kuwait
 
Abortion pills in Dammam Saudi Arabia | +966572737505 |Get Cytotec
Abortion pills in Dammam Saudi Arabia | +966572737505 |Get CytotecAbortion pills in Dammam Saudi Arabia | +966572737505 |Get Cytotec
Abortion pills in Dammam Saudi Arabia | +966572737505 |Get Cytotec
 
Black magic specialist in Canada (Kala ilam specialist in UK) Bangali Amil ba...
Black magic specialist in Canada (Kala ilam specialist in UK) Bangali Amil ba...Black magic specialist in Canada (Kala ilam specialist in UK) Bangali Amil ba...
Black magic specialist in Canada (Kala ilam specialist in UK) Bangali Amil ba...
 
najoomi asli amil baba kala jadu expert rawalpindi bangladesh uk usa
najoomi asli amil baba kala jadu expert rawalpindi bangladesh uk usanajoomi asli amil baba kala jadu expert rawalpindi bangladesh uk usa
najoomi asli amil baba kala jadu expert rawalpindi bangladesh uk usa
 
asli amil baba bengali black magic kala jadu expert in uk usa canada france c...
asli amil baba bengali black magic kala jadu expert in uk usa canada france c...asli amil baba bengali black magic kala jadu expert in uk usa canada france c...
asli amil baba bengali black magic kala jadu expert in uk usa canada france c...
 
cost-volume-profit analysis.ppt(managerial accounting).pptx
cost-volume-profit analysis.ppt(managerial accounting).pptxcost-volume-profit analysis.ppt(managerial accounting).pptx
cost-volume-profit analysis.ppt(managerial accounting).pptx
 
20240514-Calibre-Q1-2024-Conference-Call-Presentation.pdf
20240514-Calibre-Q1-2024-Conference-Call-Presentation.pdf20240514-Calibre-Q1-2024-Conference-Call-Presentation.pdf
20240514-Calibre-Q1-2024-Conference-Call-Presentation.pdf
 
GIFT City Overview India's Gateway to Global Finance
GIFT City Overview  India's Gateway to Global FinanceGIFT City Overview  India's Gateway to Global Finance
GIFT City Overview India's Gateway to Global Finance
 
APPLIED ECONOMICS Sept 9FGHFGHFHGFGHFHGFHGFH
APPLIED ECONOMICS Sept 9FGHFGHFHGFGHFHGFHGFHAPPLIED ECONOMICS Sept 9FGHFGHFHGFGHFHGFHGFH
APPLIED ECONOMICS Sept 9FGHFGHFHGFGHFHGFHGFH
 
Benefits & Risk Of Stock Loans
Benefits & Risk Of Stock LoansBenefits & Risk Of Stock Loans
Benefits & Risk Of Stock Loans
 
Lion One Corporate Presentation May 2024
Lion One Corporate Presentation May 2024Lion One Corporate Presentation May 2024
Lion One Corporate Presentation May 2024
 
No 1 Top Love marriage specialist baba ji amil baba kala ilam powerful vashik...
No 1 Top Love marriage specialist baba ji amil baba kala ilam powerful vashik...No 1 Top Love marriage specialist baba ji amil baba kala ilam powerful vashik...
No 1 Top Love marriage specialist baba ji amil baba kala ilam powerful vashik...
 
Q1 2024 Conference Call Presentation vF.pdf
Q1 2024 Conference Call Presentation vF.pdfQ1 2024 Conference Call Presentation vF.pdf
Q1 2024 Conference Call Presentation vF.pdf
 
Bank of Tomorrow White Paper For Reading
Bank of Tomorrow White Paper For ReadingBank of Tomorrow White Paper For Reading
Bank of Tomorrow White Paper For Reading
 
Obat Penggugur Kandungan Aman Bagi Ibu Menyusui 087776558899
Obat Penggugur Kandungan Aman Bagi Ibu Menyusui  087776558899Obat Penggugur Kandungan Aman Bagi Ibu Menyusui  087776558899
Obat Penggugur Kandungan Aman Bagi Ibu Menyusui 087776558899
 
Production and Cost of the firm with curves
Production and Cost of the firm with curvesProduction and Cost of the firm with curves
Production and Cost of the firm with curves
 
Black magic specialist in Saudi Arabia (Kala jadu expert in UK) Bangali Amil ...
Black magic specialist in Saudi Arabia (Kala jadu expert in UK) Bangali Amil ...Black magic specialist in Saudi Arabia (Kala jadu expert in UK) Bangali Amil ...
Black magic specialist in Saudi Arabia (Kala jadu expert in UK) Bangali Amil ...
 
Strategic Resources May 2024 Corporate Presentation
Strategic Resources May 2024 Corporate PresentationStrategic Resources May 2024 Corporate Presentation
Strategic Resources May 2024 Corporate Presentation
 
Retail sector trends for 2024 | European Business Review
Retail sector trends for 2024  | European Business ReviewRetail sector trends for 2024  | European Business Review
Retail sector trends for 2024 | European Business Review
 

unisys 1Q06_SPR

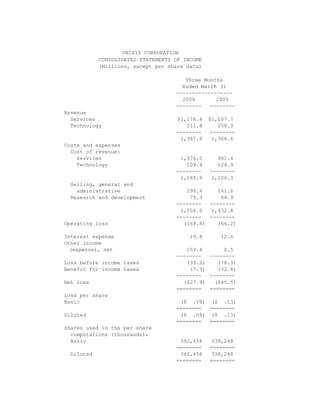
  • 1. UNISYS CORPORATION CONSOLIDATED STATEMENTS OF INCOME (Millions, except per share data) Three Months Ended March 31 ------------------ 2006 2005 -------- -------- Revenue Services $1,176.4 $1,107.7 Technology 211.4 258.9 -------- -------- 1,387.8 1,366.6 Costs and expenses Cost of revenue: Services 1,076.5 981.4 Technology 109.4 124.9 -------- -------- 1,185.9 1,106.3 Selling, general and administrative 295.4 261.6 Research and development 75.3 64.9 -------- -------- 1,556.6 1,432.8 -------- -------- Operating loss (168.8) (66.2) Interest expense 19.8 12.6 Other income (expense), net 153.4 0.5 -------- -------- Loss before income taxes (35.2) (78.3) Benefit for income taxes (7.3) (32.8) -------- -------- Net loss ($27.9) ($45.5) ======== ======== Loss per share Basic ($ .08) ($ .13) ======== ======== Diluted ($ .08) ($ .13) ======== ======== Shares used in the per share computations (thousands): Basic 342,458 338,248 ======== ======== Diluted 342,458 338,248 ======== ========
  • 2. UNISYS CORPORATION SEGMENT RESULTS (Millions) Elimi- Total nations Services* Technology* -------- -------- -------- ---------- Three Months Ended March 31, 2006 ------------------ Customer revenue $1,387.8 $1,176.4 $211.4 Intersegment ($42.6) 3.4 39.2 -------- -------- -------- -------- Total revenue $1,387.8 ($42.6) $1,179.8 $250.6 ======== ======== ======== ======== Gross profit percent 14.5% 15.2% 41.9% ======== ======== ======== Operating loss percent (12.2%) (0.9%) (5.4%) ======== ======== ======== Three Months Ended March 31, 2005 ------------------ Customer revenue $1,366.6 $1,107.7 $258.9 Intersegment ($59.9) 4.8 55.1 -------- -------- -------- -------- Total revenue $1,366.6 ($59.9) $1,112.5 $314.0 ======== ======== ======== ======== Gross profit percent 19.0% 11.0% 47.7% ======== ======== ======== Operating profit (loss) percent (4.8%) (6.8%) 6.1% ======== ======== ======== * 2006 results exclude charges for cost reductions and related actions booked in March 2006
  • 3. UNISYS CORPORATION CONSOLIDATED BALANCE SHEETS (Millions) March 31, December 31, 2006 2005 ---------- ---------- Assets Current assets Cash and cash equivalents $980.2 $642.5 Accounts and notes receivable, net 1,066.4 1,111.5 Inventories Parts and finished equipment 100.8 103.4 Work in process and materials 88.0 90.7 Deferred income taxes 88.1 68.2 Prepaid expense and other current assets 158.1 137.0 ---------- ---------- Total 2,481.6 2,153.3 ---------- ---------- Properties 1,339.3 1,320.8 Less accumulated depreciation and amortization 963.7 934.4 ---------- ---------- Properties, net 375.6 386.4 ---------- ---------- Outsourcing assets, net 407.0 416.0 Marketable software, net 320.4 327.6 Investments at equity 1.1 207.8 Prepaid pension cost 1,333.2 66.1 Deferred income taxes 138.4 138.4 Goodwill 192.1 192.0 Other long-term assets 138.3 141.3 ---------- ---------- Total $5,387.7 $4,028.9 ========== ========== Liabilities and stockholders' equity (deficit) Current liabilities Notes payable $19.7 $18.1 Current maturities of long-term debt 58.7 58.8 Accounts payable 445.3 444.6 Other accrued liabilities 1,403.0 1,293.3 ---------- ---------- Total 1,926.7 1,814.8 ---------- ---------- Long-term debt 1,049.1 1,049.0 Accrued pension liabilities 351.9 506.9 Other long-term liabilities 679.1 690.8 Stockholders' equity (deficit) Common stock 3.5 3.4 Accumulated deficit (2,136.0) (2,108.1) Other capital 3,922.8 3,917.0 Accumulated other comprehensive loss (409.4) (1,844.9) ---------- ---------- Stockholders' equity (deficit) 1,380.9 (32.6) ---------- ---------- Total $5,387.7 $4,028.9 ========== ==========
  • 4. UNISYS CORPORATION CONSOLIDATED STATEMENTS OF CASH FLOWS (Millions) Three Months Ended March 31 ------------------- 2006 2005 ------- ------- Cash flows from operating activities Net loss ($27.9) ($45.5) Add (deduct) items to reconcile net loss to net cash provided by operating activities: Equity loss 4.3 4.3 Employee stock compensation expense (income) 1.7 (.4) Depreciation and amortization of properties 30.3 30.0 Depreciation and amortization of outsourcing assets 35.0 34.7 Amortization of marketable software 33.1 28.5 Gain on sale of NUL shares and other investments (153.2) Increase in deferred income taxes, net (19.8) (.3) Decrease in receivables, net 67.0 90.5 Decrease (increase) in inventories 4.3 (6.5) Increase (decrease) in accounts payable and other accrued liabilities 94.5 (225.1) (Decrease) increase in other liabilities (14.6) 97.7 Increase in other assets (30.8) (16.4) Other 3.0 35.3 ------- ------- Net cash provided by operating activities 26.9 26.8 ------- ------- Cash flows from investing activities Proceeds from investments 1,869.3 1,779.9 Purchases of investments (1,870.6) (1,776.8) Investment in marketable software (27.1) (33.0) Capital additions of properties (21.6) (22.4) Capital additions of outsourcing assets (24.6) (41.9) Proceeds from sale of NUL shares and other investments 380.6 ------- ------- Net cash provided by (used for) investing activities 306.0 (94.2) ------- ------- Cash flows from financing activities Net proceeds from short-term borrowings 1.6 1.7 Proceeds from employee stock plans .6 6.6 Payments of long-term debt (150.3) ------- ------- Net cash provided by (used for) financing activities 2.2 (142.0) ------- ------- Effect of exchange rate changes on cash and cash equivalents 2.6 (9.5) ------- ------- Increase (decrease) in cash and cash equivalents 337.7 (218.9) Cash and cash equivalents, beginning of period 642.5 660.5 ------- ------- Cash and cash equivalents, end of period $980.2 $441.6 ======= =======
  • 5. Reconciliation of GAAP to Non-GAAP Financial Information The preceding release presents information with and without pension expense. Unisys believes that this information will enhance an overall understanding of its financial performance due to the significant change in pension expense from period to period and the non-operational nature of pension expense. The presentation of non-GAAP information is not meant to be considered in isolation or as a substitute for results prepared in accordance with accounting principles generally accepted in the United States.
  • 6. UNISYS CORPORATION RECONCILIATION OF GAAP TO NON-GAAP CONSOLIDATED STATEMENTS OF INCOME (Millions, except per share data) Three Months Ended March 31, 2006 ---------------------------- US GAAP Less Without as Pension Pension Reported Expense Expense -------- -------- -------- Revenue $1,387.8 $1,387.8 Costs and expenses Cost of revenue 1,185.9 ($7.7) 1,178.2 Selling, general and administrative 295.4 (1.8) 293.6 Research and development 75.3 1.6 76.9 -------- -------- -------- 1,556.6 (7.9) 1,548.7 -------- -------- -------- Operating loss (168.8) 7.9 (160.9) Interest expense 19.8 19.8 Other income (expense), net 153.4 153.4 -------- -------- -------- Loss before income taxes (35.2) 7.9 (27.3) Benefit for income taxes (7.3) 5.8 (1.5) -------- -------- -------- Net loss ($27.9) $2.1 ($25.8) ======== ======== ======== Loss per share ($ .08) $ .00 ($ .08) ======== ======== ======== Three Months Ended March 31, 2005 ---------------------------- US GAAP Less Without as Pension Pension Reported Expense Expense -------- -------- -------- Revenue $1,366.6 $1,366.6 Costs and expenses Cost of revenue 1,106.3 ($32.8) 1,073.5 Selling, general and administrative 261.6 (9.1) 252.5 Research and development 64.9 (4.9) 60.0 -------- -------- -------- 1,432.8 (46.8) 1,386.0 -------- -------- -------- Operating loss (66.2) 46.8 (19.4) Interest expense 12.6 12.6 Other income (expense), net 0.5 0.5 -------- -------- -------- Loss before income taxes (78.3) 46.8 (31.5) Benefit for income taxes (32.8) 15.0 (17.8) -------- -------- -------- Net loss ($45.5) $31.8 ($13.7) ======== ======== ======== Loss per share ($ .13) $ .09 ($ .04) ======== ======== ========
  • 7. UNISYS CORPORATION RECONCILIATION OF GAAP TO NON-GAAP SEGMENT RESULTS OF OPERATIONS (Millions) Three Months Ended March 31, 2006 ---------------------------- Less Without As Pension Pension Reported Expense Expense -------- -------- -------- Services Segment * Total revenue $1,179.8 $1,179.8 Gross profit 179.1 ($8.1) 187.2 % of revenue 15.2% 15.9% Operating loss (10.5) (9.6) (0.9) % of revenue -0.9% -0.1% Technology Segment * Total revenue 250.6 250.6 Gross profit 105.1 0.4 104.7 % of revenue 41.9% 41.8% Operating loss (13.5) 1.7 (15.2) % of revenue -5.4% -6.1% Total Company Total revenue 1,387.8 1,387.8 Gross profit 201.9 (7.7) 209.6 % of revenue 14.5% 15.1% Operating loss (168.8) (7.9) (160.9) % of revenue -12.2% -11.6% Three Months Ended March 31, 2005 ---------------------------- Less Without As Pension Pension Reported Expense Expense -------- -------- -------- Services Segment Total revenue $1,112.5 $1,112.5 Gross profit 122.2 ($31.8) 154.0 % of revenue 11.0% 13.8% Operating loss (75.1) (39.4) (35.7) % of revenue -6.8% -3.2% Technology Segment Total revenue 314.0 314.0 Gross profit 149.7 (1.0) 150.7 % of revenue 47.7% 48.0% Operating income 19.3 (7.4) 26.7 % of revenue 6.1% 8.5% Total Company Total revenue 1,366.6 1,366.6 Gross profit 260.3 (32.8) 293.1 % of revenue 19.0% 21.4% Operating loss (66.2) (46.8) (19.4) % of revenue -4.8% -1.4% * 2006 results exclude charges for cost reductions and related actions booked in March 2006