Download as PDF, PPTX
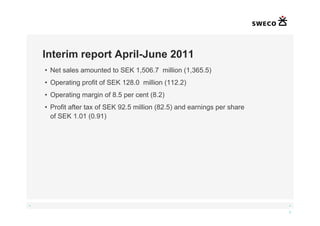
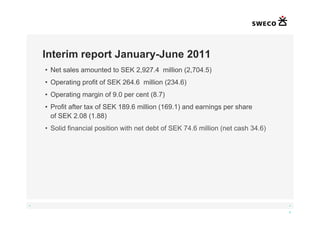
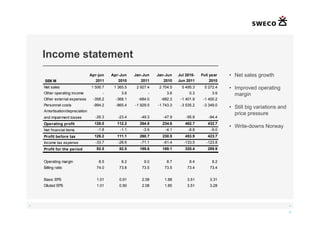
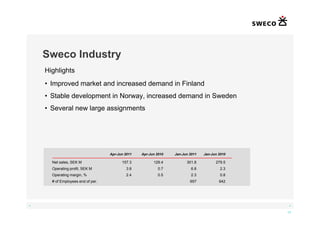

The Q2 2011 interim report for Sweco highlights increased sales and profits, with net sales of SEK 1,506.7 million and an operating profit of SEK 128.0 million. The company shows strong performance across various regions, especially in Sweden, while navigating economic uncertainties. Overall, Sweco is well-positioned for continued growth despite challenges in the global economy.


![Eletropaulo 1 q10_eng_final [modo de compatibilidade]](https://cdn.slidesharecdn.com/ss_thumbnails/eletropaulo1q10engfinalmododecompatibilidade-100517082821-phpapp01-thumbnail.jpg?width=640&height=640&fit=bounds)


