Download to read offline
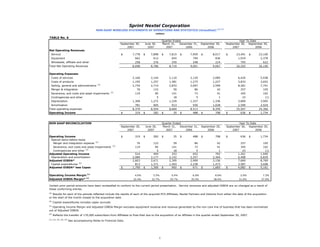
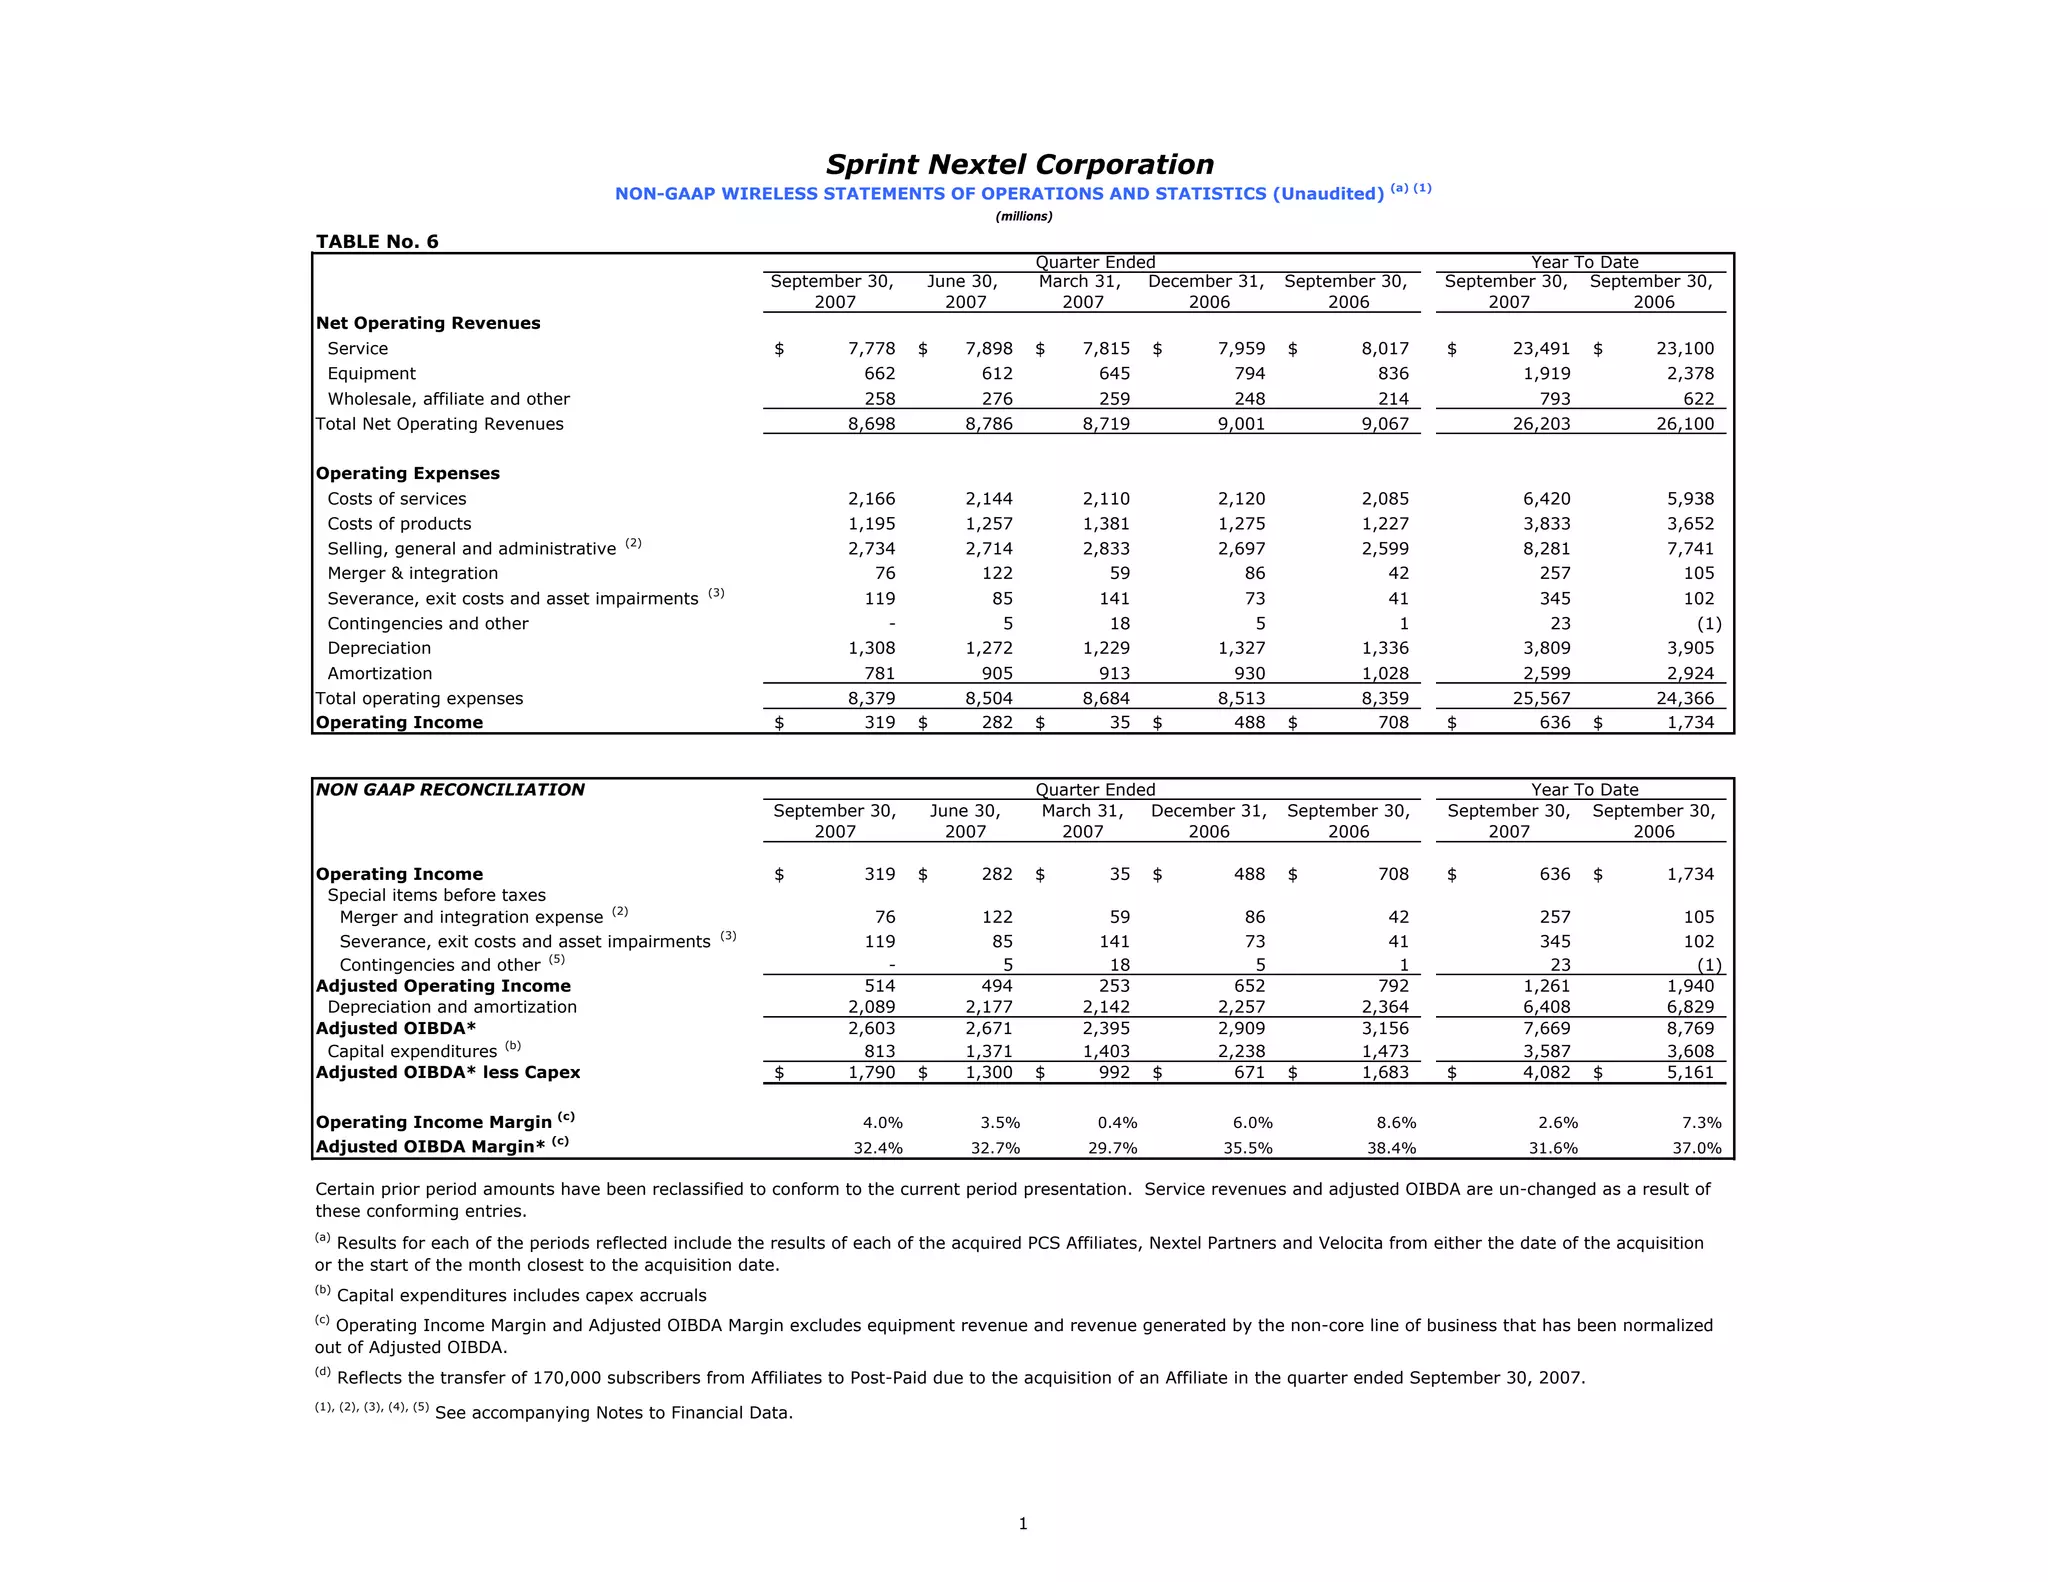
This document provides a summary of Sprint Nextel Corporation's non-GAAP wireless statements of operations and statistics for the quarter ended September 30, 2007 and year-to-date. It shows operating revenues, expenses, operating income, and other financial metrics. It also includes reconciliations between GAAP and non-GAAP measures such as adjusted operating income and adjusted OIBDA. Key notes further explain special items and non-recurring expenses such as merger and integration costs.


