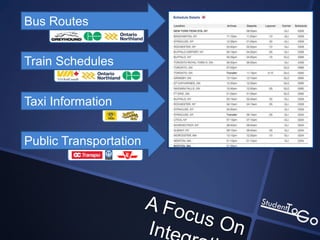
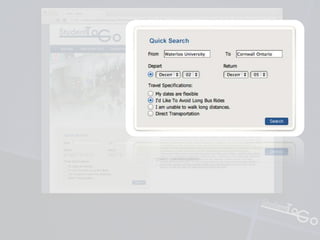
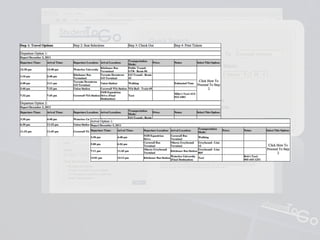
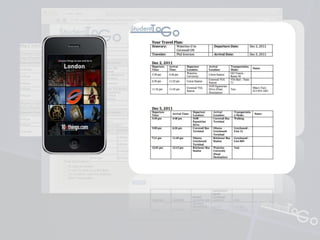
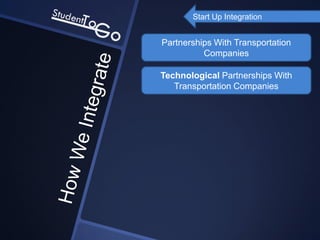
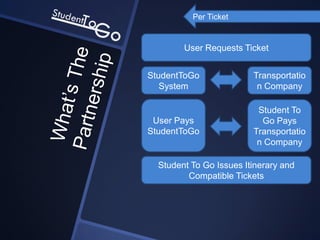
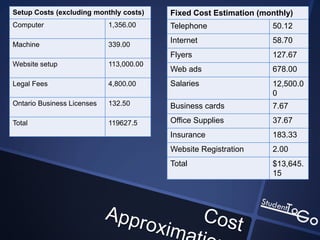
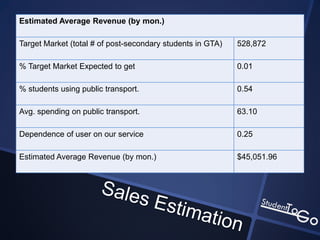
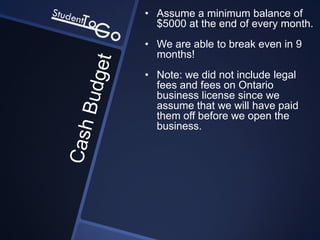
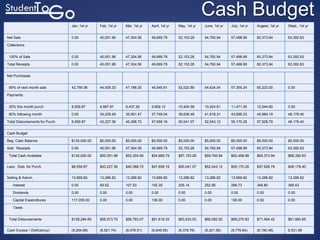
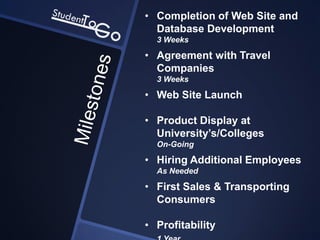
Bus Routes


Train Schedules


Taxi Information


Public Transportation
Start Up Integration


Partnerships With Transportation
          Companies

Technological Partnerships With
   Transportation Companies
Per Ticket


        User Requests Ticket


StudentToGo              Transportatio
   System                 n Company

                          Student To
 User Pays                 Go Pays
StudentToGo              Transportatio
                          n Company

  Student To Go Issues Itinerary and
         Compatible Tickets
Setup Costs (excluding monthly costs)    Fixed Cost Estimation (monthly)
Computer                    1,356.00     Telephone                50.12

Machine                     339.00
                                         Internet                 58.70
                                         Flyers                   127.67
Website setup               113,000.00
                                         Web ads                  678.00
Legal Fees                  4,800.00     Salaries                 12,500.0
                                                                  0
Ontario Business Licenses   132.50       Business cards           7.67

Total                       119627.5     Office Supplies          37.67
                                         Insurance                183.33
                                         Website Registration     2.00
                                         Total                    $13,645.
                                                                  15
Break-Even Analysis
                                                                 Dollars        Ratio
      Fixed Costs                                                $13,645.15
      Variable Costs                                             0.95x          0.95
      Variable Revenue                                           x              1


      Break-even sales (in $)
      x = 13715.15333/(1-0.95)                                   $272, 903.00


      Contribution Margin
      1x-0.95x                                                   0.05x


Note: Since we have many different products for sell, we use x
instead of a fixed price to represent the variable revenue.
Estimated Average Revenue (by mon.)

Target Market (total # of post-secondary students in GTA)   528,872

% Target Market Expected to get                             0.01

% students using public transport.                          0.54

Avg. spending on public transport.                          63.10

Dependence of user on our service                           0.25

Estimated Average Revenue (by mon.)                         $45,051.96
• Assume a minimum balance of
  $5000 at the end of every month.
• We are able to break even in 9
  months!
• Note: we did not include legal
  fees and fees on Ontario
  business license since we
  assume that we will have paid
  them off before we open the
  business.
Cash Budget
                                 Jan, 1st yr   Feb, 1st yr   Mar, 1st yr   April, 1st yr   May, 1st yr   June, 1st yr   July, 1st yr   Augest, 1st yr   Stept., 1st yr


Net Sale                         0.00          45,051.96     47,304.56     49,669.79       52,153.28     54,760.94      57,498.99      60,373.94        63,392.63

Collections


 100% of Sale                    0.00          45,051.96     47,304.56     49,669.79       52,153.28     54,760.94      57,498.99      60,373.94        63,392.63

Total Receipts                   0.00          45,051.96     47,304.56     49,669.79       52,153.28     54,760.94      57,498.99      60,373.94        63,392.63


Net Purchases


 95% of next month sale          42,799.36     44,939.33     47,186.30     49,545.61       52,022.89     54,624.04      57,355.24      60,223.00        0.00

Payments


 20% this month purch            8,559.87      8,987.87      9,437.26      9,909.12        10,404.58     10,924.81      11,471.05      12,044.60        0.00

 80% following month             0.00          34,239.49     35,951.47     37,749.04       39,636.49     41,618.31      43,699.23      45,884.19        48,178.40

Total Disbursements for Purch.   8,559.87      43,227.36     45,388.72     47,658.16       50,041.07     52,543.12      55,170.28      57,928.79        48,178.40


Cash Budget

Beg. Cash Balance                $130,000.00   $5,000.00     $5,000.00     $5,000.00       $5,000.00     $5,000.00      $5,000.00      $5,000.00        $5,000.00

Add: Receipts                    0.00          45,051.96     47,304.56     49,669.79       52,153.28     54,760.94      57,498.99      60,373.94        63,392.63

 Total Cash Available            $130,000.00   $50,051.96    $52,304.56    $54,669.79      $57,153.28    $59,760.94     $62,498.99     $65,373.94       $68,392.63


Less: Disb. for Purch.           $8,559.87     $43,227.36    $45,388.72    $47,658.16      $50,041.07    $52,543.12     $55,170.28     $57,928.79       $48,178.40


Selling & Admin.                 13,669.82     13,286.82     13,286.82     13,669.82       13,286.82     13,286.82      13,669.82      13,286.82        13,286.82

   Interest                      0.00          59.52         107.53        155.35          205.14        252.56         299.73         348.80           395.43

   Dividends                     0.00          0.00          0.00          0.00            0.00          0.00           0.00           0.00             0.00

   Capital Expenditures          117,055.00    0.00          0.00          136.00          0.00          0.00           136.00         0.00             0.00

   Taxes


 Total Disbursements             $139,284.69   $56,573.70    $58,783.07    $61,619.33      $63,533.03    $66,082.50     $69,275.83     $71,564.42       $61,860.65


Cash Excess / (Deficiency)       (9,284.69)    (6,521.74)    (6,478.51)    (6,949.55)      (6,379.76)    (6,321.56)     (6,776.84)     (6,190.48)       6,531.98
• Completion of Web Site and
  Database Development
  3 Weeks

• Agreement with Travel
  Companies
  3 Weeks

• Web Site Launch

• Product Display at
  University’s/Colleges
  On-Going

• Hiring Additional Employees
  As Needed

• First Sales & Transporting
  Consumers

• Profitability
• A Niche Market

• No Direct Competition

• Directly Customer Meeting Needs

• Minimal Start-Up Cost

• Next To No Ongoing Expenses
BU121 StudentToGo New Venture

BU121 StudentToGo New Venture

  • 8.
    Bus Routes Train Schedules TaxiInformation Public Transportation
  • 12.
    Start Up Integration PartnershipsWith Transportation Companies Technological Partnerships With Transportation Companies
  • 13.
    Per Ticket User Requests Ticket StudentToGo Transportatio System n Company Student To User Pays Go Pays StudentToGo Transportatio n Company Student To Go Issues Itinerary and Compatible Tickets
  • 33.
    Setup Costs (excludingmonthly costs) Fixed Cost Estimation (monthly) Computer 1,356.00 Telephone 50.12 Machine 339.00 Internet 58.70 Flyers 127.67 Website setup 113,000.00 Web ads 678.00 Legal Fees 4,800.00 Salaries 12,500.0 0 Ontario Business Licenses 132.50 Business cards 7.67 Total 119627.5 Office Supplies 37.67 Insurance 183.33 Website Registration 2.00 Total $13,645. 15
  • 35.
    Break-Even Analysis Dollars Ratio Fixed Costs $13,645.15 Variable Costs 0.95x 0.95 Variable Revenue x 1 Break-even sales (in $) x = 13715.15333/(1-0.95) $272, 903.00 Contribution Margin 1x-0.95x 0.05x Note: Since we have many different products for sell, we use x instead of a fixed price to represent the variable revenue.
  • 36.
    Estimated Average Revenue(by mon.) Target Market (total # of post-secondary students in GTA) 528,872 % Target Market Expected to get 0.01 % students using public transport. 0.54 Avg. spending on public transport. 63.10 Dependence of user on our service 0.25 Estimated Average Revenue (by mon.) $45,051.96
  • 38.
    • Assume aminimum balance of $5000 at the end of every month. • We are able to break even in 9 months! • Note: we did not include legal fees and fees on Ontario business license since we assume that we will have paid them off before we open the business.
  • 39.
    Cash Budget Jan, 1st yr Feb, 1st yr Mar, 1st yr April, 1st yr May, 1st yr June, 1st yr July, 1st yr Augest, 1st yr Stept., 1st yr Net Sale 0.00 45,051.96 47,304.56 49,669.79 52,153.28 54,760.94 57,498.99 60,373.94 63,392.63 Collections 100% of Sale 0.00 45,051.96 47,304.56 49,669.79 52,153.28 54,760.94 57,498.99 60,373.94 63,392.63 Total Receipts 0.00 45,051.96 47,304.56 49,669.79 52,153.28 54,760.94 57,498.99 60,373.94 63,392.63 Net Purchases 95% of next month sale 42,799.36 44,939.33 47,186.30 49,545.61 52,022.89 54,624.04 57,355.24 60,223.00 0.00 Payments 20% this month purch 8,559.87 8,987.87 9,437.26 9,909.12 10,404.58 10,924.81 11,471.05 12,044.60 0.00 80% following month 0.00 34,239.49 35,951.47 37,749.04 39,636.49 41,618.31 43,699.23 45,884.19 48,178.40 Total Disbursements for Purch. 8,559.87 43,227.36 45,388.72 47,658.16 50,041.07 52,543.12 55,170.28 57,928.79 48,178.40 Cash Budget Beg. Cash Balance $130,000.00 $5,000.00 $5,000.00 $5,000.00 $5,000.00 $5,000.00 $5,000.00 $5,000.00 $5,000.00 Add: Receipts 0.00 45,051.96 47,304.56 49,669.79 52,153.28 54,760.94 57,498.99 60,373.94 63,392.63 Total Cash Available $130,000.00 $50,051.96 $52,304.56 $54,669.79 $57,153.28 $59,760.94 $62,498.99 $65,373.94 $68,392.63 Less: Disb. for Purch. $8,559.87 $43,227.36 $45,388.72 $47,658.16 $50,041.07 $52,543.12 $55,170.28 $57,928.79 $48,178.40 Selling & Admin. 13,669.82 13,286.82 13,286.82 13,669.82 13,286.82 13,286.82 13,669.82 13,286.82 13,286.82 Interest 0.00 59.52 107.53 155.35 205.14 252.56 299.73 348.80 395.43 Dividends 0.00 0.00 0.00 0.00 0.00 0.00 0.00 0.00 0.00 Capital Expenditures 117,055.00 0.00 0.00 136.00 0.00 0.00 136.00 0.00 0.00 Taxes Total Disbursements $139,284.69 $56,573.70 $58,783.07 $61,619.33 $63,533.03 $66,082.50 $69,275.83 $71,564.42 $61,860.65 Cash Excess / (Deficiency) (9,284.69) (6,521.74) (6,478.51) (6,949.55) (6,379.76) (6,321.56) (6,776.84) (6,190.48) 6,531.98
  • 42.
    • Completion ofWeb Site and Database Development 3 Weeks • Agreement with Travel Companies 3 Weeks • Web Site Launch • Product Display at University’s/Colleges On-Going • Hiring Additional Employees As Needed • First Sales & Transporting Consumers • Profitability
  • 46.
    • A NicheMarket • No Direct Competition • Directly Customer Meeting Needs • Minimal Start-Up Cost • Next To No Ongoing Expenses

Editor's Notes