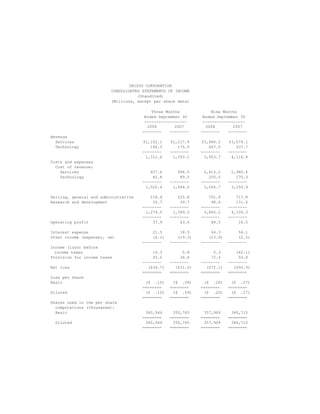
SlideShare a Scribd company logo
UNISYS CORPORATION
                         CONSOLIDATED STATEMENTS OF INCOME
                                     (Unaudited)
                         (Millions, except per share data)

                                          Three Months             Nine Months
                                       Ended September 30      Ended September 30
                                       ------------------      ------------------
                                        2008        2007        2008        2007
                                      --------    --------    --------    --------
Revenue
  Services                            $1,152.1    $1,217.6    $3,486.2    $3,579.1
  Technology                             160.3       175.5       467.5       537.7
                                      --------    --------    --------    --------
                                       1,312.4     1,393.1     3,953.7     4,116.8
Costs and expenses
  Cost of revenue:
    Services                             937.6       994.5     2,814.2     2,980.6
    Technology                            82.8        89.5       250.5       270.3
                                      --------    --------    --------    --------
                                       1,020.4     1,084.0     3,064.7     3,250.9

Selling, general and administrative      218.4       225.8       701.9       717.8
Research and development                  35.7        39.7        98.6       131.6
                                      --------    --------    --------    --------
                                       1,274.5     1,349.5     3,865.2     4,100.3
                                      --------    --------    --------    --------
Operating profit                          37.9        43.6        88.5        16.5

Interest expense                          21.5        18.5        64.3        56.1
Other income (expense), net               (6.1)      (19.3)      (23.9)       (2.5)
                                      --------    --------    --------    --------
Income (loss) before
  income taxes                            10.3         5.8         0.3       (42.1)
Provision for income taxes                45.0        36.8        72.4        50.8
                                      --------    --------    --------    --------
Net loss                                ($34.7)     ($31.0)     ($72.1)     ($92.9)
                                      ========    ========    ========    ========
Loss per share
Basic                                  ($ .10)     ($ .09)     ($ .20)     ($ .27)
                                      ========    ========    ========    ========
Diluted                                ($ .10)     ($ .09)     ($ .20)     ($ .27)
                                      ========    ========    ========    ========
Shares used in the per share
  computations (thousands):
  Basic                                360,944     350,765     357,969     348,715
                                      ========    ========    ========    ========
 Diluted                               360,944     350,765     357,969     348,715
                                      ========    ========    ========    ========
UNISYS CORPORATION
                            SEGMENT RESULTS
                               (Unaudited)
                                (Millions)

                                           Elimi-
                              Total        nations    Services* Technology*
                             --------      --------   --------  ----------
Three Months Ended
September 30, 2008
------------------
Customer revenue            $1,312.4                  $1,152.1      $160.3
Intersegment                                ($67.5)        4.0        63.5
                             --------      --------    --------    --------
Total revenue               $1,312.4        ($67.5)   $1,156.1      $223.8
                             ========      ========    ========    ========

Gross profit percent           22.2%                     17.6%       47.5%
                             ========                  ========    ========
Operating profit percent        2.9%                      3.1%       11.0%
                             ========                  ========    ========
Three Months Ended
September 30, 2007
------------------
Customer revenue            $1,393.1                  $1,217.6      $175.5
Intersegment                                ($61.2)        3.4        57.8
                             --------      --------    --------    --------
Total revenue               $1,393.1        ($61.2)   $1,221.0      $233.3
                             ========      ========    ========    ========

Gross profit percent           22.2%                     17.7%       44.6%
                             ========                  ========    ========
Operating profit percent        3.1%                      3.6%        4.0%
                             ========                  ========    ========

Nine Months Ended
September 30, 2008
------------------
Customer revenue            $3,953.7                  $3,486.2      $467.5
Intersegment                               ($162.2)        9.4       152.8
                             --------      --------    --------    --------
Total revenue               $3,953.7       ($162.2)   $3,495.6      $620.3
                             ========      ========    ========    ========

Gross profit percent           22.5%                     18.4%       43.4%
                             ========                  ========    ========
Operating profit percent        2.2%                      2.9%        3.1%
                             ========                  ========    ========
Nine Months Ended
September 30, 2007
------------------
Customer revenue            $4,116.8                  $3,579.1      $537.7
Intersegment                               ($148.7)       10.9       137.8
                             --------      --------    --------    --------
Total revenue               $4,116.8       ($148.7)   $3,590.0      $675.5
                             ========      ========    ========    ========

Gross profit percent           21.0%                     16.7%       43.7%
                             ========                  ========    ========
Operating profit percent        0.4%                      1.7%        2.4%
                             ========                  ========    ========

* Results exclude cost reduction actions
UNISYS CORPORATION
                     CONSOLIDATED BALANCE SHEETS
                              (Millions)
                                           September 30,
                                                2008     December 31,
                                                             2007
                                            (Unaudited)
                                            ----------    ----------
Assets
Current assets
  Cash and cash equivalents                        $493.8      $830.2
  Accounts and notes receivable, net                853.3     1,059.2
  Inventories
     Parts and finished equipment                    78.5        91.9
     Work in process and materials                   72.8        79.2
  Deferred income taxes                              18.0        18.0
  Prepaid expense and other
    current assets                               145.6           133.7
                                            ----------      ----------
 Total                                         1,662.0         2,212.2
                                            ----------      ----------
Properties                                     1,307.8         1,336.9
  Less accumulated depreciation
    and amortization                           1,013.2         1,004.7
                                            ----------      ----------
 Properties, net                                 294.6           332.2
                                            ----------      ----------
Outsourcing assets, net                          348.9           409.4
Marketable software, net                         244.2           268.8
Prepaid postretirement assets                    603.8           497.0
Deferred income taxes                             93.8            93.8
Goodwill                                         195.9           200.6
Other long-term assets                           120.2           123.1
                                            ----------      ----------
 Total                                        $3,563.4        $4,137.1
                                            ==========      ==========
Liabilities and stockholders' equity
Current liabilities
  Notes payable                                   $0.0            $0.1
  Current maturities of long-term debt             2.2           204.3
  Accounts payable                               337.5           419.6
  Other accrued liabilities                    1,092.1         1,272.0
                                            ----------      ----------
 Total                                         1,431.8         1,896.0
                                            ----------      ----------
Long-term debt                                 1,059.7         1,058.3
Long-term postretirement liabilities             370.3           420.7
Other long-term liabilities                      321.5           395.5
Stockholders' equity
  Common stock                                     3.6             3.6
  Accumulated deficit                         (2,538.0)       (2,465.9)
  Other capital                                4,045.9         4,011.8
  Accumulated other comprehensive loss        (1,131.4)       (1,182.9)
                                            ----------      ----------
 Stockholders' equity                            380.1           366.6
                                            ----------      ----------
 Total                                        $3,563.4        $4,137.1
                                            ==========      ==========
UNISYS CORPORATION
                  CONSOLIDATED STATEMENTS OF CASH FLOWS
                                (Unaudited)
                                (Millions)
                                                     Nine Months Ended
                                                        September 30
                                                    -------------------
                                                     2008          2007
                                                    -------       -------
Cash flows from operating activities
Net loss                                             ($72.1)       ($92.9)
Add (deduct) items to reconcile
  net loss to net cash provided by
  (used for) operating activities:
Employee stock compensation expense                      (.2)         8.6
Company stock issued for U.S. 401(k) plan              34.2          34.3
Depreciation and amortization
  of properties                                        80.4          83.9
Depreciation and amortization of
  outsourcing assets                                  126.0         102.4
Amortization of marketable software                    90.0          90.1
Disposals of capital assets                              8.6          3.8
Gain on sale of assets                                              (23.4)
Decrease in deferred income taxes, net                                8.9
Decrease in receivables, net                          175.9         111.7
Decease (increase) in inventories                      16.7         (15.6)
Decrease in accounts payable
  and other accrued liabilities                      (215.9)       (286.8)
Decrease in other liabilities                         (27.9)        (68.8)
Increase in other assets                             (108.7)        (28.7)
Other                                                    9.4         (1.7)
                                                     -------       -------
Net cash provided by (used for)
  operating activities                                116.4         (74.2)
                                                     -------       -------
Cash flows from investing activities
  Proceeds from investments                         4,838.1       5,785.7
  Purchases of investments                         (4,847.9)     (5,793.4)
  Investment in marketable software                   (65.9)        (73.0)
  Capital additions of properties                     (51.8)        (56.4)
  Capital additions of outsourcing assets             (96.6)       (108.4)
  Purchases of businesses                              (2.3)         (2.0)
  Proceeds from sale of businesses                                   28.0
                                                     -------       -------
Net cash used for investing activities               (226.4)       (219.5)
                                                     -------       -------
Cash flows from financing activities
  Net reduction in short-term borrowings                 (.1)        (1.1)
  Minority shareholder dividends                                     (5.8)
  Proceeds from exercise of stock options                            12.3
  Payments of long-term debt                         (200.0)
  Financing fees                                         (.8)
                                                     -------       -------
Net cash (used for) provided by financing
  activities                                         (200.9)          5.4
                                                     -------       -------
Effect of exchange rate changes on cash
  and cash equivalents                                (25.5)         17.5
                                                     -------       -------
Decrease in cash and cash
  equivalents                                        (336.4)       (270.8)
Cash and cash equivalents, beginning of
  period                                              830.2         719.3
                                                     -------       -------
Cash and cash equivalents, end of period             $493.8        $448.5
                                                     =======       =======

More Related Content

What's hot

unisys 3Q05_SPR
unisys 3Q05_SPRunisys 3Q05_SPR
unisys 3Q05_SPRfinance36
 
unisys 4Q07_SPR
unisys 4Q07_SPRunisys 4Q07_SPR
unisys 4Q07_SPRfinance36
 
unisys 4Q06_SPR
unisys 4Q06_SPRunisys 4Q06_SPR
unisys 4Q06_SPRfinance36
 
unisys 4Q05_SPR
unisys 4Q05_SPRunisys 4Q05_SPR
unisys 4Q05_SPRfinance36
 
unisys 4Q04_SPR
unisys 4Q04_SPRunisys 4Q04_SPR
unisys 4Q04_SPRfinance36
 
unisys 1Q07_SPR
unisys 1Q07_SPRunisys 1Q07_SPR
unisys 1Q07_SPRfinance36
 
unisys 1Q04_SPR
unisys 1Q04_SPRunisys 1Q04_SPR
unisys 1Q04_SPRfinance36
 
unisys 1Q06_SPR
unisys 1Q06_SPRunisys 1Q06_SPR
unisys 1Q06_SPRfinance36
 
unisys 1Q08_SPR
unisys 1Q08_SPRunisys 1Q08_SPR
unisys 1Q08_SPRfinance36
 
unisys 1Q05_SPR
unisys 1Q05_SPRunisys 1Q05_SPR
unisys 1Q05_SPRfinance36
 
unisys 2001_2Q_10Q
unisys 2001_2Q_10Qunisys 2001_2Q_10Q
unisys 2001_2Q_10Qfinance36
 
unisys 2001_1Q_10Q
unisys 2001_1Q_10Qunisys 2001_1Q_10Q
unisys 2001_1Q_10Qfinance36
 
unisys 2002_3Q_10Q
unisys 2002_3Q_10Qunisys 2002_3Q_10Q
unisys 2002_3Q_10Qfinance36
 
advance auto parts 2003_ar
advance auto parts 2003_aradvance auto parts 2003_ar
advance auto parts 2003_arfinance48
 
Big_Lots_AR2002FSO
Big_Lots_AR2002FSOBig_Lots_AR2002FSO
Big_Lots_AR2002FSOfinance50
 
anheuser-busch 2004AR_FinancialSummaries
anheuser-busch 2004AR_FinancialSummariesanheuser-busch 2004AR_FinancialSummaries
anheuser-busch 2004AR_FinancialSummariesfinance15
 
aetna table 2005 3rd
aetna table 2005 3rdaetna table 2005 3rd
aetna table 2005 3rdfinance9
 

What's hot (18)

unisys 3Q05_SPR
unisys 3Q05_SPRunisys 3Q05_SPR
unisys 3Q05_SPR
 
unisys 4Q07_SPR
unisys 4Q07_SPRunisys 4Q07_SPR
unisys 4Q07_SPR
 
unisys 4Q06_SPR
unisys 4Q06_SPRunisys 4Q06_SPR
unisys 4Q06_SPR
 
unisys 4Q05_SPR
unisys 4Q05_SPRunisys 4Q05_SPR
unisys 4Q05_SPR
 
unisys 4Q04_SPR
unisys 4Q04_SPRunisys 4Q04_SPR
unisys 4Q04_SPR
 
unisys 1Q07_SPR
unisys 1Q07_SPRunisys 1Q07_SPR
unisys 1Q07_SPR
 
unisys 1Q04_SPR
unisys 1Q04_SPRunisys 1Q04_SPR
unisys 1Q04_SPR
 
unisys 1Q06_SPR
unisys 1Q06_SPRunisys 1Q06_SPR
unisys 1Q06_SPR
 
unisys 1Q08_SPR
unisys 1Q08_SPRunisys 1Q08_SPR
unisys 1Q08_SPR
 
unisys 1Q05_SPR
unisys 1Q05_SPRunisys 1Q05_SPR
unisys 1Q05_SPR
 
unisys 2001_2Q_10Q
unisys 2001_2Q_10Qunisys 2001_2Q_10Q
unisys 2001_2Q_10Q
 
unisys 2001_1Q_10Q
unisys 2001_1Q_10Qunisys 2001_1Q_10Q
unisys 2001_1Q_10Q
 
unisys 2002_3Q_10Q
unisys 2002_3Q_10Qunisys 2002_3Q_10Q
unisys 2002_3Q_10Q
 
advance auto parts 2003_ar
advance auto parts 2003_aradvance auto parts 2003_ar
advance auto parts 2003_ar
 
Q1 2009 Earning Report of Stockeryale Inc.
Q1 2009 Earning Report of Stockeryale Inc.Q1 2009 Earning Report of Stockeryale Inc.
Q1 2009 Earning Report of Stockeryale Inc.
 
Big_Lots_AR2002FSO
Big_Lots_AR2002FSOBig_Lots_AR2002FSO
Big_Lots_AR2002FSO
 
anheuser-busch 2004AR_FinancialSummaries
anheuser-busch 2004AR_FinancialSummariesanheuser-busch 2004AR_FinancialSummaries
anheuser-busch 2004AR_FinancialSummaries
 
aetna table 2005 3rd
aetna table 2005 3rdaetna table 2005 3rd
aetna table 2005 3rd
 

Similar to unisys 3Q08_SPR

unisys 2Q04_SPR
unisys 2Q04_SPRunisys 2Q04_SPR
unisys 2Q04_SPRfinance36
 
unisys 2Q04_SPR
unisys 2Q04_SPRunisys 2Q04_SPR
unisys 2Q04_SPRfinance36
 
unisys 2001_3Q_10Q
unisys 2001_3Q_10Qunisys 2001_3Q_10Q
unisys 2001_3Q_10Qfinance36
 
Q1 2009 Earning Report of Weatherford International
Q1 2009 Earning Report of Weatherford InternationalQ1 2009 Earning Report of Weatherford International
Q1 2009 Earning Report of Weatherford Internationalearningreport earningreport
 
Q1 2009 Earning Report of Weatherford International
Q1 2009 Earning Report of Weatherford InternationalQ1 2009 Earning Report of Weatherford International
Q1 2009 Earning Report of Weatherford Internationalearningreport earningreport
 
qwest communications Q_3Q07_Historical_v2
qwest communications Q_3Q07_Historical_v2qwest communications Q_3Q07_Historical_v2
qwest communications Q_3Q07_Historical_v2finance19
 
Maxim 2Q FISCAL 2009 RESULTS
Maxim 2Q FISCAL 2009 RESULTSMaxim 2Q FISCAL 2009 RESULTS
Maxim 2Q FISCAL 2009 RESULTS
earningsreport
 
Mcdonald 4 Q08 Earnings relaeses
Mcdonald 4 Q08 Earnings relaesesMcdonald 4 Q08 Earnings relaeses
Mcdonald 4 Q08 Earnings relaeses
earningsreport
 
qwest communications Q_4Q07_profile
qwest communications Q_4Q07_profileqwest communications Q_4Q07_profile
qwest communications Q_4Q07_profilefinance19
 
qwest communications Historical Quarterly Results1Q 06_2Q08
qwest communications Historical Quarterly Results1Q 06_2Q08qwest communications Historical Quarterly Results1Q 06_2Q08
qwest communications Historical Quarterly Results1Q 06_2Q08finance19
 
danaher 03-3QREL
danaher 03-3QRELdanaher 03-3QREL
danaher 03-3QRELfinance24
 
danaher 07_3Q_Release
danaher 07_3Q_Releasedanaher 07_3Q_Release
danaher 07_3Q_Releasefinance24
 
Verizon Reports Sustained Revenue Growth and Continued Strong Cash Flows fo...
 	Verizon Reports Sustained Revenue Growth and Continued Strong Cash Flows fo... 	Verizon Reports Sustained Revenue Growth and Continued Strong Cash Flows fo...
Verizon Reports Sustained Revenue Growth and Continued Strong Cash Flows fo...finance2
 
danaher 08_1Q_Release
danaher 08_1Q_Releasedanaher 08_1Q_Release
danaher 08_1Q_Releasefinance24
 
adjusted_opincome_eps3Q2007
adjusted_opincome_eps3Q2007adjusted_opincome_eps3Q2007
adjusted_opincome_eps3Q2007finance50
 
alltel 3Q06_Highlightsa
alltel  3Q06_Highlightsaalltel  3Q06_Highlightsa
alltel 3Q06_Highlightsafinance27
 

Similar to unisys 3Q08_SPR (17)

unisys 2Q04_SPR
unisys 2Q04_SPRunisys 2Q04_SPR
unisys 2Q04_SPR
 
unisys 2Q04_SPR
unisys 2Q04_SPRunisys 2Q04_SPR
unisys 2Q04_SPR
 
unisys 2001_3Q_10Q
unisys 2001_3Q_10Qunisys 2001_3Q_10Q
unisys 2001_3Q_10Q
 
Q1 2009 Earning Report of Weatherford International
Q1 2009 Earning Report of Weatherford InternationalQ1 2009 Earning Report of Weatherford International
Q1 2009 Earning Report of Weatherford International
 
Q1 2009 Earning Report of Weatherford International
Q1 2009 Earning Report of Weatherford InternationalQ1 2009 Earning Report of Weatherford International
Q1 2009 Earning Report of Weatherford International
 
qwest communications Q_3Q07_Historical_v2
qwest communications Q_3Q07_Historical_v2qwest communications Q_3Q07_Historical_v2
qwest communications Q_3Q07_Historical_v2
 
Maxim 2Q FISCAL 2009 RESULTS
Maxim 2Q FISCAL 2009 RESULTSMaxim 2Q FISCAL 2009 RESULTS
Maxim 2Q FISCAL 2009 RESULTS
 
Q1 2009 Earning Report of The McClatchy Company
Q1 2009 Earning Report of The McClatchy CompanyQ1 2009 Earning Report of The McClatchy Company
Q1 2009 Earning Report of The McClatchy Company
 
Mcdonald 4 Q08 Earnings relaeses
Mcdonald 4 Q08 Earnings relaesesMcdonald 4 Q08 Earnings relaeses
Mcdonald 4 Q08 Earnings relaeses
 
qwest communications Q_4Q07_profile
qwest communications Q_4Q07_profileqwest communications Q_4Q07_profile
qwest communications Q_4Q07_profile
 
qwest communications Historical Quarterly Results1Q 06_2Q08
qwest communications Historical Quarterly Results1Q 06_2Q08qwest communications Historical Quarterly Results1Q 06_2Q08
qwest communications Historical Quarterly Results1Q 06_2Q08
 
danaher 03-3QREL
danaher 03-3QRELdanaher 03-3QREL
danaher 03-3QREL
 
danaher 07_3Q_Release
danaher 07_3Q_Releasedanaher 07_3Q_Release
danaher 07_3Q_Release
 
Verizon Reports Sustained Revenue Growth and Continued Strong Cash Flows fo...
 	Verizon Reports Sustained Revenue Growth and Continued Strong Cash Flows fo... 	Verizon Reports Sustained Revenue Growth and Continued Strong Cash Flows fo...
Verizon Reports Sustained Revenue Growth and Continued Strong Cash Flows fo...
 
danaher 08_1Q_Release
danaher 08_1Q_Releasedanaher 08_1Q_Release
danaher 08_1Q_Release
 
adjusted_opincome_eps3Q2007
adjusted_opincome_eps3Q2007adjusted_opincome_eps3Q2007
adjusted_opincome_eps3Q2007
 
alltel 3Q06_Highlightsa
alltel  3Q06_Highlightsaalltel  3Q06_Highlightsa
alltel 3Q06_Highlightsa
 

More from finance36

unisys 2001_10K
unisys 2001_10Kunisys 2001_10K
unisys 2001_10Kfinance36
 
unisys 2002_1Q_10Q
unisys 2002_1Q_10Qunisys 2002_1Q_10Q
unisys 2002_1Q_10Qfinance36
 
unisys 2002_2Q_10Q
unisys 2002_2Q_10Qunisys 2002_2Q_10Q
unisys 2002_2Q_10Qfinance36
 
unisys 2002_10K
unisys 2002_10Kunisys 2002_10K
unisys 2002_10Kfinance36
 
unisys 2003_1Q_10Q
unisys 2003_1Q_10Qunisys 2003_1Q_10Q
unisys 2003_1Q_10Qfinance36
 
unisys 2003_2Q_10Q
unisys 2003_2Q_10Qunisys 2003_2Q_10Q
unisys 2003_2Q_10Qfinance36
 
unisys 2003_3Q_10Q
unisys 2003_3Q_10Qunisys 2003_3Q_10Q
unisys 2003_3Q_10Qfinance36
 
unisys 2003_4Q_10K
unisys 2003_4Q_10Kunisys 2003_4Q_10K
unisys 2003_4Q_10Kfinance36
 
unisys 1Q04_10Q
unisys 1Q04_10Qunisys 1Q04_10Q
unisys 1Q04_10Qfinance36
 
unisys 2Q04_10Q
unisys 2Q04_10Qunisys 2Q04_10Q
unisys 2Q04_10Qfinance36
 
unisys 3Q04_10Q
unisys 3Q04_10Qunisys 3Q04_10Q
unisys 3Q04_10Qfinance36
 
unisys 2004_4Q_10K
unisys 2004_4Q_10Kunisys 2004_4Q_10K
unisys 2004_4Q_10Kfinance36
 
unisys 2005_1Q_10Q
unisys 2005_1Q_10Qunisys 2005_1Q_10Q
unisys 2005_1Q_10Qfinance36
 
unisys 2005_2Q_10Q
unisys 2005_2Q_10Qunisys 2005_2Q_10Q
unisys 2005_2Q_10Qfinance36
 
unisys 2005_3Q_10Q
unisys 2005_3Q_10Qunisys 2005_3Q_10Q
unisys 2005_3Q_10Qfinance36
 
unisys 2005_4Q_10K
unisys 2005_4Q_10Kunisys 2005_4Q_10K
unisys 2005_4Q_10Kfinance36
 

More from finance36 (16)

unisys 2001_10K
unisys 2001_10Kunisys 2001_10K
unisys 2001_10K
 
unisys 2002_1Q_10Q
unisys 2002_1Q_10Qunisys 2002_1Q_10Q
unisys 2002_1Q_10Q
 
unisys 2002_2Q_10Q
unisys 2002_2Q_10Qunisys 2002_2Q_10Q
unisys 2002_2Q_10Q
 
unisys 2002_10K
unisys 2002_10Kunisys 2002_10K
unisys 2002_10K
 
unisys 2003_1Q_10Q
unisys 2003_1Q_10Qunisys 2003_1Q_10Q
unisys 2003_1Q_10Q
 
unisys 2003_2Q_10Q
unisys 2003_2Q_10Qunisys 2003_2Q_10Q
unisys 2003_2Q_10Q
 
unisys 2003_3Q_10Q
unisys 2003_3Q_10Qunisys 2003_3Q_10Q
unisys 2003_3Q_10Q
 
unisys 2003_4Q_10K
unisys 2003_4Q_10Kunisys 2003_4Q_10K
unisys 2003_4Q_10K
 
unisys 1Q04_10Q
unisys 1Q04_10Qunisys 1Q04_10Q
unisys 1Q04_10Q
 
unisys 2Q04_10Q
unisys 2Q04_10Qunisys 2Q04_10Q
unisys 2Q04_10Q
 
unisys 3Q04_10Q
unisys 3Q04_10Qunisys 3Q04_10Q
unisys 3Q04_10Q
 
unisys 2004_4Q_10K
unisys 2004_4Q_10Kunisys 2004_4Q_10K
unisys 2004_4Q_10K
 
unisys 2005_1Q_10Q
unisys 2005_1Q_10Qunisys 2005_1Q_10Q
unisys 2005_1Q_10Q
 
unisys 2005_2Q_10Q
unisys 2005_2Q_10Qunisys 2005_2Q_10Q
unisys 2005_2Q_10Q
 
unisys 2005_3Q_10Q
unisys 2005_3Q_10Qunisys 2005_3Q_10Q
unisys 2005_3Q_10Q
 
unisys 2005_4Q_10K
unisys 2005_4Q_10Kunisys 2005_4Q_10K
unisys 2005_4Q_10K
 

Recently uploaded

一比一原版BCU毕业证伯明翰城市大学毕业证成绩单如何办理
一比一原版BCU毕业证伯明翰城市大学毕业证成绩单如何办理一比一原版BCU毕业证伯明翰城市大学毕业证成绩单如何办理
一比一原版BCU毕业证伯明翰城市大学毕业证成绩单如何办理
ydubwyt
 
Introduction to Value Added Tax System.ppt
Introduction to Value Added Tax System.pptIntroduction to Value Added Tax System.ppt
Introduction to Value Added Tax System.ppt
VishnuVenugopal84
 
innovative-invoice-discounting-platforms-in-india-empowering-retail-investors...
innovative-invoice-discounting-platforms-in-india-empowering-retail-investors...innovative-invoice-discounting-platforms-in-india-empowering-retail-investors...
innovative-invoice-discounting-platforms-in-india-empowering-retail-investors...
Falcon Invoice Discounting
 
The European Unemployment Puzzle: implications from population aging
The European Unemployment Puzzle: implications from population agingThe European Unemployment Puzzle: implications from population aging
The European Unemployment Puzzle: implications from population aging
GRAPE
 
how to swap pi coins to foreign currency withdrawable.
how to swap pi coins to foreign currency withdrawable.how to swap pi coins to foreign currency withdrawable.
how to swap pi coins to foreign currency withdrawable.
DOT TECH
 
managementaccountingunitiv-230422140105-dd17d80b.ppt
managementaccountingunitiv-230422140105-dd17d80b.pptmanagementaccountingunitiv-230422140105-dd17d80b.ppt
managementaccountingunitiv-230422140105-dd17d80b.ppt
SuseelaPalanimuthu
 
Chương 6. Ancol - phenol - ether (1).pdf
Chương 6. Ancol - phenol - ether (1).pdfChương 6. Ancol - phenol - ether (1).pdf
Chương 6. Ancol - phenol - ether (1).pdf
va2132004
 
How to get verified on Coinbase Account?_.docx
How to get verified on Coinbase Account?_.docxHow to get verified on Coinbase Account?_.docx
How to get verified on Coinbase Account?_.docx
Buy bitget
 
Financial Assets: Debit vs Equity Securities.pptx
Financial Assets: Debit vs Equity Securities.pptxFinancial Assets: Debit vs Equity Securities.pptx
Financial Assets: Debit vs Equity Securities.pptx
Writo-Finance
 
what is the future of Pi Network currency.
what is the future of Pi Network currency.what is the future of Pi Network currency.
what is the future of Pi Network currency.
DOT TECH
 
Summary of financial results for 1Q2024
Summary of financial  results for 1Q2024Summary of financial  results for 1Q2024
Summary of financial results for 1Q2024
InterCars
 
GeM ppt in railway for presentation on gem
GeM ppt in railway  for presentation on gemGeM ppt in railway  for presentation on gem
GeM ppt in railway for presentation on gem
CwierAsn
 
how can i use my minded pi coins I need some funds.
how can i use my minded pi coins I need some funds.how can i use my minded pi coins I need some funds.
how can i use my minded pi coins I need some funds.
DOT TECH
 
This assessment plan proposal is to outline a structured approach to evaluati...
This assessment plan proposal is to outline a structured approach to evaluati...This assessment plan proposal is to outline a structured approach to evaluati...
This assessment plan proposal is to outline a structured approach to evaluati...
lamluanvan.net Viết thuê luận văn
 
how to sell pi coins on Binance exchange
how to sell pi coins on Binance exchangehow to sell pi coins on Binance exchange
how to sell pi coins on Binance exchange
DOT TECH
 
how to sell pi coins in all Africa Countries.
how to sell pi coins in all Africa Countries.how to sell pi coins in all Africa Countries.
how to sell pi coins in all Africa Countries.
DOT TECH
 
where can I find a legit pi merchant online
where can I find a legit pi merchant onlinewhere can I find a legit pi merchant online
where can I find a legit pi merchant online
DOT TECH
 
234Presentation on Indian Debt Market.ppt
234Presentation on Indian Debt Market.ppt234Presentation on Indian Debt Market.ppt
234Presentation on Indian Debt Market.ppt
PravinPatil144525
 
Empowering the Unbanked: The Vital Role of NBFCs in Promoting Financial Inclu...
Empowering the Unbanked: The Vital Role of NBFCs in Promoting Financial Inclu...Empowering the Unbanked: The Vital Role of NBFCs in Promoting Financial Inclu...
Empowering the Unbanked: The Vital Role of NBFCs in Promoting Financial Inclu...
Vighnesh Shashtri
 
Exploring Abhay Bhutada’s Views After Poonawalla Fincorp’s Collaboration With...
Exploring Abhay Bhutada’s Views After Poonawalla Fincorp’s Collaboration With...Exploring Abhay Bhutada’s Views After Poonawalla Fincorp’s Collaboration With...
Exploring Abhay Bhutada’s Views After Poonawalla Fincorp’s Collaboration With...
beulahfernandes8
 

Recently uploaded (20)

一比一原版BCU毕业证伯明翰城市大学毕业证成绩单如何办理
一比一原版BCU毕业证伯明翰城市大学毕业证成绩单如何办理一比一原版BCU毕业证伯明翰城市大学毕业证成绩单如何办理
一比一原版BCU毕业证伯明翰城市大学毕业证成绩单如何办理
 
Introduction to Value Added Tax System.ppt
Introduction to Value Added Tax System.pptIntroduction to Value Added Tax System.ppt
Introduction to Value Added Tax System.ppt
 
innovative-invoice-discounting-platforms-in-india-empowering-retail-investors...
innovative-invoice-discounting-platforms-in-india-empowering-retail-investors...innovative-invoice-discounting-platforms-in-india-empowering-retail-investors...
innovative-invoice-discounting-platforms-in-india-empowering-retail-investors...
 
The European Unemployment Puzzle: implications from population aging
The European Unemployment Puzzle: implications from population agingThe European Unemployment Puzzle: implications from population aging
The European Unemployment Puzzle: implications from population aging
 
how to swap pi coins to foreign currency withdrawable.
how to swap pi coins to foreign currency withdrawable.how to swap pi coins to foreign currency withdrawable.
how to swap pi coins to foreign currency withdrawable.
 
managementaccountingunitiv-230422140105-dd17d80b.ppt
managementaccountingunitiv-230422140105-dd17d80b.pptmanagementaccountingunitiv-230422140105-dd17d80b.ppt
managementaccountingunitiv-230422140105-dd17d80b.ppt
 
Chương 6. Ancol - phenol - ether (1).pdf
Chương 6. Ancol - phenol - ether (1).pdfChương 6. Ancol - phenol - ether (1).pdf
Chương 6. Ancol - phenol - ether (1).pdf
 
How to get verified on Coinbase Account?_.docx
How to get verified on Coinbase Account?_.docxHow to get verified on Coinbase Account?_.docx
How to get verified on Coinbase Account?_.docx
 
Financial Assets: Debit vs Equity Securities.pptx
Financial Assets: Debit vs Equity Securities.pptxFinancial Assets: Debit vs Equity Securities.pptx
Financial Assets: Debit vs Equity Securities.pptx
 
what is the future of Pi Network currency.
what is the future of Pi Network currency.what is the future of Pi Network currency.
what is the future of Pi Network currency.
 
Summary of financial results for 1Q2024
Summary of financial  results for 1Q2024Summary of financial  results for 1Q2024
Summary of financial results for 1Q2024
 
GeM ppt in railway for presentation on gem
GeM ppt in railway  for presentation on gemGeM ppt in railway  for presentation on gem
GeM ppt in railway for presentation on gem
 
how can i use my minded pi coins I need some funds.
how can i use my minded pi coins I need some funds.how can i use my minded pi coins I need some funds.
how can i use my minded pi coins I need some funds.
 
This assessment plan proposal is to outline a structured approach to evaluati...
This assessment plan proposal is to outline a structured approach to evaluati...This assessment plan proposal is to outline a structured approach to evaluati...
This assessment plan proposal is to outline a structured approach to evaluati...
 
how to sell pi coins on Binance exchange
how to sell pi coins on Binance exchangehow to sell pi coins on Binance exchange
how to sell pi coins on Binance exchange
 
how to sell pi coins in all Africa Countries.
how to sell pi coins in all Africa Countries.how to sell pi coins in all Africa Countries.
how to sell pi coins in all Africa Countries.
 
where can I find a legit pi merchant online
where can I find a legit pi merchant onlinewhere can I find a legit pi merchant online
where can I find a legit pi merchant online
 
234Presentation on Indian Debt Market.ppt
234Presentation on Indian Debt Market.ppt234Presentation on Indian Debt Market.ppt
234Presentation on Indian Debt Market.ppt
 
Empowering the Unbanked: The Vital Role of NBFCs in Promoting Financial Inclu...
Empowering the Unbanked: The Vital Role of NBFCs in Promoting Financial Inclu...Empowering the Unbanked: The Vital Role of NBFCs in Promoting Financial Inclu...
Empowering the Unbanked: The Vital Role of NBFCs in Promoting Financial Inclu...
 
Exploring Abhay Bhutada’s Views After Poonawalla Fincorp’s Collaboration With...
Exploring Abhay Bhutada’s Views After Poonawalla Fincorp’s Collaboration With...Exploring Abhay Bhutada’s Views After Poonawalla Fincorp’s Collaboration With...
Exploring Abhay Bhutada’s Views After Poonawalla Fincorp’s Collaboration With...
 

unisys 3Q08_SPR

  • 1. UNISYS CORPORATION CONSOLIDATED STATEMENTS OF INCOME (Unaudited) (Millions, except per share data) Three Months Nine Months Ended September 30 Ended September 30 ------------------ ------------------ 2008 2007 2008 2007 -------- -------- -------- -------- Revenue Services $1,152.1 $1,217.6 $3,486.2 $3,579.1 Technology 160.3 175.5 467.5 537.7 -------- -------- -------- -------- 1,312.4 1,393.1 3,953.7 4,116.8 Costs and expenses Cost of revenue: Services 937.6 994.5 2,814.2 2,980.6 Technology 82.8 89.5 250.5 270.3 -------- -------- -------- -------- 1,020.4 1,084.0 3,064.7 3,250.9 Selling, general and administrative 218.4 225.8 701.9 717.8 Research and development 35.7 39.7 98.6 131.6 -------- -------- -------- -------- 1,274.5 1,349.5 3,865.2 4,100.3 -------- -------- -------- -------- Operating profit 37.9 43.6 88.5 16.5 Interest expense 21.5 18.5 64.3 56.1 Other income (expense), net (6.1) (19.3) (23.9) (2.5) -------- -------- -------- -------- Income (loss) before income taxes 10.3 5.8 0.3 (42.1) Provision for income taxes 45.0 36.8 72.4 50.8 -------- -------- -------- -------- Net loss ($34.7) ($31.0) ($72.1) ($92.9) ======== ======== ======== ======== Loss per share Basic ($ .10) ($ .09) ($ .20) ($ .27) ======== ======== ======== ======== Diluted ($ .10) ($ .09) ($ .20) ($ .27) ======== ======== ======== ======== Shares used in the per share computations (thousands): Basic 360,944 350,765 357,969 348,715 ======== ======== ======== ======== Diluted 360,944 350,765 357,969 348,715 ======== ======== ======== ========
  • 2. UNISYS CORPORATION SEGMENT RESULTS (Unaudited) (Millions) Elimi- Total nations Services* Technology* -------- -------- -------- ---------- Three Months Ended September 30, 2008 ------------------ Customer revenue $1,312.4 $1,152.1 $160.3 Intersegment ($67.5) 4.0 63.5 -------- -------- -------- -------- Total revenue $1,312.4 ($67.5) $1,156.1 $223.8 ======== ======== ======== ======== Gross profit percent 22.2% 17.6% 47.5% ======== ======== ======== Operating profit percent 2.9% 3.1% 11.0% ======== ======== ======== Three Months Ended September 30, 2007 ------------------ Customer revenue $1,393.1 $1,217.6 $175.5 Intersegment ($61.2) 3.4 57.8 -------- -------- -------- -------- Total revenue $1,393.1 ($61.2) $1,221.0 $233.3 ======== ======== ======== ======== Gross profit percent 22.2% 17.7% 44.6% ======== ======== ======== Operating profit percent 3.1% 3.6% 4.0% ======== ======== ======== Nine Months Ended September 30, 2008 ------------------ Customer revenue $3,953.7 $3,486.2 $467.5 Intersegment ($162.2) 9.4 152.8 -------- -------- -------- -------- Total revenue $3,953.7 ($162.2) $3,495.6 $620.3 ======== ======== ======== ======== Gross profit percent 22.5% 18.4% 43.4% ======== ======== ======== Operating profit percent 2.2% 2.9% 3.1% ======== ======== ======== Nine Months Ended September 30, 2007 ------------------ Customer revenue $4,116.8 $3,579.1 $537.7 Intersegment ($148.7) 10.9 137.8 -------- -------- -------- -------- Total revenue $4,116.8 ($148.7) $3,590.0 $675.5 ======== ======== ======== ======== Gross profit percent 21.0% 16.7% 43.7% ======== ======== ======== Operating profit percent 0.4% 1.7% 2.4% ======== ======== ======== * Results exclude cost reduction actions
  • 3. UNISYS CORPORATION CONSOLIDATED BALANCE SHEETS (Millions) September 30, 2008 December 31, 2007 (Unaudited) ---------- ---------- Assets Current assets Cash and cash equivalents $493.8 $830.2 Accounts and notes receivable, net 853.3 1,059.2 Inventories Parts and finished equipment 78.5 91.9 Work in process and materials 72.8 79.2 Deferred income taxes 18.0 18.0 Prepaid expense and other current assets 145.6 133.7 ---------- ---------- Total 1,662.0 2,212.2 ---------- ---------- Properties 1,307.8 1,336.9 Less accumulated depreciation and amortization 1,013.2 1,004.7 ---------- ---------- Properties, net 294.6 332.2 ---------- ---------- Outsourcing assets, net 348.9 409.4 Marketable software, net 244.2 268.8 Prepaid postretirement assets 603.8 497.0 Deferred income taxes 93.8 93.8 Goodwill 195.9 200.6 Other long-term assets 120.2 123.1 ---------- ---------- Total $3,563.4 $4,137.1 ========== ========== Liabilities and stockholders' equity Current liabilities Notes payable $0.0 $0.1 Current maturities of long-term debt 2.2 204.3 Accounts payable 337.5 419.6 Other accrued liabilities 1,092.1 1,272.0 ---------- ---------- Total 1,431.8 1,896.0 ---------- ---------- Long-term debt 1,059.7 1,058.3 Long-term postretirement liabilities 370.3 420.7 Other long-term liabilities 321.5 395.5 Stockholders' equity Common stock 3.6 3.6 Accumulated deficit (2,538.0) (2,465.9) Other capital 4,045.9 4,011.8 Accumulated other comprehensive loss (1,131.4) (1,182.9) ---------- ---------- Stockholders' equity 380.1 366.6 ---------- ---------- Total $3,563.4 $4,137.1 ========== ==========
  • 4. UNISYS CORPORATION CONSOLIDATED STATEMENTS OF CASH FLOWS (Unaudited) (Millions) Nine Months Ended September 30 ------------------- 2008 2007 ------- ------- Cash flows from operating activities Net loss ($72.1) ($92.9) Add (deduct) items to reconcile net loss to net cash provided by (used for) operating activities: Employee stock compensation expense (.2) 8.6 Company stock issued for U.S. 401(k) plan 34.2 34.3 Depreciation and amortization of properties 80.4 83.9 Depreciation and amortization of outsourcing assets 126.0 102.4 Amortization of marketable software 90.0 90.1 Disposals of capital assets 8.6 3.8 Gain on sale of assets (23.4) Decrease in deferred income taxes, net 8.9 Decrease in receivables, net 175.9 111.7 Decease (increase) in inventories 16.7 (15.6) Decrease in accounts payable and other accrued liabilities (215.9) (286.8) Decrease in other liabilities (27.9) (68.8) Increase in other assets (108.7) (28.7) Other 9.4 (1.7) ------- ------- Net cash provided by (used for) operating activities 116.4 (74.2) ------- ------- Cash flows from investing activities Proceeds from investments 4,838.1 5,785.7 Purchases of investments (4,847.9) (5,793.4) Investment in marketable software (65.9) (73.0) Capital additions of properties (51.8) (56.4) Capital additions of outsourcing assets (96.6) (108.4) Purchases of businesses (2.3) (2.0) Proceeds from sale of businesses 28.0 ------- ------- Net cash used for investing activities (226.4) (219.5) ------- ------- Cash flows from financing activities Net reduction in short-term borrowings (.1) (1.1) Minority shareholder dividends (5.8) Proceeds from exercise of stock options 12.3 Payments of long-term debt (200.0) Financing fees (.8) ------- ------- Net cash (used for) provided by financing activities (200.9) 5.4 ------- ------- Effect of exchange rate changes on cash and cash equivalents (25.5) 17.5 ------- ------- Decrease in cash and cash equivalents (336.4) (270.8) Cash and cash equivalents, beginning of period 830.2 719.3 ------- ------- Cash and cash equivalents, end of period $493.8 $448.5 ======= =======