![The
Hit
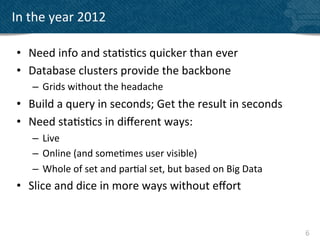
• Mornings
were
‘the
hit’
• The
joy
of
real
data
analysis
is
the
output
of
a
good
report
• Get
good
stats
– I
know
how
many
teachers
teach
Geography
in
Scotland!
– I
know
400
people
have
purchased
our
History
so]ware!
• The
wait
and
the
results
kept
us
working
4](https://image.slidesharecdn.com/mcbrown-130126064210-phpapp01/85/Bringing-back-the-excitement-to-data-analysis-4-320.jpg)
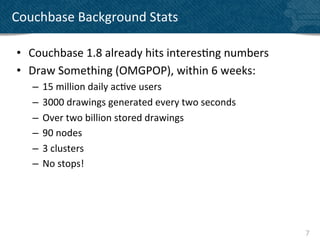
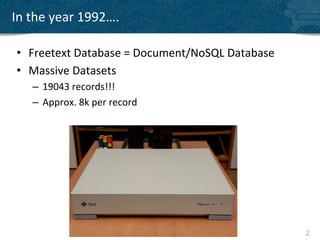
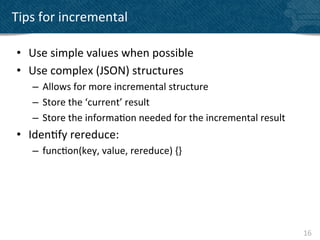
![Reduce
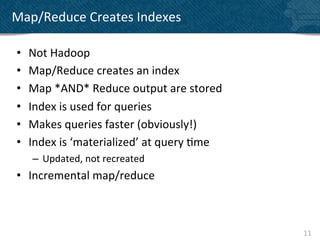
• Reduce
summarizes
data
• Built-‐in
func?ons
– _sum
– _count
– _stats
{!
"value" : {!
"count" : 3,!
"min" : 5000,!
"sumsqr" : 594000000,!
"max" : 20000,!
"sum" : 38000!
},!
"key" : [!
"James"!
]!
},! 13](https://image.slidesharecdn.com/mcbrown-130126064210-phpapp01/85/Bringing-back-the-excitement-to-data-analysis-13-320.jpg)
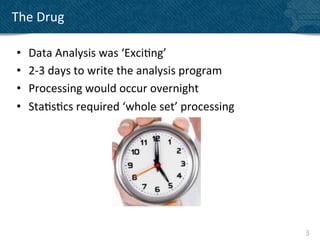
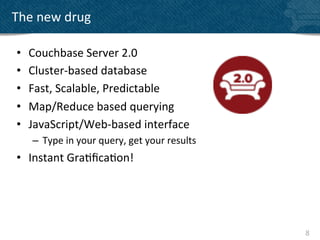
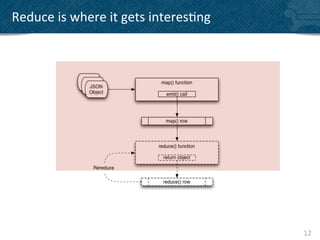
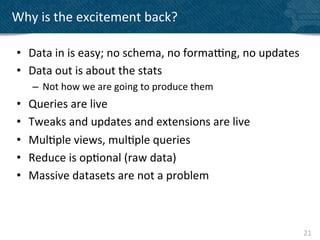
![Simple
reduce
(incremental
average)
function(key, values, rereduce) {!
var result = {total: 0, count: 0};!
for(i=0; i < values.length; i++) {!
if(rereduce) {
result.total = result.total + values[i].total;
result.count = result.count + values[i].count;
} else {
result.total = sum(values);
result.count = values.length;
}
}
return(result); !
}!
17](https://image.slidesharecdn.com/mcbrown-130126064210-phpapp01/85/Bringing-back-the-excitement-to-data-analysis-17-320.jpg)
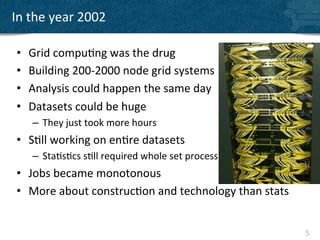
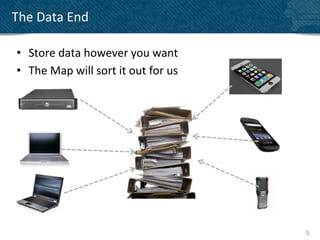
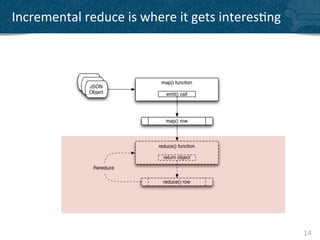
![Combining
Reduce
with
Complex
Keys
• Example:
logging
data
with
date?me
• Explode
the
date:
– [
year
,
month,
day,
hour,
minute]
• Now
you
can
query:
– Single
Date:
[2012,
9,
19]
– Mul?ple
Dates:
[
[
2012,
9,
19],
[2012,
9,
10]
]
– Range
(hours)
[2012,
9,
0,
9,
0]
–
[2012,
9,
30,
21,
0]
– Range
(days)
[
2012,
1,
1]
–
[2012,
9,
19]
– Range
(months)
[
2009,
9]
–
[2012,3]
• And
you
can
calculate
aggregate
sta?s?cs
18](https://image.slidesharecdn.com/mcbrown-130126064210-phpapp01/85/Bringing-back-the-excitement-to-data-analysis-18-320.jpg)
![Complex
reduce
function(key, data, rereduce) {!
var response = {"warning" : 0, "error": 0, "fatal" : 0 };!
for(i=0; i<data.length; i++) {!
if (rereduce) {!
response.warning = response.warning + data.warning;!
response.error = response.error + data.error;!
response.fatal = response.fatal + data.fatal;!
} else {!
if (data[i] == "warning") {!
response.warning++;!
}!
if (data[i] == "error" ) {!
response.error++;!
}!
if (data[i] == "fatal" ) {!
response.error++;!
}!
}!
}!
return response;!
}!
19](https://image.slidesharecdn.com/mcbrown-130126064210-phpapp01/85/Bringing-back-the-excitement-to-data-analysis-19-320.jpg)
![Complex
reduce
output
{"rows":[
{"key":[2010,7], "value":{"warning":4,"error":2,"fatal":0}},
{"key":[2010,8], "value":{"warning":4,"error":3,"fatal":0}},
{"key":[2010,9], "value":{"warning":4,"error":6,"fatal":0}},
{"key":[2010,10],"value":{"warning":7,"error":6,"fatal":0}},
{"key":[2010,11],"value":{"warning":5,"error":8,"fatal":0}},
{"key":[2010,12],"value":{"warning":2,"error":2,"fatal":0}},
{"key":[2011,1], "value":{"warning":5,"error":1,"fatal":0}},
{"key":[2011,2], "value":{"warning":3,"error":5,"fatal":0}},
{"key":[2011,3], "value":{"warning":4,"error":4,"fatal":0}},
{"key":[2011,4], "value":{"warning":3,"error":6,"fatal":0}}
]
} !
20](https://image.slidesharecdn.com/mcbrown-130126064210-phpapp01/85/Bringing-back-the-excitement-to-data-analysis-20-320.jpg)


This document discusses the evolution of data analysis and how Couchbase database can help make data analysis more exciting again. In the past, data analysis used to be exciting because it took days to write analysis programs and results were only available overnight. Now with Couchbase, queries can be built and results retrieved in seconds for huge datasets using MapReduce queries. Couchbase allows slicing data in many ways without effort through its database clusters and JavaScript interface.


![Big Data [sorry] & Data Science: What Does a Data Scientist Do?](https://cdn.slidesharecdn.com/ss_thumbnails/dslatcloudmsevent20130125-130126065651-phpapp01-thumbnail.jpg?width=640&height=640&fit=bounds)