Download as PDF, PPTX

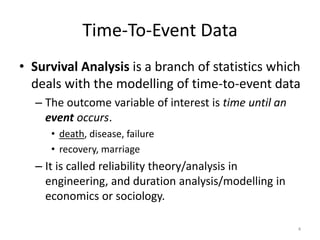
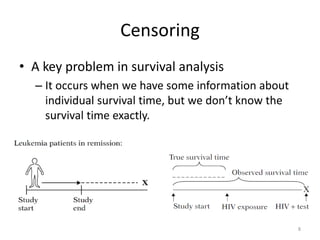
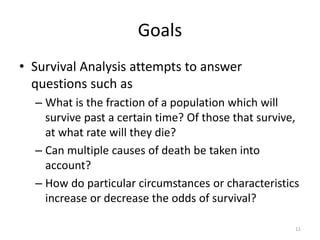


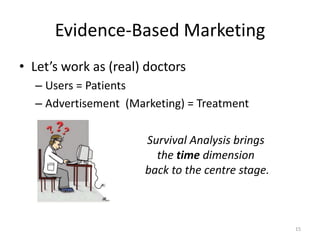


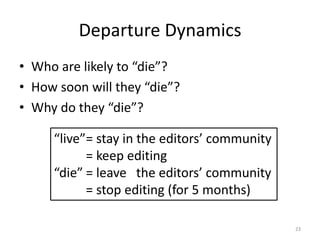

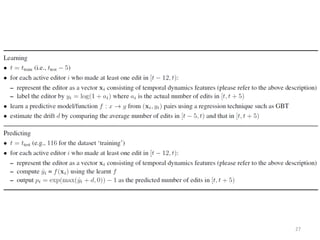

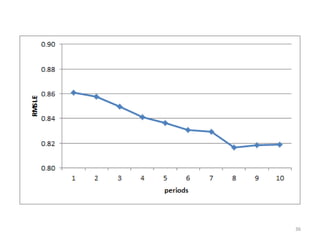
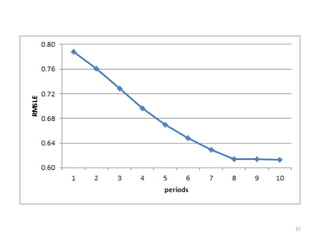

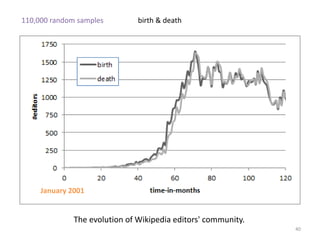
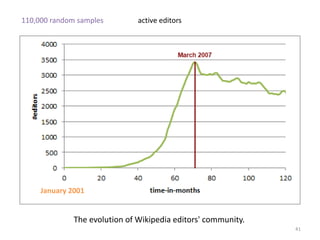
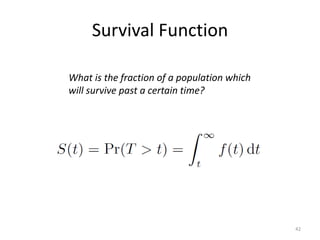
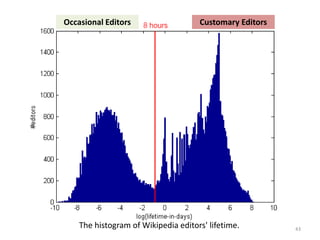
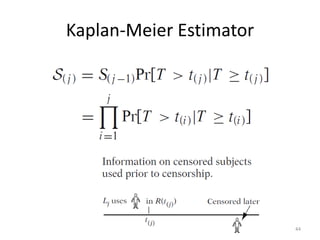
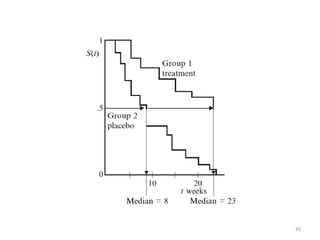
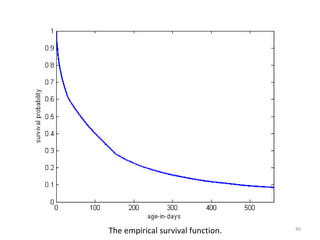
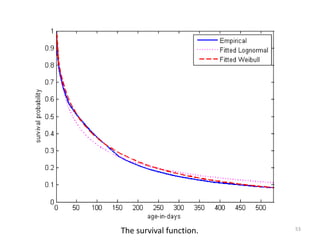
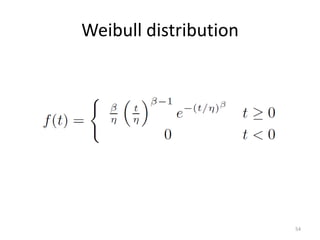
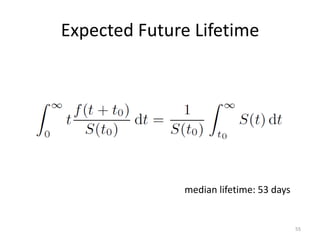
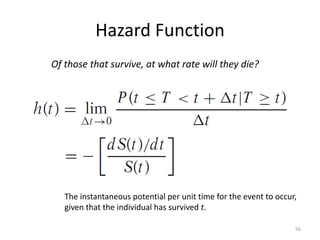
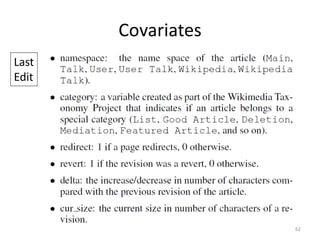
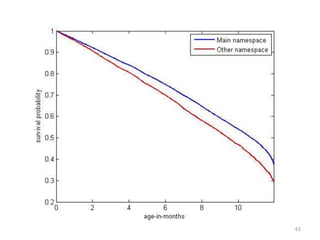
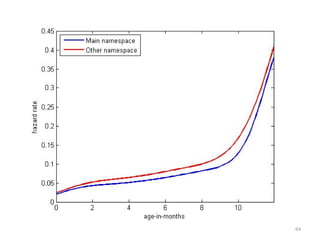
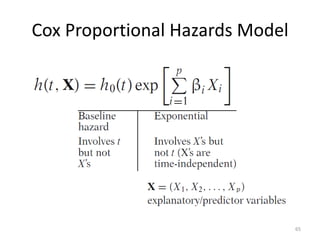
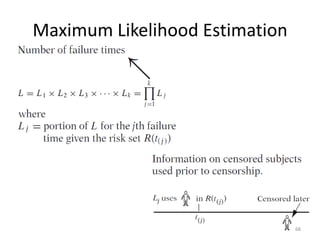
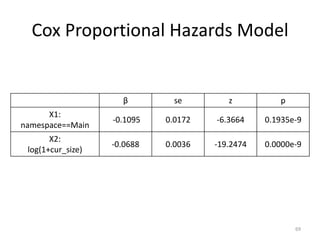
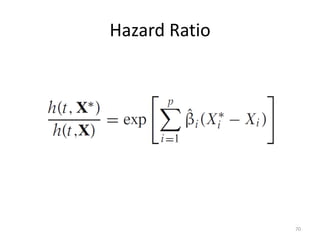
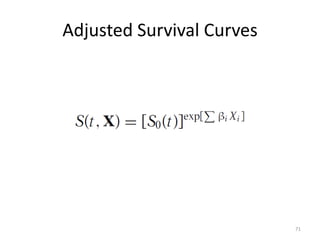
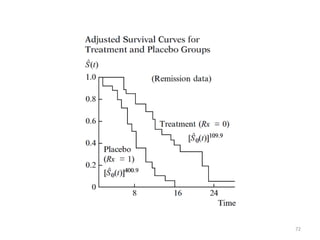


This document discusses survival analysis and its application to analyzing the departure dynamics of Wikipedia editors. It begins by defining survival analysis and its goal of modeling time-to-event data using techniques that account for censoring. A case study is presented on analyzing data from 110,000 Wikipedia editors to determine who is likely to stop editing, how long they will continue editing, and why they stop. Statistical techniques like the Kaplan-Meier estimator, Cox proportional hazards models, and adjusted survival curves are used to analyze editing durations and identify covariates that impact the hazard rate of editors stopping contributions.


![Big Data [sorry] & Data Science: What Does a Data Scientist Do?](https://cdn.slidesharecdn.com/ss_thumbnails/dslatcloudmsevent20130125-130126065651-phpapp01-thumbnail.jpg?width=640&height=640&fit=bounds)