SlideShare a Scribd company logo
Economic Insight
Issue 23
04.08.11
www.prsformusic.com/economics


Adding up the UK music industry 2010
                                             This is the third edition of Adding up the                 to demonstrate the true value of this
                                             UK music industry, yet it represents an                    fundamental part of the business.
                                             unusual first, with UK music industry
                                             revenues falling by 4.8 percent to £3.8bn                  The importance of UK music abroad
                                             in 2010. During the year, both recorded                    remains a core focus of this report, as it is
                                             and live music saw significant declines in                 where the most potential lies going
                                             revenues. To interpret this southward                      forward. International revenues remain one
                                             trend, demand- and supply-side factors                     of the key drivers of both PRS for Music
                                             must both be considered. On the demand-                    and PPL collections. We consider the
                                             side, the tightening squeeze on disposable                 success of UK labels and publishers
                                             income is forcing consumers to make                        overseas and take stock of PRS for Music’s
Prepared by Will Page and                    tough spending choices. On the supply-                     members’ ability to outperform the US in
Chris Carey, PRS for Music.                  side, many major touring acts were not on                  exporting repertoire abroad. The fact that
                                             the road in 2010, and with less supply                     music and media are among the few export
                                             comes less demand.                                         industries the UK truly excels in is
                                                                                                        expanded upon in our concluding remarks.
                                             This year, we’ve made significant
                                             methodological advances, the most                          The driving force for this third edition
                                             important of which is within the UK music                  remains the same: the better we
                                             publishing business. We now value UK                       understand this complex business, the
                                             music publishing direct revenues at almost                 better it will perform. We are therefore
                                             £250m, a significant upward revision.                      indebted to the collaborative working
                                             Consequently, UK music can take some                       spirit of the UK music and media sectors
                                             pride in that we are now one of the few – if               for their contributions.
                                             not only – countries in the world to be able


                                           Headlines and footnotes
                                           This report is unprecedented in the music industry as it
                                                                                                           The big numbers for 2010
                                           involves all the major stakeholders putting their cards
                                           on the table, so that the seven core revenue streams              UK music exports
                                           can be calculated, collated and constructed into one              continue to grow,
                                           meaningful table. But before going to the table to grab
PRS for Music represents over 80,000       the headlines, it’s important to be clear on the                  outstripping even
songwriters, composers and music           footnotes. It’s important to recognise what the report            the US
publishers in the UK and protects the      is, and what it isn’t. The most common question that
rights of international songwriters
through over 150 arrangements with         industry stakeholders ask about UK music is ‘how is it
international bodies.                      doing?’ This is a turnover-based question, which seeks            Total UK music revenues
                                           to discover whether there is more, less or the same               down in 2010, falling
Disclaimer: This report is provided to     revenue coming in compared to a year ago.
intended recipients for information                                                                          4.8 percent to £3.8bn
purposes only, and should not be relied
on for any other purpose. The report       In Adding Up we answer this frequently asked question,
should not be reproduced, transmitted      and do so by focusing on turnover. We do not attempt to
or disclosed to any other person without   present financial accounts that have their own regulated          Industry adapting to
the prior consent of PRS for Music.
                                           reporting standards. Nor do we attempt to present the             change with growth
For further enquiries, or to request       value of UK music to gross domestic product (GDP) for             reported in B2B licensing
permissions, please contact                inclusion in official government accounts. That is the job
press@prsformusic.com
                                           of accountants and government statisticians. We focus
                                           instead on turnover, which tells us if markets are
                                           growing, stagnating or shrinking.

                                                                                                                                              Page 1 of 10
Reading beneath the top line
As with last year’s report, three questions will punctuate each of the            included. Consequently, we do not pick up the revenues of UK artists
revenue lines.                                                                    like Coldplay when they tour France, for example. For business-to-
                                                                                  business (B2B) revenues, we capture flows into the UK from affiliates
   How do we accurately define 2010?                                              (e.g. GEMA in Germany) and net-off money that the UK sends overseas
   What exactly is the UK music industry and where do we draw the line?           to affiliate organisations (e.g. ASCAP in the US). Importantly, this new
                                                                                  exports-minus-imports adjustment better enables us to add the
   Are the terms B2B and B2C still the right way to carve up revenues?
                                                                                  contribution of the UK collecting societies into GDP, and allows other
                                                                                  countries to replicate this methodology without double counting.
Firstly, we take an activity approach to the calendar year. If tickets were
purchased for a festival a year in advance, which is often the case, we           Thirdly, we maintain a view that the best way to add up the industry is
re-scale the data to ensure that the revenue numbers are reflective of the        to separate out the revenues into B2C and B2B. The increasing
activity that took place within that calendar year. We also re-work previous      diversification of revenue streams helps illustrate why. Record labels,
years' analysis to ensure that the critically important year-on-year trend is     for example, are moving towards an impressive one-in-three rule where
consistent and meaningful to the reader.                                          one third of trade revenues come from outside the physical product
                                                                                  market. In addition to this, there is a growing B2B revenue stream from
Secondly, and perhaps most puzzlingly, how do you define the UK? In the           licensing activity.
context of business-to-consumer (B2C) revenues, if the US band Bon Jovi
sell out the O2 Arena to tourists who have flown in from South East Asia,         With this clarity on caveats, we can now go back to the headlines and work
then is that actually UK revenue? We are asking what activity took place in       through the big numbers in this year’s table, before distilling each sector
the UK, and what revenues it produced; therefore this revenue would be            down individually.


 Adding up the UK music industry
 £m                                                                                                        2009               2010              Change
 BPI retail value of recorded music                                                                       £1,343             £1,237              -7.9%
 Estimated value of live music                                                                            £1,589             £1,480              -6.8%

 PRS for Music gross collections                                                                           £431               £425               -1.3%
 Adjustment for mechanical revenue                                                                         (£89)              (£81)
 Adjustment for live revenue                                                                               (£23)              (£20)
 Adjustment for international payments                                                                     (£80)              (£85)


 PPL and VPL gross collections                                                                              £66                £79              18.9%
 Adjustment for recorded B2B revenue                                                                       (£72)              (£72)
 Adjustment for international payments                                                                     (£2.7)            (£3.0)


 Estimated record company B2B revenue                                                                      £204               £218               7.2%
 Publisher direct revenue (excluding PRS for Music)                                                        £241               £242               0.6%


 Advertising and sponsorship revenue                                                                        £90                £94               4.2%

 Business-to-consumer total                                                                               £2,932             £2,717              -7.3%
 Business-to-business total                                                                               £1,032             £1,058              2.6%
 Total B2B and B2C value                                                                                  £3,964             £3,775              -4.8%

Are recorded music revenues back on a slippery slope?
While 2009 was the year when UK retail spend stabilised (and trade                the main international recorded music industry markets, with the IFPI
revenues actually grew), there is an eerily familiar slippery slope feel to the   reporting global digital trade value up only 5.3 percent to $4.6bn in 2010.
2010 figures, with the second largest percentage fall in trade revenues since     Put more bluntly, global digital revenues are not going to be the ‘$30
records began . While steep falls in physical revenues continued apace in         billion dollar baby’ people talked about five years ago. Indeed they may
2010, there were clear signs that growth in digital revenues slowed across        stabilise at around $5bn over the medium term.


                                                                                                                                                    Page 2 of 10
A global perspective
The IFPI Recording Industry in Numbers 2011 publication reported an         Before considering the prospects for 2011, it is well worth taking time
eight percent fall in revenues in 2010, driven by a 14 percent drop in      to ask a question that is incredibly complicated to answer: what is the
physical off-setting the five percent gains in both digital and             value of digital in the UK, and to whom? In this instance, we will
performance right revenue. Reading beneath the top line, the top two        answer on behalf of music rightsholders.
markets (US and Japan) were responsible for 50 percent of the decline
in 2010, compared with 80 percent in 2009. Compounding the overall          Firstly, the OCC and BPI estimate the retail value of digital at an
declines were the UK and Australia, both of which had stabilised back in    impressive £316.5m in 2010, up 18 percent on the previous year. By
2009, before reporting large falls in 2010. Outside of the large            definition, retail is a B2C value as it captures consumer spend. We can
established markets, South Korea, India and many Latin American             strip off a notional £47m in VAT using a rate of 17.5 percent (it will be
markets reported growth, with Brazil overtaking Spain to claim tenth        lower for many of the transactions which took place) and from the
spot in the IFPI rankings. Indeed, the market in Spain (a western           net amount remove the trade value of £215m to show an effective
European market with 46m people and an advantageous language) is            retailer margin. Using these published retail and trade values, VAT
now so depressed that 3,000 album sales will often get an artist to         works out as £47m, leaving retailers with a margin of £56m. Of
number one. Should declines continue at their current pace, it is           course, with a lower VAT rate, retailer margin will widen further.
conceivable that Spain could drop out of the top twenty within three
years, possibly being overtaken by countries such as India and South        However, the value of digital music to rightsholders also includes
Africa – which is a timely reminder of the increasing relevance of these    two other revenues. Firstly, there are B2B record label licensing
re-emerging markets.                                                        revenues from models such as ad-supported services. Secondly, the
                                                                            authors’ value of digital rights in the UK, which is not captured in
Back to Blighty                                                             the trade value as the rights are licensed directly by collecting
                                                                            societies such as PRS for Music and SACEM and agencies such as
Although the southward trend in the UK market has re-emerged,
                                                                            CELAS. In the table below, we accommodate this by adding £12.5m
there is some good news that needs to be kept in mind. UK music
                                                                            in ad-supported revenues for the labels and £34.2m in songwriter
continues to remain relatively and comparatively strong. In per capita
                                                                            copyright1. Consequently, a more specific question is ‘how much is
terms, the UK remains one of the top three recorded music markets in
                                                                            digital music worth in the UK to rightsholders in 2010?’ The answer
the world, towering above the US market, and remains number one in
                                                                            is an impressive £260m.
terms of European digital revenues, with Norway a close second. In
addition, when artists break big in the UK, their hits sell volumes
rarely seen anywhere else. The US act Kings of Leon’s Only by the
                                                                             Value of digital music in the UK to music rightsholders 2010
Night sold more in the UK (2.6m) than the USA, and is one of five
artist albums to have sold more than two million copies in the UK in         £m
recent times – alongside Lady Gaga, Take That, Adele and the late
Amy Winehouse – a respectable watermark by any standard.                     Retail value of digital music                                                                 £316.5
                                                                             Less: VAT @17.5%                                                          (£47.1)
Delving into the statistics, three observations help to form a view of
what happened last year. Firstly, the aggregate trade value of physical      Retail value less VAT                                                                         £269.4
albums has near enough halved in five years, and now appears to have         Less: retailers' margin                                                  (£56.0)
entered into an accelerating rate of decline. Consequently, the make-
up of the recording industry trade revenues is changing faster than          Trade value of digital music to labels                                                        £213.3
anyone could have predicted; in 2009 £1 in every £5 came from
                                                                             Add in: labels B2B revenues                                                £12.5
outside physical revenues, half way through 2011 and it’s now looking
close to £1 in every £3.                                                     Add in: authors' digital collections                                       £34.2
Secondly, the spiky nature of demand re-emphasises how critical the          Uk digital value of music rights                                                              £260.0
fourth quarter is to the overall picture, generating 40 percent of total    1 The value of songwriter copyright online in the UK was calculated through three steps. Firstly, we took
trade value for the year, with physical product still making up three-        the value of PRS for Music online licensing for UK markets. Secondly, we estimated the value of UK online
quarters of that demand. Fourth quarter 2010 was a particular                 songwriter copyright which was paid through to other licensing organisations such as CELAS and SACEM
                                                                              for transactional UK activity. Thirdly, we scaled UK revenues to reflect non-transactional blanket deals
disappointment: the value of sales fell by 16 percent in the final three      that took place in the 2010 calendar year.
months of the year, accounting for 60 percent of annual losses. The
notable explanations for the disappointing fourth quarter included the      Looking ahead to 2011, the success of Adele is as welcome as it
exceptionally bad weather (which affected distribution as well as           is worrying, as this 23-year-old artist was responsible for almost
consumption), competition from other media goods such as computer           10 percent of all artist albums sold in the first four months of the
games, ongoing pressure on retail space and the persistent presence         year. While her feats at home and abroad are worth celebrating,
of unlicensed digital content on ISP networks.                              what’s worrying is the performance of the rest of the market, with
                                                                            continued declines in physical value and modest digital growth.
Thirdly, there are two supply-side developments worth noting: the           Significant supply-side adjustments are taking place too, with
release schedule may have lacked the strength of the previous year, with    retailers and wholesalers seeking new ways to balance risk in the
half of the top ten selling albums in 2010 being either 2009 releases       supply chain. All of this needs to be set against the state of the
(Lady Gaga, Michael Buble and Paolo Nutini) or compilations (Now That’s     economy, and the squeeze on consumers’ wallets with spending
What I Call Music 76 and 77). Also, new BPI research on breakthrough acts   cuts, tax creep and oil prices already compounding an inflationary
– bands that pass 100,000 album sales for the first time – show that        problem which is eroding earnings and savings. All these factors are
2010 hit a new low, with only 17 UK acts making it past this watermark,     likely to force the consumer into some tough choices about their
compared to a broadly consistent 25 in recent years.                        entertainment budget (see box overleaf).


                                                                                                                                                                            Page 3 of 10
Events up, recordings down

  The chart below expands upon a recently published paper titled                 office spend broadly constant, which means absolute value growth
  Wallet Share by breaking down the respective shares of total                   as total consumer expenditure grew throughout this period. The light
  consumer UK expenditure on live and recorded music from 1997 to                red line shows recorded music’s wallet share declining from 2001,
  2010. In addition, the shares of box office, video retail and rental            while the light blue line shows DVD retail-and-rental wallet share
  spend are also plotted. A working hypothesis by economists at PRS              following a similar path from 2004. Here, it’s worth pointing out one
  for Music is that people are spending more of their money on events            blatantly obvious point: both cinema and concerts involve some form
  and less of their money on recordings of events. Put simply, they go           of excludability – security guards – which means you have to pay to
  to gigs and the cinema more but buy CDs and DVDs less. The dark                get in. Since broadband hit critical mass in the UK in 2001, this has not
  red and dark blue lines show live music growing consistently and box           been the case for media files on networks.


  Wallet share of events versus recordings
  Source: BPI, BVA, Screen Digest, ONS and PRS for Music
                                                                                                       DVD retail and rental
            0.40%                  Recorded music's                                                    wallet share starts
                                   wallet share starts                                                 declining in 2004
                                   declining in 2001


            0.30%


            0.20%


            0.10%

                                                                                            Recorded music spend as a share of total consumer expenditure
                                                                                            Live music spend as a share of total consumer expenditure
                                                                                            DVD retail and rental spend as a share of total consumer expenditure
            0.00%                                                                           Box office spend as a share of total consumer expenditure

                      1997     1998     1999      2000    2001     2002      2003    2004     2005      2006       2007      2008       2009 2010 (Est.)


Live music: where supply dictates demand
Live music finds itself in unfamiliar territory in this year’s report, having     From statistics to the reality of bands on the road, this supply-side
experienced a fall in primary ticket revenue for the first time in recent         story is born out in the acts that performed last year. In 2010, a number
history. Primary ticket sales fell from £956.9m in 2009 to £843.5m in            of stadium- and arena-filling bands were not on tour (Rolling Stones,
2010, a fall of 11.8 percent. The secondary market (those tickets traded         Coldplay, Take That) and many of those that did tour opted to play
on resale sites, such as GetMeIn, Seatwave and Viagogo) grew by £21m,            smaller venues in order to limit their risk (Kings of Leon and Rod Stewart
with arenas accounting for the greatest volume of tickets traded. At-the-        played arenas rather than stadiums). This risk-averse behaviour is rational
event spend (often referred to as ancillary revenues), which had grown           in the current economic climate. Last year, we championed the success of
nearly 60 percent over the previous five years, also faltered in 2010,            music against the rest of the economy, whereas this year it feels as though
falling 3.5% to £444m (from a revised £460m) as a result of fewer people         the economic downturn has caught up with the live music industry, and
going to live events. However, when people did go out, they spent similar        promoters and bands alike have responded accordingly.
amounts to the previous year. Consequently, total live revenues fell from
£1.59bn to £1.48bn, down 6.8 percent.                                            To gauge the performance of festivals and arenas, it’s worth looking at
                                                                                 the UK market against the backdrop of Europe, as the two are intrinsically
It would be very tempting to look at these numbers and jump towards a knee       linked. Arena tours are rarely confined to the UK only, and many UK festival
jerk reaction that the live music bubble has burst. We should not. Instead,      promoters are now developing events overseas, such as Benicassim in Spain,
we should develop a broader understanding of the dynamics at play in the         and are deliberately marketing them to the UK audience. The UK festival
market. While UK festivals performed strongly, and arenas and mid-sized          market saw its primary ticket revenue increase by nearly 20 percent. This
venues held up, there was a striking decline in the number of stadium gigs in    growth was the result of both the increasing capacity of existing festivals and
2010 compared to the previous year. It was this reduction in supply of stadium   the increasing number of festivals, up 16 percent on the previous year.
concerts that accounted for almost two-thirds of the fall in revenue.


                                                                                                                                                             Page 4 of 10
A similar growth story can be observed across Europe, with a                    in their 40s. Only six percent of the top 20 were in their 30s, with no-one
comprehensive IQ Magazine survey finding that capacity of European                in their 20s appearing. The question is this: against the backdrop of falling
festivals was up 15 percent and attendances grew by six percent, with sell-      record sales, who is putting the time, money and expertise into developing
outs increasing by 10 percent - a ‘build and they will come’ success story.      the arena, festival and stadium acts of the future?
A side issue that is clouding this growth story and increasingly gathering
the attention of managers is the calendar period in which festivals take         Collecting societies: growing musical exports, importing collections
place, which has stretched from July to August to a much broader May to
                                                                                 The two UK music collecting societies presented a contrasting picture for
October. There is a plausible argument that this is now crowding out the
                                                                                 2010. PRS for Music collections fell for the first time in recent memory but
conventional touring calendar for emerging bands, with some fans saying:
                                                                                 distributions were almost flat – indicating productivity gains. PPL, on the
‘Why would I pay £30 to see you in spring, when I’ve already spent £200 to
                                                                                 other hand, reported an increase in collections, but the growth in distribution
see you in the summer?’
                                                                                 was distorted by a one-off charge resulting from a tribunal decision. It is worth
                                                                                 remarking upon the relative stability shown by both societies over the past
The UK arena market offers a less rosy picture, with PRS for Music
                                                                                 few years in the face of the deepest recession in a generation. This is a useful
revenues from arenas falling two percent in 2010. The National Arenas
                                                                                 indicator of the merits of collecting societies in providing a stable source of
Association’s (NAA) report also showed that, while music continued to
                                                                                 revenue for artists, songwriters, labels and publishers.
make up 60 percent of arenas’ footfall, music attendances were down
20 percent on 2009, as the volume of shows dropped sharply. Again,
                                                                                 Firstly, we should explain an important adjustment to these numbers.
the supply-side story can be drawn upon here by pointing out that
                                                                                 For both societies, we add international collections, as done in previous
performances were down six percent. The most striking observation of the
                                                                                 reports, but now net-off the money sent to overseas affiliates. So, PRS
NAA report was the dominance of the X Factor tour, which had 478,000
                                                                                 for Music brought in an impressive £170m in international revenues from
attendees – reiterating the importance of hits in a market awash with
                                                                                 around the world, but sent out £85m to affiliates such as ASCAP and BMI.
choice. The European arenas market showed similar trends, with IQ’s
                                                                                 In this year’s report, we adjust for double counting and include the net
survey reporting attendances for music events at arenas falling 16 percent
                                                                                 amount of £85m. Similarly for PPL, we add in the £32m of international
on the year while ticket prices grew by two percent.
                                                                                 revenues which feature in their gross collections, but net off £3m PPL sent
                                                                                 out to overseas affiliates, and therefore report the net amount of £29m.
Looking ahead to 2011, most market players and observers are confident
that headline revenues will bounce back, due at least in part to the supply
                                                                                 In 2010, PPL collections grew by 10.7 percent to £143.5m, making it one
of big bands on tour in the UK. Rihanna, Westlife and Justin Bieber are all
                                                                                 of the world’s largest performance rights societies. Its total distributable
noteworthy additions to the 2011 arenas calendar. The impact of Take That
                                                                                 revenue was up 33.6 percent to £124.1m, but the sharp rise was due to the
touring the UK was visible in the 2009 revenues, and noteworthy by their
                                                                                 fact that 2009’s total had been hit by the UK Copyright Tribunal’s decision
absence in 2010. They are back on the road in 2011, playing to 1.7m people.
                                                                                 affecting licence fees payments between 2006 and 2009.
While we are not saying that one band makes a market, a tour of this scale
really is a ‘needle mover’.
                                                                                 Growth was reported across all three PPL revenue streams of public
                                                                                 performance, broadcast and international, with the last of these
Our view is that the live music business is not entering a cycle of boom and
                                                                                 producing the most notable headlines, up 49 percent to £31.7m in 2010.
bust, but rather showing signs of maturity and cooling to a more sustainable
                                                                                 This is a continuation of the £92m success story that resulted from the 52
growth path, after a period of unprecedented growth. What this analysis
                                                                                 international reciprocal contracts PPL has established in 28 countries in
does tell us is twofold. Firstly, that supply dictates demand, and secondly,
                                                                                 the past seven years. Going forward, international revenues will remain an
that demand will be increasingly spiky over time. Looking further ahead, it
                                                                                 increasingly important part of the PPL story.
is right to highlight the aging population of live music performers (see chart
below). Deloitte plotted Pollstar’s top grossing US tours of the decade by
                                                                                 On the other hand, PRS for Music collected a total of £611.2m in royalties
age of lead singer in 2011, finding that 40 percent of the top 20 acts will be
                                                                                 in 2010, down 1.1 percent on the previous year’s record of £618.2m – the
in their 60s in 2011. A further 19 percent will be in their 50s and 35 percent
                                                                                 first drop in collections in recent memory. An 8.8 percent drop in recorded
                                                                                 music sales contributed to the £7m decline in royalties collected. This
 Pollstar top grossing US tours of the decade,                                   was offset by a 4.3 percent growth in royalties from digital services, a
 by age of lead singer in 2011                                                   1.9 percent rise in radio royalties, and cost savings of nearly 10 percent.
                                                                                 As such, net distributable revenue fell just 0.2 percent last year, from
 Source: Pollstar, Deloitte                                                      £548.8m in 2009 to £547.9m in 2010.

                                                                                 The international success story of PRS for Music has been well documented
                      6%                                                         in the past, with the UK being one of only three net exporters of musical
                                                                                 repertoire, along with the US and Sweden. Interestingly, in 2010 Sweden
                                                                     60s         sent out more than it brought in, so now we are down to only two.

                                                                     50s         When we looked more closely at these remaining two net exporters, in
       35%                                40%                                    particular PRS for Music in the UK and the main US societies ASCAP and
                                                                                 BMI, we found that PRS for Music members significantly outperformed
                                                                     40s
                                                                                 their equivalents across the pond in terms of net trade balance – money
                                                                                 in minus money out. The chart overleaf illustrates the index of this
                                                                     30s         trade balance to show the net export growth of the two markets.
                                                                                 What is striking is that the relative growth of the UK has significantly
                                                                                 outperformed the US, increasing its trade balance 165 percent from
                         19%                                                     $35m in 2004 to $95m in 2010. By comparison, the two US societies
                                                                                 have grown their balance by 44 percent from $310m in 2004 to $452m

                                                                                                                                                      Page 5 of 10
in 2010. It’s worth noting that, while this is an index of a net figure, the     at $474m. This tells us that whilst all three societies have seen steady
analysis remains robust when you think comparatively: if you were to            growth of 20-30 percent in money sent out to affiliates (imports), PRS for
multiply PRS for Music’s money in and money out by a factor of five to           Music has almost doubled its incoming revenue (exports), outperforming
reflect the US’ greater population, the balance would be broadly similar         the US societies by a factor of three.


 Index of money in less money out: trade balance of US and UK PROs
 Source: CISAC
                 300
                               PRS for Music trade balance
                                                                                                                                  265
                               ASCAP and BMI trade balance
                 250


                 200


                 150
                                                                                                                                  144


                 100
                            2004              2005             2006             2007            2008            2009              2010


What the export performance of PRS for Music and PPL tells us is that            2009 numbers to produce a consistent year-on-year change for the report.
for artists and songwriters, the potential to build upon an impressive
international track record is huge. Whether it’s the US performance right        As such, we are able to revise our 2009 valuation of publisher non-society
debate, or the growing importance of markets like Brazil, Russia, India and      revenues from £103m to £241m. The 2010 figure is broadly constant at
China (BRICs), the UK as a net exporter is well positioned to benefit from        £242m, increasing just 0.6%, with growth in sync being offset by falling
growth in these re-emerging markets. Indeed, given the current economic          collections from societies outside the UK. This suggests some stability in the
climate, there may well be more potential overseas than there is back at         aggregate publisher revenue.
home – a topic we will return to in our conclusion.
                                                                                 A good proportion of these revenues is derived from the sub-publishing
Publisher direct revenues: new insights, significant revisions                    revenue, which in most countries comes through collecting societies such
                                                                                 as GEMA or SACEM. A fifth of the revenue is derived from sync licensing
Of the seven revenue streams which make up the UK music industry
                                                                                 income paid to UK publishers. UK-based sync (turquoise area in chart
in this annual report, publisher direct revenues have always been the
                                                                                 overleaf) captures revenues paid from UK users to publishers for the use
most challenging to calculate due to the lack of existing industry data.
                                                                                 of UK originated works and the local publisher share of non-UK originated
Compounding the complexity further is the nature of music publishing
                                                                                 works. The non-UK based sync (orange area) captures revenue flowing back
itself, which is beyond generalisation as there are so many different players
                                                                                 from overseas for the use of UK originated tracks, net of the local publisher’s
operating in so many different markets, from grand rights to computer
                                                                                 share. As with other methodology within this work, these actions are taken
games. Reassuringly, this year’s Adding Up report can offer an important
                                                                                 to allow other countries to replicate this work for their own region without
advances in understanding this often misunderstood, yet fundamental,
                                                                                 double counting.
part of the music industry.
                                                                                 Looking beneath the top line, what is perhaps most striking in the chart
By working with the Music Publishers Association (MPA), we were able to
                                                                                 below is the stability shown in the five publishing revenue streams
survey its membership at a granular level, to appreciate the diverse set of
                                                                                 over the three years. There are some notable winners and losers worth
revenues and calculate the value of each. Thanks to the MPA, we are now
                                                                                 highlighting. Synchronisation of UK works abroad has grown from £25m
able to offer a more comprehensive summary of direct publisher revenues,
                                                                                 in 2009 to £34m, while sync within the UK has grown £1m during
which goes far beyond the 40:40:20 (mechanical:performing:sync) rule of
                                                                                 the same period, again stressing the importance of exports. UK print
thumb that existed before.
                                                                                 revenues have stayed remarkably constant over the past three years.
                                                                                 Unsurprisingly, mechanical licensing income (which is collected through
The survey, which was conducted by the MPA and economists at PRS for
                                                                                 MCPS and hence excluded) has been on a steep downward trend for the
Music, focused on the core membership of the trade body, and breaks down
                                                                                 best part of a decade, yet the fact that each of these revenue streams
publisher revenues into key streams (e.g. sync, grand rights, print) and then
                                                                                 have shown stability illustrates one of the core strengths of the music
into geography (UK revenues and international receipts). The survey gathered
                                                                                 publishing business: a balanced portfolio with many royalty eggs in
data from the past three years, which allows us to backdate the 2008 and
                                                                                 several revenue baskets.
                                                                                                                                                    Page 6 of 10
UK music publisher revenues excluding PRS for Music payments, 2008-10
  Source: MPA survey of members and PRS for Music calculation (£m)

     £250
                                                                                                         Other revenue (inc. exceptional items)

                                                                                                         Grand right licensing
     £200

                                                                                                         Sync licensing (non UK-based)

      £150                                                                                               Sync licensing (UK-based)

                                                                                                         Printed music sales (inc. sales, hire, licensing)
      £100
                                                                                                         Other collecting societies

       £50                                                                                               North American collecting societies

                                                                                                         European collecting societies
        £0
                      2008                         2009                          2010


Record companies: no longer just a wholesaler of music
‘We’re no longer just a wholesaler of music,’ stated Paul Smernicki, Director     the majority of record label revenues come from outside the physical
of Digital at Universal Music Group, in a recent article in The Economist.        product market.
This astute observation acknowledges that, as their traditional business
declines, record labels are becoming more skilled at licensing live music         There is a push-and-pull element to what’s driving revenues in this
and merchandise. The growth in B2B revenues of 7.2 percent to £218.4m,            sector. The developments in the computer games sector have helped pull
the fourth consecutive year of reported growth, shows that labels are             revenues forward. Year-end statistics from GfK Chart-Track reveal that unit
reallocating their resources into B2B markets. Put more bluntly, the growth       sales of music games in the UK increased by 13.7 percent in 2010, against
in this sector illustrates the old adage ‘you only get out what you put in’.      an overall decline of 14.3 percent. Hence, the growth areas in computer
                                                                                  games are driven by music, such as Michael Jackson: The Experience, which
To recall, B2B revenues are a combination of the five revenue streams              in turn drives sync revenues for both record labels and music publishers.
that the BPI previously defined as secondary revenues, along with the              Indeed, the developments with Lady Gaga and Farmville may well mark a
additional B2B revenues that arise from ad-funded digital models. Those           new beginning in this convergence story.
five revenue streams are comprised of: (i) the £73m in public performance
licensing PPL has passed on to the labels, (ii) synchronisation revenues,         Similarly, developments in merchandising have increased secondary
(iii) premium revenues from covermounts and consumer promotions,                  revenues. In the past, a label might acquire a t-shirt manufacturing
(iv) artist-related income from merchandising and touring and (v) ‘other          company with the intention that artist deals would simply encompass
income’, which refers to record company share of revenue from shows or            merchandise revenues from touring. Now, that t-shirt company will have
films, and record company income from music-related TV productions.                diversified its product range from hooded tops to high-level fashion and
On this occasion, detailed analysis of company accounts allowed us to             diversified its retail outlets from concert stalls to the High Street and
estimate the value of these five revenue streams at £206m in 2010, up              airports. This in turn brings a better proposition to artists, which then
6.5 percent on £193.5m in 2009. On top of this is a further £10.8m in ad-         allows broader deals to be done, and secondary revenues to grow.
funded digital and £1.6m from other digital sources not captured in the
retail value of music. As such, B2B revenues total an impressive £218.4m.         Artists and managers are utilising direct-to-fan tools more, plus they are now
                                                                                  able to make better make-or-buy decisions as to what services they acquire
This £218.4m in secondary revenue is in addition to the £213m in digital          and what they can do themselves. This internal competition is forcing the
trade revenue highlighted in the earlier table. So, the combined total of         labels to advance their offer in terms of products, services and expertise.
label revenue that does not come from the declining physical product
market is a healthy £431m, or 41 percent of the total – highlighting the          Advertising and sponsorship
growing importance of diversification to the modern UK record label. This          We have continued our partnership with FRUKT Communications to
observation may irritate the industry, with many an external armchair critic      improve our understanding of this unconventional part of the UK music
still touting the observation that labels are dead and therefore they need to     industry. As before, we have identified six primary channels where brands
diversify. Yet the evidence asserts this has already happened. In fact, we are    can spend money on music. The table provides definitions for each of the
possibly only one Adding Up report away from stating that                         six categories, as well as the headline numbers.

                                                                                                                                                      Page 7 of 10
Channel                                               FRUKT definition 2010                                          Spend (£m)          Share
 Live music               The spend on sponsorship rights and direct (e.g. on-site and at event) activation              £32.9           35.1%
 sponsorship              costs for festivals
 Event creation           The creation of custom experiential (e.g. event-based) activity; includes all                   £8.1           8.7%
                          direct activation costs for event
 Artist endorsement The use of image rights and appearances of artists to endorse a specific brand/                        £3.3           3.5%
                    product/service
 Digital                  The creation of specific music-focused digital and mobile activities, as                         £7.3            7.8%
                          standalone platforms or within wider music campaigns
 TV                       Sponsorship of existing music-specific or music-focused TV programs and the                     £21.8           23.3%
                          creation of ad-funded TV activity
 Advertising support The use of above the line (ATL) advertising and below the line (BTL) promotions                     £20.2           21.6%
                     to support existing music campaigns (e.g. festival activity, venue naming,
                     custom events, artist endorsements)
 TOTAL                                                                                                                   £93.6


The aggregate spend of nearly £94m represents an increase of 4.2          towards more complex multi-channel activations. Furthermore, the
percent, and is largely a result of growing sophistication within the     growing reach of both festival and digital channels into lucrative 18 to
space, as brands become more sophisticated in engaging consumers at       35 year-old audience means that rights and media owners can demand
events, online and through traditional advertising, competitors and new   higher investment rates. The year-on-year movement across the six
entrants are forced to move away from simple badging and sponsorship      categories is illustrated in the chart below.


  Year-on-year change in music advertising and sponsorship revenues, 2009-10
  Source: FRUKT


      17.5%                                                                       16.3%

                                                             13.8%
      12.5%


       7.5%         6.8%


                                         2.0%
       2.5%
                                                                                                        1.1%

                                                                                                                            -0.5%
      -2.5%
                 Live music             Event                Artist               Digital                TV                 Advertising
                sponsorship            creation           endorsement                                                        support


                                                                                                                                         Page 8 of 10
Breaking down the six categories, Live Nation and AEG are leading the        Dealing first with the very unsexy topic of transaction processing
way in live sponsorship for both festivals and venues in 2010. As the        and metadata, which is actually the lifeblood of all operational
consumer value of download promotions and pure content platforms             environments, some key points need to be made: in the digital world
decreases, live music platforms are underpinning the approach of many        there is constant change, greater complexity and significantly higher
brands. However, some brands have moved back towards their own               volumes to manage. Business models in the digital world are constantly
event creation, although many of these take the form of limited-scale        changing to meet voracious consumer demand. By contrast, for
events and are often used as content creation forums.                        example, the TV broadcasting model didn’t change from its inception
                                                                             until the advent of cable and satellite services, and even then by very
Artist endorsements saw a significant increase in 2010, growing 13.8          little. The complexity of arrangements amongst all parties involved
percent, the second largest increase behind digital. Much of this increase   in the supply chain are getting ever more detailed as content is sliced
was down to the rise in low- to mid-level artist partnerships, rather        and diced to almost infinite levels of granularity. The only way these
than the large scale international deals, which were more prevalent in       transaction processing demands can be met is through the development
2009. Endorsements led from the US are not counted within this sector;       of cross-industry technical standards, deployed right across the supply
however advertising or digital support that originated in the UK is.         chain to provide an entirely automated global environment.
This sector has seen an evolution in strategy and growing sophistication
in approach. Artist partnerships are now spanning across channels, often     Through standardisation initiatives such as DDEX, the Global Repertoire
centred around a launch event and a stream of digital content. At the        Database and PPL copyright database (with both global initiatives being
same time, labels and management are signing and selling artists to          driven by UK societies), high quality data about musical works and
brands with a growing level of acumen - artists such as Eliza Doolittle or   sound recordings will be available to the entire supply chain, and the
Pixie Lott are being positioned as both performers and brand advocates.      methods of communication of that data along the supply chain will be
                                                                             automated. This will drive down transaction costs in creating, managing
Digital's growth of 16.3 percent is to be expected. Brands in the UK         and communicating the data. Now, lowering transaction costs doesn’t
continue to utilise this as a core communications channel and, with          just cut costs but importantly produces benefits in higher levels of
so much music consumption happening online, it's a natural space for         efficiency that speed up cash flow, lower barriers to entry for new
brands to sit. Brand-funded TV content focused around music continues        legal services and leads to a better allocation of resources - away from
to make up a significant proportion of brand spend, just shy of a quarter     managing data and toward monetising it.
of the total pie. Growth has slowed due to the lack of a new mass-
market vehicle in 2010 (for example X Factor, Britain's Got Talent),         There is an old expression about North Sea oil which is that it takes two
however both Channel 4 (through T4 and 4Music) and ITV (via ITV2 and         barrels of oil to get one barrel out of the pump. Current transaction
3) have continued to attract brands as sponsors of content. Advertising      costs in the digital music supply chain often feel like that too. Instead of
support was the only revenue stream to record a fall in investment in        costing the industry money, metadata should be standardised in such a
2010, but a drop of just 0.5 percent is far less than in wider advertising   way that it enables the industry to deliver greater efficiency gains.
markets.
                                                                             The second recommendation is to ‘get abroad’. The earlier case studies
As with so many other revenue streams covered in this year’s report,         of PRS for Music as well as PPL and MPA illustrate the potential, but
the supply-side takes priority here. The future path of advertising and      do not take account of the changing market. Take the BRIC economies
sponsorship revenues will depend more on the resources thrown at             of Brazil, Russia, India and China, which leading investment banks
it than anything else. Encouragingly, the Music Managers Forum has           estimate will equal the G7 in terms of economic power by 2028, if
already recognised this and is taking a more pro-active role at engaging     not a whole lot sooner. Currently, the performing right collections
UK managers and artists with new and established brands to develop           of these four countries are equal to those of Spain. The risk is that
this sector further.                                                         there are two different trajectories; economic growth and intellectual
                                                                             property growth – with the former significantly outpacing the latter.
Get small, get abroad                                                        Global organisations like WIPO need to rethink IP in this context, and
                                                                             UK music needs to rethink its export strategy, given the geopolitical
It would be foolish to ignore the obvious trend, which is that physical
                                                                             rebalancing taking place within these re-emerging economies.
product took a hammering in 2010 and less money was spent on tickets,
and it would be tough for the B2B sectors to grow enough to off-set this
                                                                             An excellent piece of BPI research underlines the importance of
downturn. UK consumers spent £215m less on music in 2010 than the
                                                                             looking beyond borders. According to the BPI, UK artists’ share of
prior year – a big dent. Therefore, a succinct summary could be that the
                                                                             global sales is estimated to be 11.8 percent in 2010, with one-in-ten
big numbers fell and the small numbers grew.
                                                                             sales in the US being a UK act and up to one-in-five in markets like
                                                                             Germany and Australia. BPI also commissioned Ipsos MORI to put a
It would be equally foolish for one part of the music industry to publish
                                                                             series of statements to the public about the success and importance
a strategy for another to follow to reverse these downward trends. With
                                                                             of British music, with 83 percent of people feeling proud of British
so many complexities and nuances associated with each of the seven
                                                                             music’s achievements. As the excellent BBC documentary Made in
revenues streams, it is best left to the experts within them to work out
                                                                             Britain has shown, the list of goods and services that we truly excel
their own road ahead. However, the report does hang together all the
                                                                             in exporting is becoming increasingly limited and is centred on ideas
different components in such a way that some cross-cutting themes can
                                                                             and intellectual property. Therefore it makes sense to work on re-
be put forward. Two key themes deserve a mention here: ‘get small’ and
                                                                             positioning the UK music industry for the changes taking place in the
reduce the transaction costs of managing metadata, and ‘get abroad’ to
                                                                             global economy, to maximise the potential of its songwriters and
maximise the export opportunity of UK music, given the unprecedented
                                                                             artists in markets that may have been ignored in the past but simply
changes now taking place in the global economy.
                                                                             cannot be overlooked anymore.


                                                                                                                                               Page 9 of 10
BBC Introducing new artists at home and abroad
   Andy Parfitt is Controller of BBC Radio 1, Radio 1Xtra, Asian Network and Popular Music

   On a freezing evening at the end of 2009 I made my                           Why was Florence Welch here sharing the small
   way to The Flowerpot, a classic Kentish Town music                           stage with Out Like a Lion, a West Country indie-pop
   venue. My job that night was to explain to an audience                       outfit playing their first ever gig? As it happened,
   of journalists, politicians and opinion formers what                         Florence was back to say a generous ‘thank you’ for
   BBC Introducing had been doing throughout the year,                          the early support she received from BBC Introducing.
   and why they might be interested.                                            Her presence hopefully encouraged others in pursuit
                                                                                of creative recognition, recording contracts, festival
   Readers of this report will probably already know that                       bookings - on a macro level, those looking ahead at the
   BBC Introducing is a service for unsigned artists, which                     difficult road to economic success for UK music.
   allows them to upload tracks to the BBC so that they
   can be listened to and assessed by a range of producers                      The encouragement and mentoring that presenters
   and presenters, providing them with an instant and                           like Zane Lowe, Tom Robinson or Steve Lamacq give
   steady stream of burgeoning UK talent. Being ‘spotted’                       to these grassroots artists is part of the offer – how
   can result in a BBC session on BBC local radio, Radio 6                      to get a good contract, what the A&R department
   Music, a playlist slot on Radio 1 – even a performance                       might bring and all the other questions relating to
   on a BBC Glastonbury stage. It is a remarkably simple                        the professional world of the industry. The UK has
   but powerful idea that is the modern day equivalent                          an extraordinary and unique young music-making
   of sending a demo cassette to John Peel, or loitering                        culture and the BBC provides resources and powerful
   outside the Radio 6 Music studios ready to thrust a CD                       platforms.
   into a presenter’s hand.
                                                                                As this report states, the UK, in per capita terms,
   The evening at The Flowerpot started with my short                           remains in the top three recorded music markets in
   speech and was followed by live performances from                            the world, towering over the US market. This is an
   some bands that had recently uploaded their tracks                           astounding result from such a small yet hugely artistic
   – also, amazingly, on the bill that night – in this tiny                     nation. In a recent BPI survey, 83% of people are proud
   pub – was Florence and the Machine, one of the few                           of British music’s achievement, a major award in itself
   international breakthrough acts to have made an                              for the UK music industry. Despite the challenges, the
   impact in the US, and contributed significantly to both                       UK is still in a remarkable leadership position in this
   the recorded and live revenues laid out so clearly in                        creative sector.
   this report.


Acknowledgements: This paper would not have been possible without collaboration from analysts and commentators from across the music industry.
Therefore, we would like to thank: Chris Green, Rob Crutchley (BPI), Gabi Lopes, Callum Smith (IFPI), Paul Smernicki (Universal Music Group), Mark
Isherwood (DDEX), Steve Redmond (ERA), Fran Nevrkla, Tony Clark, Jonathan Morrish, Christian Barton (PPL), Greg Parmley (IQ magazine), Steve Machin
(Storm Crowd), Manfred Tari (Pop 100), Will Muirhead, George Prior (Tixdaq), Stephen Navin, Will Lines (MPA), Chris Helm, Hank Forsyth (EMIP), Will
Downs (Sony/ATV), Cliff Dane (Media Research Publishing), Dom Hodge and team (FRUKT), Paul McManus (MIA), Andy Parfitt, Laura Gosling (BBC),
Feargal Sharkey, Adam Webb (UK Music), Pete Downton (39 Ventures), Jonathan Haskell, Peter Goodridge (Imperial College London), Andrew Bud
(mBlox), David Touve (Washington & Lee University), Stewart McKie (Strathclyde Business School), Chris Deering (former president of Sony Europe), Keith
McMahon (STL Partners), Bill Gorjance (peermusic), Juana Espasa Mateos.

Also, Robert Ashcroft, Julia Griffin, William Booth, Benjamin McEwen, Jeremy Fabinyi, Gary Eggleton, Bruce Dickinson, Dave Pincott, Nicholas Brookes, Chris
Haynes, Paul Nichols, Steve Cole, Lisa Eaton, Anita Awbi (PRS for Music).

More Related Content

What's hot

Atlas outlook 2016- Cushman & Wakefied
Atlas outlook 2016- Cushman & WakefiedAtlas outlook 2016- Cushman & Wakefied
Atlas outlook 2016- Cushman & Wakefied
Guy Masse
 
FHO Partners YE 2009 MarketWatch Report
FHO Partners YE 2009 MarketWatch ReportFHO Partners YE 2009 MarketWatch Report
FHO Partners YE 2009 MarketWatch Reportfhopartners
 
gannett 1QPRESEN
gannett 1QPRESENgannett 1QPRESEN
gannett 1QPRESENfinance30
 
Boston_SNH_YearEnd2001
Boston_SNH_YearEnd2001Boston_SNH_YearEnd2001
Boston_SNH_YearEnd2001Bonnie Roberts
 
2014 business briefing_humancapital_final
2014 business briefing_humancapital_final2014 business briefing_humancapital_final
2014 business briefing_humancapital_final
Guy Masse
 
The Weekly Digest Issue #006
The Weekly Digest Issue #006The Weekly Digest Issue #006
The Weekly Digest Issue #006
Tim Musungu
 
FHO Partners 4Q 2010 Market Report
FHO Partners 4Q 2010 Market ReportFHO Partners 4Q 2010 Market Report
FHO Partners 4Q 2010 Market Report
fhopartners
 
Global Insight
Global Insight Global Insight
Global Insight
David Apted
 
North america industrial forecast 2014 2017
North america industrial forecast 2014 2017North america industrial forecast 2014 2017
North america industrial forecast 2014 2017
Guy Masse
 
Emerging markets in asia pacific
Emerging markets in asia pacificEmerging markets in asia pacific
Emerging markets in asia pacificGuy Masse
 
gannett 1Qtranscript2006
gannett 1Qtranscript2006gannett 1Qtranscript2006
gannett 1Qtranscript2006finance30
 
C&W Q3 2021 Canadian Cap Rate Report
 C&W Q3 2021 Canadian  Cap Rate Report  C&W Q3 2021 Canadian  Cap Rate Report
C&W Q3 2021 Canadian Cap Rate Report
Guy Masse
 
C&W MARKETBEAT- CAPITAL MARKETS Q4 2016 – #CRE #REALESTATE #CCIM #SIOR @YOURT...
C&W MARKETBEAT- CAPITAL MARKETS Q4 2016 – #CRE #REALESTATE #CCIM #SIOR @YOURT...C&W MARKETBEAT- CAPITAL MARKETS Q4 2016 – #CRE #REALESTATE #CCIM #SIOR @YOURT...
C&W MARKETBEAT- CAPITAL MARKETS Q4 2016 – #CRE #REALESTATE #CCIM #SIOR @YOURT...
Guy Masse
 
2015 2Q North American Office Market Report
2015 2Q North American Office Market Report2015 2Q North American Office Market Report
2015 2Q North American Office Market Report
Coy Davidson
 
news corp Annual Reports 2007
news corp Annual Reports 2007news corp Annual Reports 2007
news corp Annual Reports 2007finance9
 
news corp Annual Reports 2006
news corp Annual Reports 2006news corp Annual Reports 2006
news corp Annual Reports 2006finance9
 
C&W-Marketbeat-U.S. Industrial-Q3-2018 #CRE #REALESTATE
C&W-Marketbeat-U.S. Industrial-Q3-2018 #CRE #REALESTATEC&W-Marketbeat-U.S. Industrial-Q3-2018 #CRE #REALESTATE
C&W-Marketbeat-U.S. Industrial-Q3-2018 #CRE #REALESTATE
Guy Masse
 
CBC 2014 Blue Book
CBC 2014 Blue BookCBC 2014 Blue Book
CBC 2014 Blue Book
Coldwell Banker Commercial
 

What's hot (19)

Atlas outlook 2016- Cushman & Wakefied
Atlas outlook 2016- Cushman & WakefiedAtlas outlook 2016- Cushman & Wakefied
Atlas outlook 2016- Cushman & Wakefied
 
FHO Partners YE 2009 MarketWatch Report
FHO Partners YE 2009 MarketWatch ReportFHO Partners YE 2009 MarketWatch Report
FHO Partners YE 2009 MarketWatch Report
 
gannett 1QPRESEN
gannett 1QPRESENgannett 1QPRESEN
gannett 1QPRESEN
 
Boston_SNH_YearEnd2001
Boston_SNH_YearEnd2001Boston_SNH_YearEnd2001
Boston_SNH_YearEnd2001
 
2014 business briefing_humancapital_final
2014 business briefing_humancapital_final2014 business briefing_humancapital_final
2014 business briefing_humancapital_final
 
The Weekly Digest Issue #006
The Weekly Digest Issue #006The Weekly Digest Issue #006
The Weekly Digest Issue #006
 
FHO Partners 4Q 2010 Market Report
FHO Partners 4Q 2010 Market ReportFHO Partners 4Q 2010 Market Report
FHO Partners 4Q 2010 Market Report
 
Global Insight
Global Insight Global Insight
Global Insight
 
North america industrial forecast 2014 2017
North america industrial forecast 2014 2017North america industrial forecast 2014 2017
North america industrial forecast 2014 2017
 
Emerging markets in asia pacific
Emerging markets in asia pacificEmerging markets in asia pacific
Emerging markets in asia pacific
 
gannett 1Qtranscript2006
gannett 1Qtranscript2006gannett 1Qtranscript2006
gannett 1Qtranscript2006
 
C&W Q3 2021 Canadian Cap Rate Report
 C&W Q3 2021 Canadian  Cap Rate Report  C&W Q3 2021 Canadian  Cap Rate Report
C&W Q3 2021 Canadian Cap Rate Report
 
C&W MARKETBEAT- CAPITAL MARKETS Q4 2016 – #CRE #REALESTATE #CCIM #SIOR @YOURT...
C&W MARKETBEAT- CAPITAL MARKETS Q4 2016 – #CRE #REALESTATE #CCIM #SIOR @YOURT...C&W MARKETBEAT- CAPITAL MARKETS Q4 2016 – #CRE #REALESTATE #CCIM #SIOR @YOURT...
C&W MARKETBEAT- CAPITAL MARKETS Q4 2016 – #CRE #REALESTATE #CCIM #SIOR @YOURT...
 
contreras-1
contreras-1contreras-1
contreras-1
 
2015 2Q North American Office Market Report
2015 2Q North American Office Market Report2015 2Q North American Office Market Report
2015 2Q North American Office Market Report
 
news corp Annual Reports 2007
news corp Annual Reports 2007news corp Annual Reports 2007
news corp Annual Reports 2007
 
news corp Annual Reports 2006
news corp Annual Reports 2006news corp Annual Reports 2006
news corp Annual Reports 2006
 
C&W-Marketbeat-U.S. Industrial-Q3-2018 #CRE #REALESTATE
C&W-Marketbeat-U.S. Industrial-Q3-2018 #CRE #REALESTATEC&W-Marketbeat-U.S. Industrial-Q3-2018 #CRE #REALESTATE
C&W-Marketbeat-U.S. Industrial-Q3-2018 #CRE #REALESTATE
 
CBC 2014 Blue Book
CBC 2014 Blue BookCBC 2014 Blue Book
CBC 2014 Blue Book
 

Similar to Music and Data: Adding Up the UK Music Industry

The Greatest Hits
The Greatest HitsThe Greatest Hits
The Greatest Hits
tutor2u
 
Marketing analysis report alexander barrett
Marketing analysis report alexander barrettMarketing analysis report alexander barrett
Marketing analysis report alexander barrett
AlexanderBarrett13
 
'Commercial Radio: Growth Ambitions Quashed By Economic Realities' by Grant G...
'Commercial Radio: Growth Ambitions Quashed By Economic Realities' by Grant G...'Commercial Radio: Growth Ambitions Quashed By Economic Realities' by Grant G...
'Commercial Radio: Growth Ambitions Quashed By Economic Realities' by Grant G...
Grant Goddard
 
5114_Sound_Analysis_2013 (Nordicity)
5114_Sound_Analysis_2013 (Nordicity)5114_Sound_Analysis_2013 (Nordicity)
5114_Sound_Analysis_2013 (Nordicity)Stephen Hignell
 
A Creative Block? The Future of the UK Creative Industries
A Creative Block? The Future of the UK Creative IndustriesA Creative Block? The Future of the UK Creative Industries
A Creative Block? The Future of the UK Creative Industries
Think Ethnic
 
UK Music | Wish You Were Here | 2015
UK Music | Wish You Were Here | 2015UK Music | Wish You Were Here | 2015
UK Music | Wish You Were Here | 2015
BTO Educational
 
Creative industries powerpoint
Creative industries powerpointCreative industries powerpoint
Creative industries powerpoint
Nigel G Honey
 
EU: Pianos And Other Keyboard Stringed Musical Instruments - Market Report. A...
EU: Pianos And Other Keyboard Stringed Musical Instruments - Market Report. A...EU: Pianos And Other Keyboard Stringed Musical Instruments - Market Report. A...
EU: Pianos And Other Keyboard Stringed Musical Instruments - Market Report. A...
IndexBox Marketing
 
OTN - Private Sector Trade Note - Vol 1 2013
OTN - Private Sector Trade Note - Vol 1 2013OTN - Private Sector Trade Note - Vol 1 2013
OTN - Private Sector Trade Note - Vol 1 2013
Office of Trade Negotiations (OTN), CARICOM Secretariat
 
Resolution Foundation - Spring Statement Event
Resolution Foundation - Spring Statement EventResolution Foundation - Spring Statement Event
Resolution Foundation - Spring Statement Event
ResolutionFoundation
 
Audio OTT Economy in India at inflection point, says IMI-Deloitte report
Audio OTT Economy in India at inflection point, says IMI-Deloitte reportAudio OTT Economy in India at inflection point, says IMI-Deloitte report
Audio OTT Economy in India at inflection point, says IMI-Deloitte report
Nikita Singhal
 
Audio OTT Economy in India at inflection point, says IMI-Deloitte report
Audio OTT Economy in India at inflection point, says IMI-Deloitte reportAudio OTT Economy in India at inflection point, says IMI-Deloitte report
Audio OTT Economy in India at inflection point, says IMI-Deloitte report
Social Samosa
 
Beyond_the_City_-_Britain's_economic_hotspots_original
Beyond_the_City_-_Britain's_economic_hotspots_originalBeyond_the_City_-_Britain's_economic_hotspots_original
Beyond_the_City_-_Britain's_economic_hotspots_originalSean Liddell
 
U.S. Audio And Video Equipment Market. Analysis And Forecast to 2020
U.S. Audio And Video Equipment Market. Analysis And Forecast to 2020U.S. Audio And Video Equipment Market. Analysis And Forecast to 2020
U.S. Audio And Video Equipment Market. Analysis And Forecast to 2020
IndexBox Marketing
 
CreativeeconomyUk Picnic08
CreativeeconomyUk Picnic08CreativeeconomyUk Picnic08
CreativeeconomyUk Picnic08
LucyHooberman
 
Media: Europe Industry Guide
Media: Europe Industry GuideMedia: Europe Industry Guide
Media: Europe Industry Guide
ReportLinker.com
 
EU: Carboys, Bottles And Similar Articles Of Plastics - Market Report. Analys...
EU: Carboys, Bottles And Similar Articles Of Plastics - Market Report. Analys...EU: Carboys, Bottles And Similar Articles Of Plastics - Market Report. Analys...
EU: Carboys, Bottles And Similar Articles Of Plastics - Market Report. Analys...
IndexBox Marketing
 
EU: Polycarbonates (in Primary Forms) – Market Report. Analysis and Forecast ...
EU: Polycarbonates (in Primary Forms) – Market Report. Analysis and Forecast ...EU: Polycarbonates (in Primary Forms) – Market Report. Analysis and Forecast ...
EU: Polycarbonates (in Primary Forms) – Market Report. Analysis and Forecast ...
IndexBox Marketing
 

Similar to Music and Data: Adding Up the UK Music Industry (20)

The Greatest Hits
The Greatest HitsThe Greatest Hits
The Greatest Hits
 
Marketing analysis report alexander barrett
Marketing analysis report alexander barrettMarketing analysis report alexander barrett
Marketing analysis report alexander barrett
 
'Commercial Radio: Growth Ambitions Quashed By Economic Realities' by Grant G...
'Commercial Radio: Growth Ambitions Quashed By Economic Realities' by Grant G...'Commercial Radio: Growth Ambitions Quashed By Economic Realities' by Grant G...
'Commercial Radio: Growth Ambitions Quashed By Economic Realities' by Grant G...
 
5114_Sound_Analysis_2013 (Nordicity)
5114_Sound_Analysis_2013 (Nordicity)5114_Sound_Analysis_2013 (Nordicity)
5114_Sound_Analysis_2013 (Nordicity)
 
Introduction to Music Industry
Introduction to Music IndustryIntroduction to Music Industry
Introduction to Music Industry
 
A Creative Block? The Future of the UK Creative Industries
A Creative Block? The Future of the UK Creative IndustriesA Creative Block? The Future of the UK Creative Industries
A Creative Block? The Future of the UK Creative Industries
 
UK Music | Wish You Were Here | 2015
UK Music | Wish You Were Here | 2015UK Music | Wish You Were Here | 2015
UK Music | Wish You Were Here | 2015
 
Globalisation
GlobalisationGlobalisation
Globalisation
 
Creative industries powerpoint
Creative industries powerpointCreative industries powerpoint
Creative industries powerpoint
 
EU: Pianos And Other Keyboard Stringed Musical Instruments - Market Report. A...
EU: Pianos And Other Keyboard Stringed Musical Instruments - Market Report. A...EU: Pianos And Other Keyboard Stringed Musical Instruments - Market Report. A...
EU: Pianos And Other Keyboard Stringed Musical Instruments - Market Report. A...
 
OTN - Private Sector Trade Note - Vol 1 2013
OTN - Private Sector Trade Note - Vol 1 2013OTN - Private Sector Trade Note - Vol 1 2013
OTN - Private Sector Trade Note - Vol 1 2013
 
Resolution Foundation - Spring Statement Event
Resolution Foundation - Spring Statement EventResolution Foundation - Spring Statement Event
Resolution Foundation - Spring Statement Event
 
Audio OTT Economy in India at inflection point, says IMI-Deloitte report
Audio OTT Economy in India at inflection point, says IMI-Deloitte reportAudio OTT Economy in India at inflection point, says IMI-Deloitte report
Audio OTT Economy in India at inflection point, says IMI-Deloitte report
 
Audio OTT Economy in India at inflection point, says IMI-Deloitte report
Audio OTT Economy in India at inflection point, says IMI-Deloitte reportAudio OTT Economy in India at inflection point, says IMI-Deloitte report
Audio OTT Economy in India at inflection point, says IMI-Deloitte report
 
Beyond_the_City_-_Britain's_economic_hotspots_original
Beyond_the_City_-_Britain's_economic_hotspots_originalBeyond_the_City_-_Britain's_economic_hotspots_original
Beyond_the_City_-_Britain's_economic_hotspots_original
 
U.S. Audio And Video Equipment Market. Analysis And Forecast to 2020
U.S. Audio And Video Equipment Market. Analysis And Forecast to 2020U.S. Audio And Video Equipment Market. Analysis And Forecast to 2020
U.S. Audio And Video Equipment Market. Analysis And Forecast to 2020
 
CreativeeconomyUk Picnic08
CreativeeconomyUk Picnic08CreativeeconomyUk Picnic08
CreativeeconomyUk Picnic08
 
Media: Europe Industry Guide
Media: Europe Industry GuideMedia: Europe Industry Guide
Media: Europe Industry Guide
 
EU: Carboys, Bottles And Similar Articles Of Plastics - Market Report. Analys...
EU: Carboys, Bottles And Similar Articles Of Plastics - Market Report. Analys...EU: Carboys, Bottles And Similar Articles Of Plastics - Market Report. Analys...
EU: Carboys, Bottles And Similar Articles Of Plastics - Market Report. Analys...
 
EU: Polycarbonates (in Primary Forms) – Market Report. Analysis and Forecast ...
EU: Polycarbonates (in Primary Forms) – Market Report. Analysis and Forecast ...EU: Polycarbonates (in Primary Forms) – Market Report. Analysis and Forecast ...
EU: Polycarbonates (in Primary Forms) – Market Report. Analysis and Forecast ...
 

More from Data Science London

Standardizing +113 million Merchant Names in Financial Services with Greenplu...
Standardizing +113 million Merchant Names in Financial Services with Greenplu...Standardizing +113 million Merchant Names in Financial Services with Greenplu...
Standardizing +113 million Merchant Names in Financial Services with Greenplu...
Data Science London
 
Big Data [sorry] & Data Science: What Does a Data Scientist Do?
Big Data [sorry] & Data Science: What Does a Data Scientist Do?Big Data [sorry] & Data Science: What Does a Data Scientist Do?
Big Data [sorry] & Data Science: What Does a Data Scientist Do?
Data Science London
 
Real-Time Queries in Hadoop w/ Cloudera Impala
Real-Time Queries in Hadoop w/ Cloudera ImpalaReal-Time Queries in Hadoop w/ Cloudera Impala
Real-Time Queries in Hadoop w/ Cloudera Impala
Data Science London
 
Nowcasting Business Performance
Nowcasting Business PerformanceNowcasting Business Performance
Nowcasting Business Performance
Data Science London
 
Numpy, the Python foundation for number crunching
Numpy, the Python foundation for number crunchingNumpy, the Python foundation for number crunching
Numpy, the Python foundation for number crunching
Data Science London
 
Python pandas workshop iPython notebook (163 pages)
Python pandas workshop iPython notebook (163 pages)Python pandas workshop iPython notebook (163 pages)
Python pandas workshop iPython notebook (163 pages)Data Science London
 
Big Practical Recommendations with Alternating Least Squares
Big Practical Recommendations with Alternating Least SquaresBig Practical Recommendations with Alternating Least Squares
Big Practical Recommendations with Alternating Least Squares
Data Science London
 
Bringing back the excitement to data analysis
Bringing back the excitement to data analysisBringing back the excitement to data analysis
Bringing back the excitement to data analysis
Data Science London
 
ACM RecSys 2012: Recommender Systems, Today
ACM RecSys 2012: Recommender Systems, TodayACM RecSys 2012: Recommender Systems, Today
ACM RecSys 2012: Recommender Systems, Today
Data Science London
 
Beyond Accuracy: Goal-Driven Recommender Systems Design
Beyond Accuracy: Goal-Driven Recommender Systems DesignBeyond Accuracy: Goal-Driven Recommender Systems Design
Beyond Accuracy: Goal-Driven Recommender Systems Design
Data Science London
 
Autonomous Discovery: The New Interface?
Autonomous Discovery: The New Interface?Autonomous Discovery: The New Interface?
Autonomous Discovery: The New Interface?
Data Science London
 
Machine Learning and Hadoop: Present and Future
Machine Learning and Hadoop: Present and FutureMachine Learning and Hadoop: Present and Future
Machine Learning and Hadoop: Present and Future
Data Science London
 
Data Science for Live Music
Data Science for Live MusicData Science for Live Music
Data Science for Live Music
Data Science London
 
Research at last.fm
Research at last.fmResearch at last.fm
Research at last.fm
Data Science London
 
Scientific Article Recommendations with Mahout
Scientific Article Recommendations with MahoutScientific Article Recommendations with Mahout
Scientific Article Recommendations with Mahout
Data Science London
 
Super-Fast Clustering Report in MapR
Super-Fast Clustering Report in MapRSuper-Fast Clustering Report in MapR
Super-Fast Clustering Report in MapR
Data Science London
 
Simple Matrix Factorization for Recommendation in Mahout
Simple Matrix Factorization for Recommendation in MahoutSimple Matrix Factorization for Recommendation in Mahout
Simple Matrix Factorization for Recommendation in Mahout
Data Science London
 
Going Real-Time with Mahout, Predicting gender of Facebook Users
Going Real-Time with Mahout, Predicting gender of Facebook UsersGoing Real-Time with Mahout, Predicting gender of Facebook Users
Going Real-Time with Mahout, Predicting gender of Facebook Users
Data Science London
 
Practical Magic with Incanter
Practical Magic with IncanterPractical Magic with Incanter
Practical Magic with Incanter
Data Science London
 

More from Data Science London (20)

Standardizing +113 million Merchant Names in Financial Services with Greenplu...
Standardizing +113 million Merchant Names in Financial Services with Greenplu...Standardizing +113 million Merchant Names in Financial Services with Greenplu...
Standardizing +113 million Merchant Names in Financial Services with Greenplu...
 
Big Data [sorry] & Data Science: What Does a Data Scientist Do?
Big Data [sorry] & Data Science: What Does a Data Scientist Do?Big Data [sorry] & Data Science: What Does a Data Scientist Do?
Big Data [sorry] & Data Science: What Does a Data Scientist Do?
 
Real-Time Queries in Hadoop w/ Cloudera Impala
Real-Time Queries in Hadoop w/ Cloudera ImpalaReal-Time Queries in Hadoop w/ Cloudera Impala
Real-Time Queries in Hadoop w/ Cloudera Impala
 
Nowcasting Business Performance
Nowcasting Business PerformanceNowcasting Business Performance
Nowcasting Business Performance
 
Numpy, the Python foundation for number crunching
Numpy, the Python foundation for number crunchingNumpy, the Python foundation for number crunching
Numpy, the Python foundation for number crunching
 
Python pandas workshop iPython notebook (163 pages)
Python pandas workshop iPython notebook (163 pages)Python pandas workshop iPython notebook (163 pages)
Python pandas workshop iPython notebook (163 pages)
 
Big Practical Recommendations with Alternating Least Squares
Big Practical Recommendations with Alternating Least SquaresBig Practical Recommendations with Alternating Least Squares
Big Practical Recommendations with Alternating Least Squares
 
Bringing back the excitement to data analysis
Bringing back the excitement to data analysisBringing back the excitement to data analysis
Bringing back the excitement to data analysis
 
Survival Analysis of Web Users
Survival Analysis of Web UsersSurvival Analysis of Web Users
Survival Analysis of Web Users
 
ACM RecSys 2012: Recommender Systems, Today
ACM RecSys 2012: Recommender Systems, TodayACM RecSys 2012: Recommender Systems, Today
ACM RecSys 2012: Recommender Systems, Today
 
Beyond Accuracy: Goal-Driven Recommender Systems Design
Beyond Accuracy: Goal-Driven Recommender Systems DesignBeyond Accuracy: Goal-Driven Recommender Systems Design
Beyond Accuracy: Goal-Driven Recommender Systems Design
 
Autonomous Discovery: The New Interface?
Autonomous Discovery: The New Interface?Autonomous Discovery: The New Interface?
Autonomous Discovery: The New Interface?
 
Machine Learning and Hadoop: Present and Future
Machine Learning and Hadoop: Present and FutureMachine Learning and Hadoop: Present and Future
Machine Learning and Hadoop: Present and Future
 
Data Science for Live Music
Data Science for Live MusicData Science for Live Music
Data Science for Live Music
 
Research at last.fm
Research at last.fmResearch at last.fm
Research at last.fm
 
Scientific Article Recommendations with Mahout
Scientific Article Recommendations with MahoutScientific Article Recommendations with Mahout
Scientific Article Recommendations with Mahout
 
Super-Fast Clustering Report in MapR
Super-Fast Clustering Report in MapRSuper-Fast Clustering Report in MapR
Super-Fast Clustering Report in MapR
 
Simple Matrix Factorization for Recommendation in Mahout
Simple Matrix Factorization for Recommendation in MahoutSimple Matrix Factorization for Recommendation in Mahout
Simple Matrix Factorization for Recommendation in Mahout
 
Going Real-Time with Mahout, Predicting gender of Facebook Users
Going Real-Time with Mahout, Predicting gender of Facebook UsersGoing Real-Time with Mahout, Predicting gender of Facebook Users
Going Real-Time with Mahout, Predicting gender of Facebook Users
 
Practical Magic with Incanter
Practical Magic with IncanterPractical Magic with Incanter
Practical Magic with Incanter
 

Recently uploaded

Leading Change strategies and insights for effective change management pdf 1.pdf
Leading Change strategies and insights for effective change management pdf 1.pdfLeading Change strategies and insights for effective change management pdf 1.pdf
Leading Change strategies and insights for effective change management pdf 1.pdf
OnBoard
 
A tale of scale & speed: How the US Navy is enabling software delivery from l...
A tale of scale & speed: How the US Navy is enabling software delivery from l...A tale of scale & speed: How the US Navy is enabling software delivery from l...
A tale of scale & speed: How the US Navy is enabling software delivery from l...
sonjaschweigert1
 
FIDO Alliance Osaka Seminar: Passkeys and the Road Ahead.pdf
FIDO Alliance Osaka Seminar: Passkeys and the Road Ahead.pdfFIDO Alliance Osaka Seminar: Passkeys and the Road Ahead.pdf
FIDO Alliance Osaka Seminar: Passkeys and the Road Ahead.pdf
FIDO Alliance
 
Free Complete Python - A step towards Data Science
Free Complete Python - A step towards Data ScienceFree Complete Python - A step towards Data Science
Free Complete Python - A step towards Data Science
RinaMondal9
 
Essentials of Automations: Optimizing FME Workflows with Parameters
Essentials of Automations: Optimizing FME Workflows with ParametersEssentials of Automations: Optimizing FME Workflows with Parameters
Essentials of Automations: Optimizing FME Workflows with Parameters
Safe Software
 
Key Trends Shaping the Future of Infrastructure.pdf
Key Trends Shaping the Future of Infrastructure.pdfKey Trends Shaping the Future of Infrastructure.pdf
Key Trends Shaping the Future of Infrastructure.pdf
Cheryl Hung
 
Builder.ai Founder Sachin Dev Duggal's Strategic Approach to Create an Innova...
Builder.ai Founder Sachin Dev Duggal's Strategic Approach to Create an Innova...Builder.ai Founder Sachin Dev Duggal's Strategic Approach to Create an Innova...
Builder.ai Founder Sachin Dev Duggal's Strategic Approach to Create an Innova...
Ramesh Iyer
 
Assuring Contact Center Experiences for Your Customers With ThousandEyes
Assuring Contact Center Experiences for Your Customers With ThousandEyesAssuring Contact Center Experiences for Your Customers With ThousandEyes
Assuring Contact Center Experiences for Your Customers With ThousandEyes
ThousandEyes
 
Securing your Kubernetes cluster_ a step-by-step guide to success !
Securing your Kubernetes cluster_ a step-by-step guide to success !Securing your Kubernetes cluster_ a step-by-step guide to success !
Securing your Kubernetes cluster_ a step-by-step guide to success !
KatiaHIMEUR1
 
FIDO Alliance Osaka Seminar: Overview.pdf
FIDO Alliance Osaka Seminar: Overview.pdfFIDO Alliance Osaka Seminar: Overview.pdf
FIDO Alliance Osaka Seminar: Overview.pdf
FIDO Alliance
 
GDG Cloud Southlake #33: Boule & Rebala: Effective AppSec in SDLC using Deplo...
GDG Cloud Southlake #33: Boule & Rebala: Effective AppSec in SDLC using Deplo...GDG Cloud Southlake #33: Boule & Rebala: Effective AppSec in SDLC using Deplo...
GDG Cloud Southlake #33: Boule & Rebala: Effective AppSec in SDLC using Deplo...
James Anderson
 
By Design, not by Accident - Agile Venture Bolzano 2024
By Design, not by Accident - Agile Venture Bolzano 2024By Design, not by Accident - Agile Venture Bolzano 2024
By Design, not by Accident - Agile Venture Bolzano 2024
Pierluigi Pugliese
 
When stars align: studies in data quality, knowledge graphs, and machine lear...
When stars align: studies in data quality, knowledge graphs, and machine lear...When stars align: studies in data quality, knowledge graphs, and machine lear...
When stars align: studies in data quality, knowledge graphs, and machine lear...
Elena Simperl
 
Monitoring Java Application Security with JDK Tools and JFR Events
Monitoring Java Application Security with JDK Tools and JFR EventsMonitoring Java Application Security with JDK Tools and JFR Events
Monitoring Java Application Security with JDK Tools and JFR Events
Ana-Maria Mihalceanu
 
Generative AI Deep Dive: Advancing from Proof of Concept to Production
Generative AI Deep Dive: Advancing from Proof of Concept to ProductionGenerative AI Deep Dive: Advancing from Proof of Concept to Production
Generative AI Deep Dive: Advancing from Proof of Concept to Production
Aggregage
 
Elevating Tactical DDD Patterns Through Object Calisthenics
Elevating Tactical DDD Patterns Through Object CalisthenicsElevating Tactical DDD Patterns Through Object Calisthenics
Elevating Tactical DDD Patterns Through Object Calisthenics
Dorra BARTAGUIZ
 
State of ICS and IoT Cyber Threat Landscape Report 2024 preview
State of ICS and IoT Cyber Threat Landscape Report 2024 previewState of ICS and IoT Cyber Threat Landscape Report 2024 preview
State of ICS and IoT Cyber Threat Landscape Report 2024 preview
Prayukth K V
 
PHP Frameworks: I want to break free (IPC Berlin 2024)
PHP Frameworks: I want to break free (IPC Berlin 2024)PHP Frameworks: I want to break free (IPC Berlin 2024)
PHP Frameworks: I want to break free (IPC Berlin 2024)
Ralf Eggert
 
Accelerate your Kubernetes clusters with Varnish Caching
Accelerate your Kubernetes clusters with Varnish CachingAccelerate your Kubernetes clusters with Varnish Caching
Accelerate your Kubernetes clusters with Varnish Caching
Thijs Feryn
 
Elizabeth Buie - Older adults: Are we really designing for our future selves?
Elizabeth Buie - Older adults: Are we really designing for our future selves?Elizabeth Buie - Older adults: Are we really designing for our future selves?
Elizabeth Buie - Older adults: Are we really designing for our future selves?
Nexer Digital
 

Recently uploaded (20)

Leading Change strategies and insights for effective change management pdf 1.pdf
Leading Change strategies and insights for effective change management pdf 1.pdfLeading Change strategies and insights for effective change management pdf 1.pdf
Leading Change strategies and insights for effective change management pdf 1.pdf
 
A tale of scale & speed: How the US Navy is enabling software delivery from l...
A tale of scale & speed: How the US Navy is enabling software delivery from l...A tale of scale & speed: How the US Navy is enabling software delivery from l...
A tale of scale & speed: How the US Navy is enabling software delivery from l...
 
FIDO Alliance Osaka Seminar: Passkeys and the Road Ahead.pdf
FIDO Alliance Osaka Seminar: Passkeys and the Road Ahead.pdfFIDO Alliance Osaka Seminar: Passkeys and the Road Ahead.pdf
FIDO Alliance Osaka Seminar: Passkeys and the Road Ahead.pdf
 
Free Complete Python - A step towards Data Science
Free Complete Python - A step towards Data ScienceFree Complete Python - A step towards Data Science
Free Complete Python - A step towards Data Science
 
Essentials of Automations: Optimizing FME Workflows with Parameters
Essentials of Automations: Optimizing FME Workflows with ParametersEssentials of Automations: Optimizing FME Workflows with Parameters
Essentials of Automations: Optimizing FME Workflows with Parameters
 
Key Trends Shaping the Future of Infrastructure.pdf
Key Trends Shaping the Future of Infrastructure.pdfKey Trends Shaping the Future of Infrastructure.pdf
Key Trends Shaping the Future of Infrastructure.pdf
 
Builder.ai Founder Sachin Dev Duggal's Strategic Approach to Create an Innova...
Builder.ai Founder Sachin Dev Duggal's Strategic Approach to Create an Innova...Builder.ai Founder Sachin Dev Duggal's Strategic Approach to Create an Innova...
Builder.ai Founder Sachin Dev Duggal's Strategic Approach to Create an Innova...
 
Assuring Contact Center Experiences for Your Customers With ThousandEyes
Assuring Contact Center Experiences for Your Customers With ThousandEyesAssuring Contact Center Experiences for Your Customers With ThousandEyes
Assuring Contact Center Experiences for Your Customers With ThousandEyes
 
Securing your Kubernetes cluster_ a step-by-step guide to success !
Securing your Kubernetes cluster_ a step-by-step guide to success !Securing your Kubernetes cluster_ a step-by-step guide to success !
Securing your Kubernetes cluster_ a step-by-step guide to success !
 
FIDO Alliance Osaka Seminar: Overview.pdf
FIDO Alliance Osaka Seminar: Overview.pdfFIDO Alliance Osaka Seminar: Overview.pdf
FIDO Alliance Osaka Seminar: Overview.pdf
 
GDG Cloud Southlake #33: Boule & Rebala: Effective AppSec in SDLC using Deplo...
GDG Cloud Southlake #33: Boule & Rebala: Effective AppSec in SDLC using Deplo...GDG Cloud Southlake #33: Boule & Rebala: Effective AppSec in SDLC using Deplo...
GDG Cloud Southlake #33: Boule & Rebala: Effective AppSec in SDLC using Deplo...
 
By Design, not by Accident - Agile Venture Bolzano 2024
By Design, not by Accident - Agile Venture Bolzano 2024By Design, not by Accident - Agile Venture Bolzano 2024
By Design, not by Accident - Agile Venture Bolzano 2024
 
When stars align: studies in data quality, knowledge graphs, and machine lear...
When stars align: studies in data quality, knowledge graphs, and machine lear...When stars align: studies in data quality, knowledge graphs, and machine lear...
When stars align: studies in data quality, knowledge graphs, and machine lear...
 
Monitoring Java Application Security with JDK Tools and JFR Events
Monitoring Java Application Security with JDK Tools and JFR EventsMonitoring Java Application Security with JDK Tools and JFR Events
Monitoring Java Application Security with JDK Tools and JFR Events
 
Generative AI Deep Dive: Advancing from Proof of Concept to Production
Generative AI Deep Dive: Advancing from Proof of Concept to ProductionGenerative AI Deep Dive: Advancing from Proof of Concept to Production
Generative AI Deep Dive: Advancing from Proof of Concept to Production
 
Elevating Tactical DDD Patterns Through Object Calisthenics
Elevating Tactical DDD Patterns Through Object CalisthenicsElevating Tactical DDD Patterns Through Object Calisthenics
Elevating Tactical DDD Patterns Through Object Calisthenics
 
State of ICS and IoT Cyber Threat Landscape Report 2024 preview
State of ICS and IoT Cyber Threat Landscape Report 2024 previewState of ICS and IoT Cyber Threat Landscape Report 2024 preview
State of ICS and IoT Cyber Threat Landscape Report 2024 preview
 
PHP Frameworks: I want to break free (IPC Berlin 2024)
PHP Frameworks: I want to break free (IPC Berlin 2024)PHP Frameworks: I want to break free (IPC Berlin 2024)
PHP Frameworks: I want to break free (IPC Berlin 2024)
 
Accelerate your Kubernetes clusters with Varnish Caching
Accelerate your Kubernetes clusters with Varnish CachingAccelerate your Kubernetes clusters with Varnish Caching
Accelerate your Kubernetes clusters with Varnish Caching
 
Elizabeth Buie - Older adults: Are we really designing for our future selves?
Elizabeth Buie - Older adults: Are we really designing for our future selves?Elizabeth Buie - Older adults: Are we really designing for our future selves?
Elizabeth Buie - Older adults: Are we really designing for our future selves?
 

Music and Data: Adding Up the UK Music Industry

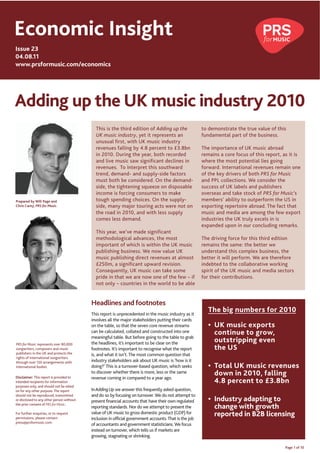
  • 1. Economic Insight Issue 23 04.08.11 www.prsformusic.com/economics Adding up the UK music industry 2010 This is the third edition of Adding up the to demonstrate the true value of this UK music industry, yet it represents an fundamental part of the business. unusual first, with UK music industry revenues falling by 4.8 percent to £3.8bn The importance of UK music abroad in 2010. During the year, both recorded remains a core focus of this report, as it is and live music saw significant declines in where the most potential lies going revenues. To interpret this southward forward. International revenues remain one trend, demand- and supply-side factors of the key drivers of both PRS for Music must both be considered. On the demand- and PPL collections. We consider the side, the tightening squeeze on disposable success of UK labels and publishers income is forcing consumers to make overseas and take stock of PRS for Music’s Prepared by Will Page and tough spending choices. On the supply- members’ ability to outperform the US in Chris Carey, PRS for Music. side, many major touring acts were not on exporting repertoire abroad. The fact that the road in 2010, and with less supply music and media are among the few export comes less demand. industries the UK truly excels in is expanded upon in our concluding remarks. This year, we’ve made significant methodological advances, the most The driving force for this third edition important of which is within the UK music remains the same: the better we publishing business. We now value UK understand this complex business, the music publishing direct revenues at almost better it will perform. We are therefore £250m, a significant upward revision. indebted to the collaborative working Consequently, UK music can take some spirit of the UK music and media sectors pride in that we are now one of the few – if for their contributions. not only – countries in the world to be able Headlines and footnotes This report is unprecedented in the music industry as it The big numbers for 2010 involves all the major stakeholders putting their cards on the table, so that the seven core revenue streams UK music exports can be calculated, collated and constructed into one continue to grow, meaningful table. But before going to the table to grab PRS for Music represents over 80,000 the headlines, it’s important to be clear on the outstripping even songwriters, composers and music footnotes. It’s important to recognise what the report the US publishers in the UK and protects the is, and what it isn’t. The most common question that rights of international songwriters through over 150 arrangements with industry stakeholders ask about UK music is ‘how is it international bodies. doing?’ This is a turnover-based question, which seeks Total UK music revenues to discover whether there is more, less or the same down in 2010, falling Disclaimer: This report is provided to revenue coming in compared to a year ago. intended recipients for information 4.8 percent to £3.8bn purposes only, and should not be relied on for any other purpose. The report In Adding Up we answer this frequently asked question, should not be reproduced, transmitted and do so by focusing on turnover. We do not attempt to or disclosed to any other person without present financial accounts that have their own regulated Industry adapting to the prior consent of PRS for Music. reporting standards. Nor do we attempt to present the change with growth For further enquiries, or to request value of UK music to gross domestic product (GDP) for reported in B2B licensing permissions, please contact inclusion in official government accounts. That is the job press@prsformusic.com of accountants and government statisticians. We focus instead on turnover, which tells us if markets are growing, stagnating or shrinking. Page 1 of 10
  • 2. Reading beneath the top line As with last year’s report, three questions will punctuate each of the included. Consequently, we do not pick up the revenues of UK artists revenue lines. like Coldplay when they tour France, for example. For business-to- business (B2B) revenues, we capture flows into the UK from affiliates How do we accurately define 2010? (e.g. GEMA in Germany) and net-off money that the UK sends overseas What exactly is the UK music industry and where do we draw the line? to affiliate organisations (e.g. ASCAP in the US). Importantly, this new exports-minus-imports adjustment better enables us to add the Are the terms B2B and B2C still the right way to carve up revenues? contribution of the UK collecting societies into GDP, and allows other countries to replicate this methodology without double counting. Firstly, we take an activity approach to the calendar year. If tickets were purchased for a festival a year in advance, which is often the case, we Thirdly, we maintain a view that the best way to add up the industry is re-scale the data to ensure that the revenue numbers are reflective of the to separate out the revenues into B2C and B2B. The increasing activity that took place within that calendar year. We also re-work previous diversification of revenue streams helps illustrate why. Record labels, years' analysis to ensure that the critically important year-on-year trend is for example, are moving towards an impressive one-in-three rule where consistent and meaningful to the reader. one third of trade revenues come from outside the physical product market. In addition to this, there is a growing B2B revenue stream from Secondly, and perhaps most puzzlingly, how do you define the UK? In the licensing activity. context of business-to-consumer (B2C) revenues, if the US band Bon Jovi sell out the O2 Arena to tourists who have flown in from South East Asia, With this clarity on caveats, we can now go back to the headlines and work then is that actually UK revenue? We are asking what activity took place in through the big numbers in this year’s table, before distilling each sector the UK, and what revenues it produced; therefore this revenue would be down individually. Adding up the UK music industry £m 2009 2010 Change BPI retail value of recorded music £1,343 £1,237 -7.9% Estimated value of live music £1,589 £1,480 -6.8% PRS for Music gross collections £431 £425 -1.3% Adjustment for mechanical revenue (£89) (£81) Adjustment for live revenue (£23) (£20) Adjustment for international payments (£80) (£85) PPL and VPL gross collections £66 £79 18.9% Adjustment for recorded B2B revenue (£72) (£72) Adjustment for international payments (£2.7) (£3.0) Estimated record company B2B revenue £204 £218 7.2% Publisher direct revenue (excluding PRS for Music) £241 £242 0.6% Advertising and sponsorship revenue £90 £94 4.2% Business-to-consumer total £2,932 £2,717 -7.3% Business-to-business total £1,032 £1,058 2.6% Total B2B and B2C value £3,964 £3,775 -4.8% Are recorded music revenues back on a slippery slope? While 2009 was the year when UK retail spend stabilised (and trade the main international recorded music industry markets, with the IFPI revenues actually grew), there is an eerily familiar slippery slope feel to the reporting global digital trade value up only 5.3 percent to $4.6bn in 2010. 2010 figures, with the second largest percentage fall in trade revenues since Put more bluntly, global digital revenues are not going to be the ‘$30 records began . While steep falls in physical revenues continued apace in billion dollar baby’ people talked about five years ago. Indeed they may 2010, there were clear signs that growth in digital revenues slowed across stabilise at around $5bn over the medium term. Page 2 of 10
  • 3. A global perspective The IFPI Recording Industry in Numbers 2011 publication reported an Before considering the prospects for 2011, it is well worth taking time eight percent fall in revenues in 2010, driven by a 14 percent drop in to ask a question that is incredibly complicated to answer: what is the physical off-setting the five percent gains in both digital and value of digital in the UK, and to whom? In this instance, we will performance right revenue. Reading beneath the top line, the top two answer on behalf of music rightsholders. markets (US and Japan) were responsible for 50 percent of the decline in 2010, compared with 80 percent in 2009. Compounding the overall Firstly, the OCC and BPI estimate the retail value of digital at an declines were the UK and Australia, both of which had stabilised back in impressive £316.5m in 2010, up 18 percent on the previous year. By 2009, before reporting large falls in 2010. Outside of the large definition, retail is a B2C value as it captures consumer spend. We can established markets, South Korea, India and many Latin American strip off a notional £47m in VAT using a rate of 17.5 percent (it will be markets reported growth, with Brazil overtaking Spain to claim tenth lower for many of the transactions which took place) and from the spot in the IFPI rankings. Indeed, the market in Spain (a western net amount remove the trade value of £215m to show an effective European market with 46m people and an advantageous language) is retailer margin. Using these published retail and trade values, VAT now so depressed that 3,000 album sales will often get an artist to works out as £47m, leaving retailers with a margin of £56m. Of number one. Should declines continue at their current pace, it is course, with a lower VAT rate, retailer margin will widen further. conceivable that Spain could drop out of the top twenty within three years, possibly being overtaken by countries such as India and South However, the value of digital music to rightsholders also includes Africa – which is a timely reminder of the increasing relevance of these two other revenues. Firstly, there are B2B record label licensing re-emerging markets. revenues from models such as ad-supported services. Secondly, the authors’ value of digital rights in the UK, which is not captured in Back to Blighty the trade value as the rights are licensed directly by collecting societies such as PRS for Music and SACEM and agencies such as Although the southward trend in the UK market has re-emerged, CELAS. In the table below, we accommodate this by adding £12.5m there is some good news that needs to be kept in mind. UK music in ad-supported revenues for the labels and £34.2m in songwriter continues to remain relatively and comparatively strong. In per capita copyright1. Consequently, a more specific question is ‘how much is terms, the UK remains one of the top three recorded music markets in digital music worth in the UK to rightsholders in 2010?’ The answer the world, towering above the US market, and remains number one in is an impressive £260m. terms of European digital revenues, with Norway a close second. In addition, when artists break big in the UK, their hits sell volumes rarely seen anywhere else. The US act Kings of Leon’s Only by the Value of digital music in the UK to music rightsholders 2010 Night sold more in the UK (2.6m) than the USA, and is one of five artist albums to have sold more than two million copies in the UK in £m recent times – alongside Lady Gaga, Take That, Adele and the late Amy Winehouse – a respectable watermark by any standard. Retail value of digital music £316.5 Less: VAT @17.5% (£47.1) Delving into the statistics, three observations help to form a view of what happened last year. Firstly, the aggregate trade value of physical Retail value less VAT £269.4 albums has near enough halved in five years, and now appears to have Less: retailers' margin (£56.0) entered into an accelerating rate of decline. Consequently, the make- up of the recording industry trade revenues is changing faster than Trade value of digital music to labels £213.3 anyone could have predicted; in 2009 £1 in every £5 came from Add in: labels B2B revenues £12.5 outside physical revenues, half way through 2011 and it’s now looking close to £1 in every £3. Add in: authors' digital collections £34.2 Secondly, the spiky nature of demand re-emphasises how critical the Uk digital value of music rights £260.0 fourth quarter is to the overall picture, generating 40 percent of total 1 The value of songwriter copyright online in the UK was calculated through three steps. Firstly, we took trade value for the year, with physical product still making up three- the value of PRS for Music online licensing for UK markets. Secondly, we estimated the value of UK online quarters of that demand. Fourth quarter 2010 was a particular songwriter copyright which was paid through to other licensing organisations such as CELAS and SACEM for transactional UK activity. Thirdly, we scaled UK revenues to reflect non-transactional blanket deals disappointment: the value of sales fell by 16 percent in the final three that took place in the 2010 calendar year. months of the year, accounting for 60 percent of annual losses. The notable explanations for the disappointing fourth quarter included the Looking ahead to 2011, the success of Adele is as welcome as it exceptionally bad weather (which affected distribution as well as is worrying, as this 23-year-old artist was responsible for almost consumption), competition from other media goods such as computer 10 percent of all artist albums sold in the first four months of the games, ongoing pressure on retail space and the persistent presence year. While her feats at home and abroad are worth celebrating, of unlicensed digital content on ISP networks. what’s worrying is the performance of the rest of the market, with continued declines in physical value and modest digital growth. Thirdly, there are two supply-side developments worth noting: the Significant supply-side adjustments are taking place too, with release schedule may have lacked the strength of the previous year, with retailers and wholesalers seeking new ways to balance risk in the half of the top ten selling albums in 2010 being either 2009 releases supply chain. All of this needs to be set against the state of the (Lady Gaga, Michael Buble and Paolo Nutini) or compilations (Now That’s economy, and the squeeze on consumers’ wallets with spending What I Call Music 76 and 77). Also, new BPI research on breakthrough acts cuts, tax creep and oil prices already compounding an inflationary – bands that pass 100,000 album sales for the first time – show that problem which is eroding earnings and savings. All these factors are 2010 hit a new low, with only 17 UK acts making it past this watermark, likely to force the consumer into some tough choices about their compared to a broadly consistent 25 in recent years. entertainment budget (see box overleaf). Page 3 of 10
  • 4. Events up, recordings down The chart below expands upon a recently published paper titled office spend broadly constant, which means absolute value growth Wallet Share by breaking down the respective shares of total as total consumer expenditure grew throughout this period. The light consumer UK expenditure on live and recorded music from 1997 to red line shows recorded music’s wallet share declining from 2001, 2010. In addition, the shares of box office, video retail and rental while the light blue line shows DVD retail-and-rental wallet share spend are also plotted. A working hypothesis by economists at PRS following a similar path from 2004. Here, it’s worth pointing out one for Music is that people are spending more of their money on events blatantly obvious point: both cinema and concerts involve some form and less of their money on recordings of events. Put simply, they go of excludability – security guards – which means you have to pay to to gigs and the cinema more but buy CDs and DVDs less. The dark get in. Since broadband hit critical mass in the UK in 2001, this has not red and dark blue lines show live music growing consistently and box been the case for media files on networks. Wallet share of events versus recordings Source: BPI, BVA, Screen Digest, ONS and PRS for Music DVD retail and rental 0.40% Recorded music's wallet share starts wallet share starts declining in 2004 declining in 2001 0.30% 0.20% 0.10% Recorded music spend as a share of total consumer expenditure Live music spend as a share of total consumer expenditure DVD retail and rental spend as a share of total consumer expenditure 0.00% Box office spend as a share of total consumer expenditure 1997 1998 1999 2000 2001 2002 2003 2004 2005 2006 2007 2008 2009 2010 (Est.) Live music: where supply dictates demand Live music finds itself in unfamiliar territory in this year’s report, having From statistics to the reality of bands on the road, this supply-side experienced a fall in primary ticket revenue for the first time in recent story is born out in the acts that performed last year. In 2010, a number history. Primary ticket sales fell from £956.9m in 2009 to £843.5m in of stadium- and arena-filling bands were not on tour (Rolling Stones, 2010, a fall of 11.8 percent. The secondary market (those tickets traded Coldplay, Take That) and many of those that did tour opted to play on resale sites, such as GetMeIn, Seatwave and Viagogo) grew by £21m, smaller venues in order to limit their risk (Kings of Leon and Rod Stewart with arenas accounting for the greatest volume of tickets traded. At-the- played arenas rather than stadiums). This risk-averse behaviour is rational event spend (often referred to as ancillary revenues), which had grown in the current economic climate. Last year, we championed the success of nearly 60 percent over the previous five years, also faltered in 2010, music against the rest of the economy, whereas this year it feels as though falling 3.5% to £444m (from a revised £460m) as a result of fewer people the economic downturn has caught up with the live music industry, and going to live events. However, when people did go out, they spent similar promoters and bands alike have responded accordingly. amounts to the previous year. Consequently, total live revenues fell from £1.59bn to £1.48bn, down 6.8 percent. To gauge the performance of festivals and arenas, it’s worth looking at the UK market against the backdrop of Europe, as the two are intrinsically It would be very tempting to look at these numbers and jump towards a knee linked. Arena tours are rarely confined to the UK only, and many UK festival jerk reaction that the live music bubble has burst. We should not. Instead, promoters are now developing events overseas, such as Benicassim in Spain, we should develop a broader understanding of the dynamics at play in the and are deliberately marketing them to the UK audience. The UK festival market. While UK festivals performed strongly, and arenas and mid-sized market saw its primary ticket revenue increase by nearly 20 percent. This venues held up, there was a striking decline in the number of stadium gigs in growth was the result of both the increasing capacity of existing festivals and 2010 compared to the previous year. It was this reduction in supply of stadium the increasing number of festivals, up 16 percent on the previous year. concerts that accounted for almost two-thirds of the fall in revenue. Page 4 of 10
  • 5. A similar growth story can be observed across Europe, with a in their 40s. Only six percent of the top 20 were in their 30s, with no-one comprehensive IQ Magazine survey finding that capacity of European in their 20s appearing. The question is this: against the backdrop of falling festivals was up 15 percent and attendances grew by six percent, with sell- record sales, who is putting the time, money and expertise into developing outs increasing by 10 percent - a ‘build and they will come’ success story. the arena, festival and stadium acts of the future? A side issue that is clouding this growth story and increasingly gathering the attention of managers is the calendar period in which festivals take Collecting societies: growing musical exports, importing collections place, which has stretched from July to August to a much broader May to The two UK music collecting societies presented a contrasting picture for October. There is a plausible argument that this is now crowding out the 2010. PRS for Music collections fell for the first time in recent memory but conventional touring calendar for emerging bands, with some fans saying: distributions were almost flat – indicating productivity gains. PPL, on the ‘Why would I pay £30 to see you in spring, when I’ve already spent £200 to other hand, reported an increase in collections, but the growth in distribution see you in the summer?’ was distorted by a one-off charge resulting from a tribunal decision. It is worth remarking upon the relative stability shown by both societies over the past The UK arena market offers a less rosy picture, with PRS for Music few years in the face of the deepest recession in a generation. This is a useful revenues from arenas falling two percent in 2010. The National Arenas indicator of the merits of collecting societies in providing a stable source of Association’s (NAA) report also showed that, while music continued to revenue for artists, songwriters, labels and publishers. make up 60 percent of arenas’ footfall, music attendances were down 20 percent on 2009, as the volume of shows dropped sharply. Again, Firstly, we should explain an important adjustment to these numbers. the supply-side story can be drawn upon here by pointing out that For both societies, we add international collections, as done in previous performances were down six percent. The most striking observation of the reports, but now net-off the money sent to overseas affiliates. So, PRS NAA report was the dominance of the X Factor tour, which had 478,000 for Music brought in an impressive £170m in international revenues from attendees – reiterating the importance of hits in a market awash with around the world, but sent out £85m to affiliates such as ASCAP and BMI. choice. The European arenas market showed similar trends, with IQ’s In this year’s report, we adjust for double counting and include the net survey reporting attendances for music events at arenas falling 16 percent amount of £85m. Similarly for PPL, we add in the £32m of international on the year while ticket prices grew by two percent. revenues which feature in their gross collections, but net off £3m PPL sent out to overseas affiliates, and therefore report the net amount of £29m. Looking ahead to 2011, most market players and observers are confident that headline revenues will bounce back, due at least in part to the supply In 2010, PPL collections grew by 10.7 percent to £143.5m, making it one of big bands on tour in the UK. Rihanna, Westlife and Justin Bieber are all of the world’s largest performance rights societies. Its total distributable noteworthy additions to the 2011 arenas calendar. The impact of Take That revenue was up 33.6 percent to £124.1m, but the sharp rise was due to the touring the UK was visible in the 2009 revenues, and noteworthy by their fact that 2009’s total had been hit by the UK Copyright Tribunal’s decision absence in 2010. They are back on the road in 2011, playing to 1.7m people. affecting licence fees payments between 2006 and 2009. While we are not saying that one band makes a market, a tour of this scale really is a ‘needle mover’. Growth was reported across all three PPL revenue streams of public performance, broadcast and international, with the last of these Our view is that the live music business is not entering a cycle of boom and producing the most notable headlines, up 49 percent to £31.7m in 2010. bust, but rather showing signs of maturity and cooling to a more sustainable This is a continuation of the £92m success story that resulted from the 52 growth path, after a period of unprecedented growth. What this analysis international reciprocal contracts PPL has established in 28 countries in does tell us is twofold. Firstly, that supply dictates demand, and secondly, the past seven years. Going forward, international revenues will remain an that demand will be increasingly spiky over time. Looking further ahead, it increasingly important part of the PPL story. is right to highlight the aging population of live music performers (see chart below). Deloitte plotted Pollstar’s top grossing US tours of the decade by On the other hand, PRS for Music collected a total of £611.2m in royalties age of lead singer in 2011, finding that 40 percent of the top 20 acts will be in 2010, down 1.1 percent on the previous year’s record of £618.2m – the in their 60s in 2011. A further 19 percent will be in their 50s and 35 percent first drop in collections in recent memory. An 8.8 percent drop in recorded music sales contributed to the £7m decline in royalties collected. This Pollstar top grossing US tours of the decade, was offset by a 4.3 percent growth in royalties from digital services, a by age of lead singer in 2011 1.9 percent rise in radio royalties, and cost savings of nearly 10 percent. As such, net distributable revenue fell just 0.2 percent last year, from Source: Pollstar, Deloitte £548.8m in 2009 to £547.9m in 2010. The international success story of PRS for Music has been well documented 6% in the past, with the UK being one of only three net exporters of musical repertoire, along with the US and Sweden. Interestingly, in 2010 Sweden 60s sent out more than it brought in, so now we are down to only two. 50s When we looked more closely at these remaining two net exporters, in 35% 40% particular PRS for Music in the UK and the main US societies ASCAP and BMI, we found that PRS for Music members significantly outperformed 40s their equivalents across the pond in terms of net trade balance – money in minus money out. The chart overleaf illustrates the index of this 30s trade balance to show the net export growth of the two markets. What is striking is that the relative growth of the UK has significantly outperformed the US, increasing its trade balance 165 percent from 19% $35m in 2004 to $95m in 2010. By comparison, the two US societies have grown their balance by 44 percent from $310m in 2004 to $452m Page 5 of 10
  • 6. in 2010. It’s worth noting that, while this is an index of a net figure, the at $474m. This tells us that whilst all three societies have seen steady analysis remains robust when you think comparatively: if you were to growth of 20-30 percent in money sent out to affiliates (imports), PRS for multiply PRS for Music’s money in and money out by a factor of five to Music has almost doubled its incoming revenue (exports), outperforming reflect the US’ greater population, the balance would be broadly similar the US societies by a factor of three. Index of money in less money out: trade balance of US and UK PROs Source: CISAC 300 PRS for Music trade balance 265 ASCAP and BMI trade balance 250 200 150 144 100 2004 2005 2006 2007 2008 2009 2010 What the export performance of PRS for Music and PPL tells us is that 2009 numbers to produce a consistent year-on-year change for the report. for artists and songwriters, the potential to build upon an impressive international track record is huge. Whether it’s the US performance right As such, we are able to revise our 2009 valuation of publisher non-society debate, or the growing importance of markets like Brazil, Russia, India and revenues from £103m to £241m. The 2010 figure is broadly constant at China (BRICs), the UK as a net exporter is well positioned to benefit from £242m, increasing just 0.6%, with growth in sync being offset by falling growth in these re-emerging markets. Indeed, given the current economic collections from societies outside the UK. This suggests some stability in the climate, there may well be more potential overseas than there is back at aggregate publisher revenue. home – a topic we will return to in our conclusion. A good proportion of these revenues is derived from the sub-publishing Publisher direct revenues: new insights, significant revisions revenue, which in most countries comes through collecting societies such as GEMA or SACEM. A fifth of the revenue is derived from sync licensing Of the seven revenue streams which make up the UK music industry income paid to UK publishers. UK-based sync (turquoise area in chart in this annual report, publisher direct revenues have always been the overleaf) captures revenues paid from UK users to publishers for the use most challenging to calculate due to the lack of existing industry data. of UK originated works and the local publisher share of non-UK originated Compounding the complexity further is the nature of music publishing works. The non-UK based sync (orange area) captures revenue flowing back itself, which is beyond generalisation as there are so many different players from overseas for the use of UK originated tracks, net of the local publisher’s operating in so many different markets, from grand rights to computer share. As with other methodology within this work, these actions are taken games. Reassuringly, this year’s Adding Up report can offer an important to allow other countries to replicate this work for their own region without advances in understanding this often misunderstood, yet fundamental, double counting. part of the music industry. Looking beneath the top line, what is perhaps most striking in the chart By working with the Music Publishers Association (MPA), we were able to below is the stability shown in the five publishing revenue streams survey its membership at a granular level, to appreciate the diverse set of over the three years. There are some notable winners and losers worth revenues and calculate the value of each. Thanks to the MPA, we are now highlighting. Synchronisation of UK works abroad has grown from £25m able to offer a more comprehensive summary of direct publisher revenues, in 2009 to £34m, while sync within the UK has grown £1m during which goes far beyond the 40:40:20 (mechanical:performing:sync) rule of the same period, again stressing the importance of exports. UK print thumb that existed before. revenues have stayed remarkably constant over the past three years. Unsurprisingly, mechanical licensing income (which is collected through The survey, which was conducted by the MPA and economists at PRS for MCPS and hence excluded) has been on a steep downward trend for the Music, focused on the core membership of the trade body, and breaks down best part of a decade, yet the fact that each of these revenue streams publisher revenues into key streams (e.g. sync, grand rights, print) and then have shown stability illustrates one of the core strengths of the music into geography (UK revenues and international receipts). The survey gathered publishing business: a balanced portfolio with many royalty eggs in data from the past three years, which allows us to backdate the 2008 and several revenue baskets. Page 6 of 10
  • 7. UK music publisher revenues excluding PRS for Music payments, 2008-10 Source: MPA survey of members and PRS for Music calculation (£m) £250 Other revenue (inc. exceptional items) Grand right licensing £200 Sync licensing (non UK-based) £150 Sync licensing (UK-based) Printed music sales (inc. sales, hire, licensing) £100 Other collecting societies £50 North American collecting societies European collecting societies £0 2008 2009 2010 Record companies: no longer just a wholesaler of music ‘We’re no longer just a wholesaler of music,’ stated Paul Smernicki, Director the majority of record label revenues come from outside the physical of Digital at Universal Music Group, in a recent article in The Economist. product market. This astute observation acknowledges that, as their traditional business declines, record labels are becoming more skilled at licensing live music There is a push-and-pull element to what’s driving revenues in this and merchandise. The growth in B2B revenues of 7.2 percent to £218.4m, sector. The developments in the computer games sector have helped pull the fourth consecutive year of reported growth, shows that labels are revenues forward. Year-end statistics from GfK Chart-Track reveal that unit reallocating their resources into B2B markets. Put more bluntly, the growth sales of music games in the UK increased by 13.7 percent in 2010, against in this sector illustrates the old adage ‘you only get out what you put in’. an overall decline of 14.3 percent. Hence, the growth areas in computer games are driven by music, such as Michael Jackson: The Experience, which To recall, B2B revenues are a combination of the five revenue streams in turn drives sync revenues for both record labels and music publishers. that the BPI previously defined as secondary revenues, along with the Indeed, the developments with Lady Gaga and Farmville may well mark a additional B2B revenues that arise from ad-funded digital models. Those new beginning in this convergence story. five revenue streams are comprised of: (i) the £73m in public performance licensing PPL has passed on to the labels, (ii) synchronisation revenues, Similarly, developments in merchandising have increased secondary (iii) premium revenues from covermounts and consumer promotions, revenues. In the past, a label might acquire a t-shirt manufacturing (iv) artist-related income from merchandising and touring and (v) ‘other company with the intention that artist deals would simply encompass income’, which refers to record company share of revenue from shows or merchandise revenues from touring. Now, that t-shirt company will have films, and record company income from music-related TV productions. diversified its product range from hooded tops to high-level fashion and On this occasion, detailed analysis of company accounts allowed us to diversified its retail outlets from concert stalls to the High Street and estimate the value of these five revenue streams at £206m in 2010, up airports. This in turn brings a better proposition to artists, which then 6.5 percent on £193.5m in 2009. On top of this is a further £10.8m in ad- allows broader deals to be done, and secondary revenues to grow. funded digital and £1.6m from other digital sources not captured in the retail value of music. As such, B2B revenues total an impressive £218.4m. Artists and managers are utilising direct-to-fan tools more, plus they are now able to make better make-or-buy decisions as to what services they acquire This £218.4m in secondary revenue is in addition to the £213m in digital and what they can do themselves. This internal competition is forcing the trade revenue highlighted in the earlier table. So, the combined total of labels to advance their offer in terms of products, services and expertise. label revenue that does not come from the declining physical product market is a healthy £431m, or 41 percent of the total – highlighting the Advertising and sponsorship growing importance of diversification to the modern UK record label. This We have continued our partnership with FRUKT Communications to observation may irritate the industry, with many an external armchair critic improve our understanding of this unconventional part of the UK music still touting the observation that labels are dead and therefore they need to industry. As before, we have identified six primary channels where brands diversify. Yet the evidence asserts this has already happened. In fact, we are can spend money on music. The table provides definitions for each of the possibly only one Adding Up report away from stating that six categories, as well as the headline numbers. Page 7 of 10
  • 8. Channel FRUKT definition 2010 Spend (£m) Share Live music The spend on sponsorship rights and direct (e.g. on-site and at event) activation £32.9 35.1% sponsorship costs for festivals Event creation The creation of custom experiential (e.g. event-based) activity; includes all £8.1 8.7% direct activation costs for event Artist endorsement The use of image rights and appearances of artists to endorse a specific brand/ £3.3 3.5% product/service Digital The creation of specific music-focused digital and mobile activities, as £7.3 7.8% standalone platforms or within wider music campaigns TV Sponsorship of existing music-specific or music-focused TV programs and the £21.8 23.3% creation of ad-funded TV activity Advertising support The use of above the line (ATL) advertising and below the line (BTL) promotions £20.2 21.6% to support existing music campaigns (e.g. festival activity, venue naming, custom events, artist endorsements) TOTAL £93.6 The aggregate spend of nearly £94m represents an increase of 4.2 towards more complex multi-channel activations. Furthermore, the percent, and is largely a result of growing sophistication within the growing reach of both festival and digital channels into lucrative 18 to space, as brands become more sophisticated in engaging consumers at 35 year-old audience means that rights and media owners can demand events, online and through traditional advertising, competitors and new higher investment rates. The year-on-year movement across the six entrants are forced to move away from simple badging and sponsorship categories is illustrated in the chart below. Year-on-year change in music advertising and sponsorship revenues, 2009-10 Source: FRUKT 17.5% 16.3% 13.8% 12.5% 7.5% 6.8% 2.0% 2.5% 1.1% -0.5% -2.5% Live music Event Artist Digital TV Advertising sponsorship creation endorsement support Page 8 of 10
  • 9. Breaking down the six categories, Live Nation and AEG are leading the Dealing first with the very unsexy topic of transaction processing way in live sponsorship for both festivals and venues in 2010. As the and metadata, which is actually the lifeblood of all operational consumer value of download promotions and pure content platforms environments, some key points need to be made: in the digital world decreases, live music platforms are underpinning the approach of many there is constant change, greater complexity and significantly higher brands. However, some brands have moved back towards their own volumes to manage. Business models in the digital world are constantly event creation, although many of these take the form of limited-scale changing to meet voracious consumer demand. By contrast, for events and are often used as content creation forums. example, the TV broadcasting model didn’t change from its inception until the advent of cable and satellite services, and even then by very Artist endorsements saw a significant increase in 2010, growing 13.8 little. The complexity of arrangements amongst all parties involved percent, the second largest increase behind digital. Much of this increase in the supply chain are getting ever more detailed as content is sliced was down to the rise in low- to mid-level artist partnerships, rather and diced to almost infinite levels of granularity. The only way these than the large scale international deals, which were more prevalent in transaction processing demands can be met is through the development 2009. Endorsements led from the US are not counted within this sector; of cross-industry technical standards, deployed right across the supply however advertising or digital support that originated in the UK is. chain to provide an entirely automated global environment. This sector has seen an evolution in strategy and growing sophistication in approach. Artist partnerships are now spanning across channels, often Through standardisation initiatives such as DDEX, the Global Repertoire centred around a launch event and a stream of digital content. At the Database and PPL copyright database (with both global initiatives being same time, labels and management are signing and selling artists to driven by UK societies), high quality data about musical works and brands with a growing level of acumen - artists such as Eliza Doolittle or sound recordings will be available to the entire supply chain, and the Pixie Lott are being positioned as both performers and brand advocates. methods of communication of that data along the supply chain will be automated. This will drive down transaction costs in creating, managing Digital's growth of 16.3 percent is to be expected. Brands in the UK and communicating the data. Now, lowering transaction costs doesn’t continue to utilise this as a core communications channel and, with just cut costs but importantly produces benefits in higher levels of so much music consumption happening online, it's a natural space for efficiency that speed up cash flow, lower barriers to entry for new brands to sit. Brand-funded TV content focused around music continues legal services and leads to a better allocation of resources - away from to make up a significant proportion of brand spend, just shy of a quarter managing data and toward monetising it. of the total pie. Growth has slowed due to the lack of a new mass- market vehicle in 2010 (for example X Factor, Britain's Got Talent), There is an old expression about North Sea oil which is that it takes two however both Channel 4 (through T4 and 4Music) and ITV (via ITV2 and barrels of oil to get one barrel out of the pump. Current transaction 3) have continued to attract brands as sponsors of content. Advertising costs in the digital music supply chain often feel like that too. Instead of support was the only revenue stream to record a fall in investment in costing the industry money, metadata should be standardised in such a 2010, but a drop of just 0.5 percent is far less than in wider advertising way that it enables the industry to deliver greater efficiency gains. markets. The second recommendation is to ‘get abroad’. The earlier case studies As with so many other revenue streams covered in this year’s report, of PRS for Music as well as PPL and MPA illustrate the potential, but the supply-side takes priority here. The future path of advertising and do not take account of the changing market. Take the BRIC economies sponsorship revenues will depend more on the resources thrown at of Brazil, Russia, India and China, which leading investment banks it than anything else. Encouragingly, the Music Managers Forum has estimate will equal the G7 in terms of economic power by 2028, if already recognised this and is taking a more pro-active role at engaging not a whole lot sooner. Currently, the performing right collections UK managers and artists with new and established brands to develop of these four countries are equal to those of Spain. The risk is that this sector further. there are two different trajectories; economic growth and intellectual property growth – with the former significantly outpacing the latter. Get small, get abroad Global organisations like WIPO need to rethink IP in this context, and UK music needs to rethink its export strategy, given the geopolitical It would be foolish to ignore the obvious trend, which is that physical rebalancing taking place within these re-emerging economies. product took a hammering in 2010 and less money was spent on tickets, and it would be tough for the B2B sectors to grow enough to off-set this An excellent piece of BPI research underlines the importance of downturn. UK consumers spent £215m less on music in 2010 than the looking beyond borders. According to the BPI, UK artists’ share of prior year – a big dent. Therefore, a succinct summary could be that the global sales is estimated to be 11.8 percent in 2010, with one-in-ten big numbers fell and the small numbers grew. sales in the US being a UK act and up to one-in-five in markets like Germany and Australia. BPI also commissioned Ipsos MORI to put a It would be equally foolish for one part of the music industry to publish series of statements to the public about the success and importance a strategy for another to follow to reverse these downward trends. With of British music, with 83 percent of people feeling proud of British so many complexities and nuances associated with each of the seven music’s achievements. As the excellent BBC documentary Made in revenues streams, it is best left to the experts within them to work out Britain has shown, the list of goods and services that we truly excel their own road ahead. However, the report does hang together all the in exporting is becoming increasingly limited and is centred on ideas different components in such a way that some cross-cutting themes can and intellectual property. Therefore it makes sense to work on re- be put forward. Two key themes deserve a mention here: ‘get small’ and positioning the UK music industry for the changes taking place in the reduce the transaction costs of managing metadata, and ‘get abroad’ to global economy, to maximise the potential of its songwriters and maximise the export opportunity of UK music, given the unprecedented artists in markets that may have been ignored in the past but simply changes now taking place in the global economy. cannot be overlooked anymore. Page 9 of 10
  • 10. BBC Introducing new artists at home and abroad Andy Parfitt is Controller of BBC Radio 1, Radio 1Xtra, Asian Network and Popular Music On a freezing evening at the end of 2009 I made my Why was Florence Welch here sharing the small way to The Flowerpot, a classic Kentish Town music stage with Out Like a Lion, a West Country indie-pop venue. My job that night was to explain to an audience outfit playing their first ever gig? As it happened, of journalists, politicians and opinion formers what Florence was back to say a generous ‘thank you’ for BBC Introducing had been doing throughout the year, the early support she received from BBC Introducing. and why they might be interested. Her presence hopefully encouraged others in pursuit of creative recognition, recording contracts, festival Readers of this report will probably already know that bookings - on a macro level, those looking ahead at the BBC Introducing is a service for unsigned artists, which difficult road to economic success for UK music. allows them to upload tracks to the BBC so that they can be listened to and assessed by a range of producers The encouragement and mentoring that presenters and presenters, providing them with an instant and like Zane Lowe, Tom Robinson or Steve Lamacq give steady stream of burgeoning UK talent. Being ‘spotted’ to these grassroots artists is part of the offer – how can result in a BBC session on BBC local radio, Radio 6 to get a good contract, what the A&R department Music, a playlist slot on Radio 1 – even a performance might bring and all the other questions relating to on a BBC Glastonbury stage. It is a remarkably simple the professional world of the industry. The UK has but powerful idea that is the modern day equivalent an extraordinary and unique young music-making of sending a demo cassette to John Peel, or loitering culture and the BBC provides resources and powerful outside the Radio 6 Music studios ready to thrust a CD platforms. into a presenter’s hand. As this report states, the UK, in per capita terms, The evening at The Flowerpot started with my short remains in the top three recorded music markets in speech and was followed by live performances from the world, towering over the US market. This is an some bands that had recently uploaded their tracks astounding result from such a small yet hugely artistic – also, amazingly, on the bill that night – in this tiny nation. In a recent BPI survey, 83% of people are proud pub – was Florence and the Machine, one of the few of British music’s achievement, a major award in itself international breakthrough acts to have made an for the UK music industry. Despite the challenges, the impact in the US, and contributed significantly to both UK is still in a remarkable leadership position in this the recorded and live revenues laid out so clearly in creative sector. this report. Acknowledgements: This paper would not have been possible without collaboration from analysts and commentators from across the music industry. Therefore, we would like to thank: Chris Green, Rob Crutchley (BPI), Gabi Lopes, Callum Smith (IFPI), Paul Smernicki (Universal Music Group), Mark Isherwood (DDEX), Steve Redmond (ERA), Fran Nevrkla, Tony Clark, Jonathan Morrish, Christian Barton (PPL), Greg Parmley (IQ magazine), Steve Machin (Storm Crowd), Manfred Tari (Pop 100), Will Muirhead, George Prior (Tixdaq), Stephen Navin, Will Lines (MPA), Chris Helm, Hank Forsyth (EMIP), Will Downs (Sony/ATV), Cliff Dane (Media Research Publishing), Dom Hodge and team (FRUKT), Paul McManus (MIA), Andy Parfitt, Laura Gosling (BBC), Feargal Sharkey, Adam Webb (UK Music), Pete Downton (39 Ventures), Jonathan Haskell, Peter Goodridge (Imperial College London), Andrew Bud (mBlox), David Touve (Washington & Lee University), Stewart McKie (Strathclyde Business School), Chris Deering (former president of Sony Europe), Keith McMahon (STL Partners), Bill Gorjance (peermusic), Juana Espasa Mateos. Also, Robert Ashcroft, Julia Griffin, William Booth, Benjamin McEwen, Jeremy Fabinyi, Gary Eggleton, Bruce Dickinson, Dave Pincott, Nicholas Brookes, Chris Haynes, Paul Nichols, Steve Cole, Lisa Eaton, Anita Awbi (PRS for Music).