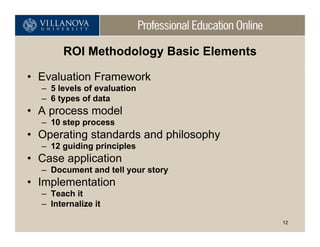
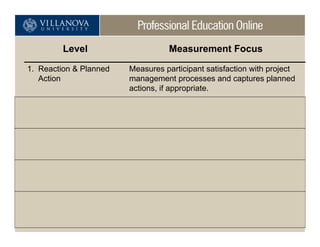
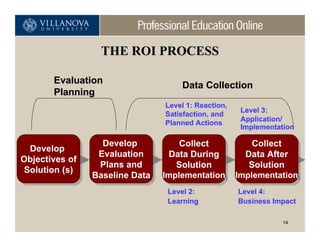
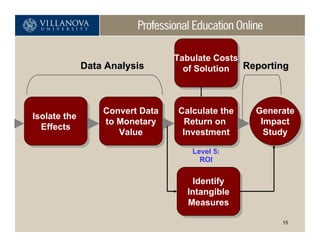
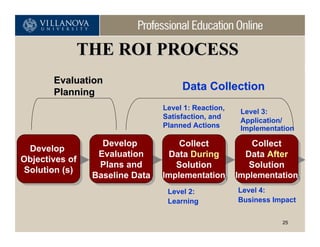
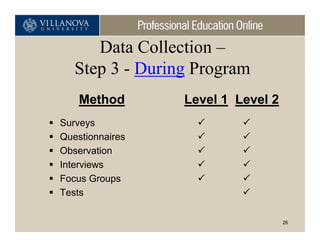
Identifying the Value of
  Project Management

      Presented by
  Wayne Brantley. MS Ed
    PMP, CPLP, CRP

       Senior Director
 of Professional Education
    Villanova University

                             1
Agenda
• Identify why you need to measure the value of
  project management
• Introduction to the ROI Methodology
• Explain the benefits of implementing the ROI
  Methodology in your organization


                                                 2
Why Do We Need Project Management?

• Approximately 70% of projects are:
   – Over budget
   – Behind schedule


• 52% of all projects finish at 189% of their initial
  budget


                                                        3
Resistance to Implementing Project
                 Management
•   It takes to long
•   Just do it attitude
•   Costs to much in resources
•   We already manage projects
•   We don’t want to know how bad


                                           4
What is ROI?

        Net Monetary Benefits
ROI =                           X 100
           Program Costs


                                        5
WRONG!
• Okay, right if you’re an MBA
• It is a story of how you collected the data
• Identifies where the data comes from
• Shows all the numbers
• Shows who deserves what credit
• Reports intangibles!!!
• It is a methodology

                                                6
ROI Uses
   Project Management
Organization Development
        Consulting
    Change Initiatives
Technology Implementation
   Quality / Six Sigma
  Training and Learning
        Coaching

                            7
The ROI Process Takes A Balanced View by
            Measuring and Reporting:

•   Reaction to program
•   Learning and attitudes
•   Application on the job
•   Impact in work unit                   Customer
                                             e
                                                            Customer
                                                               e
                                        loye              loye
                                    Emp     Processes Emp     Processes
•   Impact on the customer
                                     Financial         Intangible
•   The financial results
•   Intangible benefits
•   Nature and source of problems and opportunities


                                                                    8
What You Can Do With an ROI Evaluation

•   Show contributions of project management
•   Earn respect of senior management
•   Gain the confidence of clients
•   Improve support for project management initiatives
•   Enhance project management processes
•   Identify inefficient processes that need to be
    redesigned


                                                   9
Why Use an ROI Analysis?

Reactive
• Justify/defend budgets
• Identify inefficient processes that need to be
  redesigned or eliminated
• Show contributions of project management


                                                   10
Why Use an ROI Analysis?
Proactive
•   Aligns project management strategically to business needs
•   Earn respect of senior management/administrators
•   Improve support for project management
•   Enhance initiation and planning processes
•   Identify successful processes that can be implemented in
    other areas


                                                           11
ROI Methodology Basic Elements

• Evaluation Framework
  – 5 levels of evaluation
  – 6 types of data
• A process model
  – 10 step process
• Operating standards and philosophy
  – 12 guiding principles
• Case application
  – Document and tell your story
• Implementation
  – Teach it
  – Internalize it

                                        12
Level                       Measurement Focus

1. Reaction & Planned     Measures participant satisfaction with project
   Action                 management processes and captures planned
                          actions, if appropriate.

2. Learning               Measures changes in knowledge, skills, and
                          attitudes related to project management.

3. Application            Measures changes in on-the-job behavior or
                          actions as project management is applied,
                          implemented, or utilized.

4. Business Impact        Measures changes in business impact
                          variables.

5. Return on Investment   Compares project management benefits to the
                          costs.
                                                                    13
THE ROI PROCESS

       Evaluation                   Data Collection
       Planning
                                Level 1: Reaction,
                                                     Level 3:
                                Satisfaction, and
                                                     Application/
                                Planned Actions
                                                     Implementation

                  Develop
                   Develop          Collect
                                     Collect        Collect
                                                    Collect
  Develop
  Develop        Evaluation
                  Evaluation      Data During
                                  Data During     Data After
                                                  Data After
Objectives of
Objectives of    Plans and
                  Plans and        Solution
                                    Solution       Solution
                                                   Solution
Solution (s)
 Solution (s)   Baseline Data
                Baseline Data   Implementation Implementation
                                 Implementation Implementation
                                 Level 2:            Level 4:
                                 Learning            Business Impact

                                                                14
Tabulate Costs
                                  Tabulate Costs
               Data Analysis        of Solution  Reporting
                                    of Solution


                   Convert Data
                   Convert Data   Calculate the
                                  Calculate the    Generate
                                                   Generate
Isolate the
 Isolate the       to Monetary
                    to Monetary    Return on
                                    Return on       Impact
                                                     Impact
   Effects
   Effects             Value
                       Value       Investment
                                    Investment       Study
                                                      Study
                                     Level 5:
                                       ROI


                                      Identify
                                       Identify
                                    Intangible
                                     Intangible
                                    Measures
                                     Measures
                                                        15
Evaluation Planning


                      16
Step 1 – Develop Objectives

• Level 1 and 2 objectives provide
  – Reaction on initiative
  – Feedback on implementation
  – Information on knowledge and skills obtained

• Level 3 and 4 objectives provide
  – Expectations on initiative
  – Satisfaction for program sponsors
  – Ties project management to strategic goals


                                                   17
Criteria for Selecting Programs for Levels
           4 & 5 (ROI) Evaluation
  • Expected life cycle of projects
  • The importance of the project in meeting the
    organization’s goals
  • Cost of the project
  • Visibility of the project
  • The size of the target audience
  • Extent of management interest
                                                   18
ROI Target Options
1. Set the value as with
   other investments, e.g.
   15%

2. Set slightly above other
   investments, e.g. 25%        ROI
3. Set at break even - 0%

4. Set at client expectations

                                      19
Evaluation Planning
• Initial Kick-off Meeting
   – Who should be involved?
   – What would increase success?
   – What do we cover?


                                    20
Step 2 – Develop Evaluation Plans and
                    Baseline Data
• Data Collection Plan
  –   Broad program objectives for each level of evaluation
  –   Measures
  –   Data Collection Method/Instruments
  –   Data Sources
  –   Timing
  –   Responsibilities


                                                       21
Evaluation Planning

• ROI Analysis Plan
  – Data Items (from level 4 objectives)
  – Methods for Isolating the effects of the
    Program/Process
  – Methods of converting data to monetary values
  – Cost categories
  – Intangible benefits
  – Communication targets for final report
  – Other Influences/Issues during implementation
  – Comments


                                                    22
Evaluation Planning

• Project Plan
  –   Major Milestones
  –   Deliverables
  –   Timelines
  –   Flow


                                    23
Data Collection


                  24
THE ROI PROCESS
       Evaluation
       Planning
                                     Data Collection
                                Level 1: Reaction,
                                                     Level 3:
                                Satisfaction, and
                                                     Application/
                                Planned Actions      Implementation

                  Develop
                   Develop          Collect
                                     Collect        Collect
                                                    Collect
  Develop
  Develop        Evaluation
                  Evaluation      Data During
                                  Data During     Data After
                                                  Data After
Objectives of
Objectives of    Plans and
                  Plans and        Solution
                                    Solution       Solution
                                                   Solution
Solution (s)
 Solution (s)   Baseline Data
                Baseline Data   Implementation Implementation
                                 Implementation Implementation
                                 Level 2:            Level 4:
                                 Learning            Business Impact


                                                                25
Data Collection –
   Step 3 - During Program
    Method       Level 1 Level 2
Surveys
Questionnaires
Observation
Interviews
Focus Groups
Tests

                                   26
Survey/Questionnaire Design

•   Determine the specific information needed
•   Review with stakeholders
•   Select type(s) of questions
•   Keep simple
•   Develop the questions
•   Design for easy scoring
•   Develop administrative procedures
•   Address anonymity issue


                                                27
Survey/Questionnaire Design

• Common mistakes
  –   Vague statements/questions
  –   Too many questions
  –   Improperly worded questions
  –   Confusing instructions
  –   Too difficult to analyze


                                        28
Data Collection
        Step 4 - Post Program
    Method                      Level 3 Level 4
• Surveys
• Questionnaires
• Observations on the job
• Interviews
• Focus Groups
• Action planning/improvement
  plans
• Performance contracting
• Performance monitoring                          29
Action Plan Part I

Name: (optional) _______________________________________
Company/Organization: (optional) __________________________
Job Title (optional): _____________________________________
Course Date: ___________________________________________


          Specific Steps: I will do this    End Result: So that


          1.   Action 1
          2.   Action 2
          3.   Action etc…..


           Expected Intangible Benefits:


                                                                  30
Action Plan Part II
  Name: (optional) _______________________________________
  Company/Organization: (optional) __________________________
  Job Title (optional): _____________________________________
  Course Date: ___________________________________________


                                                Analysis
A. What is the unit of measure? Does this measure reflect your performance alone?
B. What is the value? $________
C. How did you arrive at this value?
D. How did this measure change during the last month of the evaluation period compared to the average before
the program?
E. What percent of the change was actually caused by the application of the course?
F. What level of confidence do you place on the above information? 100%=certainty and 0%=No Confidence


                                   Actual Intangible Benefits:


                                                                                                          31
Data Analysis


                32
Tabulate Costs
                              Tabulate Costs
      Data Analysis             of Solution Reporting
                                of Solution


               Convert Data
               Convert Data   Calculate the
                              Calculate the   Generate
                                              Generate
Isolate the
 Isolate the   to Monetary
                to Monetary    Return on
                                Return on      Impact
                                                Impact
   Effects
   Effects         Value
                   Value       Investment
                                Investment      Study
                                                 Study
                                 Level 5:
                                   ROI

                                  Identify
                                   Identify
                                Intangible
                                 Intangible
                                Measures
                                 Measures
                                                   33
Step 5 - Isolating Methods
•   Isolation shows your contribution
•   Techniques used
    •   Control groups
    •   Trend line analysis
    •   Forecasting methods
    •   End user/performer’s, supervisor’s, and/or management’s
        estimate of impact (percent)
    •   Use of experts/previous studies
    •   Subordinate’s input of program impact
    •   Calculate/Estimate the impact of other factors
    •   Customer input                                            34
Schedule Delays
                                 100%
Percent of Project on Schedule


                                                  PM Implementation

                                                                                       Actual Average 94.4%
                                 95%


                                  90%
                                        Pre Program Average                                 Average of Trend
                                                                                        Projected 92.3%
                                          87.3%
                                                                          on
                                  85%                           Pr o jecti
                                                            d
                                                       Tren

                                         J   F     M      A        M      J    J   A    S    O    N   D       J


                                                                       Months                                     35
Example of a Participant’s Estimation

                                                   Adjusted
  Factor that      Percent of    Confidence       Percent of
  Influenced      Improvement   Expressed as a   Improvement
 Improvement       Caused By       Percent        Caused By
Project              60%             80%            48%
Management
System Changes       15%             70%            10.5%

Market Changes        5%             60%             3%

Process Changes      20%             80%            16%

Total                100%


                                                               36
Step 6 –
    Converting Data to Monetary Value
•   Challenging
    •   Use data bases
    •   Look at past project performance
    •   Look at profits / savings from output
    •   Historical costs / savings
    •   Experts input
    •   End user input
    •   Staff estimation
                                                37
Example of Converting Data Using
           External Database
Cost of PMP Certified Consultant*
Non –certified PM               $120/hr = $240k annually
Certified PM                    $180/hr = $360k annually
Cost for PMP                    150% increase in billable rate

* External data - value obtained from industry professionals


                                                          38
Example of Converting Data Using
Historical Records & Expert Input
The Cost of a Schedule delay

           Actual Costs        Reworks, Penalties,
          from Records
                                 Loss Revenue

    35                                                 $852,000
   Days


           Estimated             Project Staff Time,
      Additional from Staff      Management Time


                                                           39
Example of Converting Data Using
Historical Records & Expert Input
The Cost of a schedule delay


          $852,000 Per Day / 35 Days = $24k per day


                                                      40
Co       Step 7 - Intangible Benefits
     mp
        lai
            nt   s   Teamwork


 Con f li c t s          Commitment           Stress
               act
                   ion                      e nt
           tisf                       ag em
         Sa                    E ng
 Job                                    Customer Service
                                                      41
Step 8 - Tabulating Costs
•   Consider all costs
    •   Analysis costs
    •   Planning costs
    •   PM costs
    •   Monitoring and control costs
    •   Operating/maintenance costs
    •   Evaluation costs


                                       42
Tabulating Costs
•   Recommended items
    •   Needs assessment    •Travel/lodging/meals
    •   Development costs   •Participants’ time
    •   Program materials   •Project Management
                            costs
    •   Training costs
                            •Operations overhead
    •   Consulting costs    •Evaluation costs


                                                    43
Tabulating Program Costs
            Direct                   Indirect
•   Program Materials   •   Needs Assessment
•   Methodology         •   Program Development
•   Training Costs      •   Participant Time
•   Facilities          •   Administrative Overhead
•   Travel              •   Evaluation


                                                  44
Step 9 - Calculating ROI


Benefits/Cost        Monetary Benefits
        Ratio   =
                       Program Costs

                Net Monetary Benefits    X 100
   ROI =
                    Program Costs

                                                 45
ROI Example

Costs for project                  $80,000
Benefits from project             $240,000

          $240,000      =   3.0
BCR =     $80,000

             $160,000
ROI =                       x 100 = 200 %
              $80,000
                                             46
Reporting


            47
Tabulate Costs
                              Tabulate Costs
      Data Analysis             of Solution Reporting
                                of Solution


               Convert Data
               Convert Data   Calculate the
                              Calculate the   Generate
                                              Generate
Isolate the
 Isolate the   to Monetary
                to Monetary    Return on
                                Return on      Impact
                                                Impact
   Effects
   Effects         Value
                   Value       Investment
                                Investment      Study
                                                 Study
                                 Level 5:
                                   ROI

                                  Identify
                                   Identify
                                Intangible
                                 Intangible
                                Measures
                                 Measures
                                                   48
Step 10 - ROI Impact Study
•   Complete report
    •   General information
    •   Methodology
    •   Data analysis
    •   Costs
    •   Results
    •   Barriers and enablers
    •   Summary of findings
    •   Conclusions and recommendations
    •   Exhibits - attachments            49
How do you get started with ROI?

• Develop an evaluation strategy
• Build capability
  – Training
  – Publications
  – ROI Certification
• Conduct an ROI Study
• Revise policies and procedures


                                        50
Summary
• Identified why you need to measure the value of
  project management
• Introduced the ROI Methodology
• Explained the benefits of implementing the ROI
  Methodology in your organization


                                                    51
Contact Information

• Wayne Brantley – Villanova University

• 1-800-874-7877, ext. 509

• Wayne.Brantley@VillanovaU.com


                                          52

Brantley.wayne

  • 1.
    Identifying the Valueof Project Management Presented by Wayne Brantley. MS Ed PMP, CPLP, CRP Senior Director of Professional Education Villanova University 1
  • 2.
    Agenda • Identify whyyou need to measure the value of project management • Introduction to the ROI Methodology • Explain the benefits of implementing the ROI Methodology in your organization 2
  • 3.
    Why Do WeNeed Project Management? • Approximately 70% of projects are: – Over budget – Behind schedule • 52% of all projects finish at 189% of their initial budget 3
  • 4.
    Resistance to ImplementingProject Management • It takes to long • Just do it attitude • Costs to much in resources • We already manage projects • We don’t want to know how bad 4
  • 5.
    What is ROI? Net Monetary Benefits ROI = X 100 Program Costs 5
  • 6.
    WRONG! • Okay, rightif you’re an MBA • It is a story of how you collected the data • Identifies where the data comes from • Shows all the numbers • Shows who deserves what credit • Reports intangibles!!! • It is a methodology 6
  • 7.
    ROI Uses Project Management Organization Development Consulting Change Initiatives Technology Implementation Quality / Six Sigma Training and Learning Coaching 7
  • 8.
    The ROI ProcessTakes A Balanced View by Measuring and Reporting: • Reaction to program • Learning and attitudes • Application on the job • Impact in work unit Customer e Customer e loye loye Emp Processes Emp Processes • Impact on the customer Financial Intangible • The financial results • Intangible benefits • Nature and source of problems and opportunities 8
  • 9.
    What You CanDo With an ROI Evaluation • Show contributions of project management • Earn respect of senior management • Gain the confidence of clients • Improve support for project management initiatives • Enhance project management processes • Identify inefficient processes that need to be redesigned 9
  • 10.
    Why Use anROI Analysis? Reactive • Justify/defend budgets • Identify inefficient processes that need to be redesigned or eliminated • Show contributions of project management 10
  • 11.
    Why Use anROI Analysis? Proactive • Aligns project management strategically to business needs • Earn respect of senior management/administrators • Improve support for project management • Enhance initiation and planning processes • Identify successful processes that can be implemented in other areas 11
  • 12.
    ROI Methodology BasicElements • Evaluation Framework – 5 levels of evaluation – 6 types of data • A process model – 10 step process • Operating standards and philosophy – 12 guiding principles • Case application – Document and tell your story • Implementation – Teach it – Internalize it 12
  • 13.
    Level Measurement Focus 1. Reaction & Planned Measures participant satisfaction with project Action management processes and captures planned actions, if appropriate. 2. Learning Measures changes in knowledge, skills, and attitudes related to project management. 3. Application Measures changes in on-the-job behavior or actions as project management is applied, implemented, or utilized. 4. Business Impact Measures changes in business impact variables. 5. Return on Investment Compares project management benefits to the costs. 13
  • 14.
    THE ROI PROCESS Evaluation Data Collection Planning Level 1: Reaction, Level 3: Satisfaction, and Application/ Planned Actions Implementation Develop Develop Collect Collect Collect Collect Develop Develop Evaluation Evaluation Data During Data During Data After Data After Objectives of Objectives of Plans and Plans and Solution Solution Solution Solution Solution (s) Solution (s) Baseline Data Baseline Data Implementation Implementation Implementation Implementation Level 2: Level 4: Learning Business Impact 14
  • 15.
    Tabulate Costs Tabulate Costs Data Analysis of Solution Reporting of Solution Convert Data Convert Data Calculate the Calculate the Generate Generate Isolate the Isolate the to Monetary to Monetary Return on Return on Impact Impact Effects Effects Value Value Investment Investment Study Study Level 5: ROI Identify Identify Intangible Intangible Measures Measures 15
  • 16.
  • 17.
    Step 1 –Develop Objectives • Level 1 and 2 objectives provide – Reaction on initiative – Feedback on implementation – Information on knowledge and skills obtained • Level 3 and 4 objectives provide – Expectations on initiative – Satisfaction for program sponsors – Ties project management to strategic goals 17
  • 18.
    Criteria for SelectingPrograms for Levels 4 & 5 (ROI) Evaluation • Expected life cycle of projects • The importance of the project in meeting the organization’s goals • Cost of the project • Visibility of the project • The size of the target audience • Extent of management interest 18
  • 19.
    ROI Target Options 1.Set the value as with other investments, e.g. 15% 2. Set slightly above other investments, e.g. 25% ROI 3. Set at break even - 0% 4. Set at client expectations 19
  • 20.
    Evaluation Planning • InitialKick-off Meeting – Who should be involved? – What would increase success? – What do we cover? 20
  • 21.
    Step 2 –Develop Evaluation Plans and Baseline Data • Data Collection Plan – Broad program objectives for each level of evaluation – Measures – Data Collection Method/Instruments – Data Sources – Timing – Responsibilities 21
  • 22.
    Evaluation Planning • ROIAnalysis Plan – Data Items (from level 4 objectives) – Methods for Isolating the effects of the Program/Process – Methods of converting data to monetary values – Cost categories – Intangible benefits – Communication targets for final report – Other Influences/Issues during implementation – Comments 22
  • 23.
    Evaluation Planning • ProjectPlan – Major Milestones – Deliverables – Timelines – Flow 23
  • 24.
  • 25.
    THE ROI PROCESS Evaluation Planning Data Collection Level 1: Reaction, Level 3: Satisfaction, and Application/ Planned Actions Implementation Develop Develop Collect Collect Collect Collect Develop Develop Evaluation Evaluation Data During Data During Data After Data After Objectives of Objectives of Plans and Plans and Solution Solution Solution Solution Solution (s) Solution (s) Baseline Data Baseline Data Implementation Implementation Implementation Implementation Level 2: Level 4: Learning Business Impact 25
  • 26.
    Data Collection – Step 3 - During Program Method Level 1 Level 2 Surveys Questionnaires Observation Interviews Focus Groups Tests 26
  • 27.
    Survey/Questionnaire Design • Determine the specific information needed • Review with stakeholders • Select type(s) of questions • Keep simple • Develop the questions • Design for easy scoring • Develop administrative procedures • Address anonymity issue 27
  • 28.
    Survey/Questionnaire Design • Commonmistakes – Vague statements/questions – Too many questions – Improperly worded questions – Confusing instructions – Too difficult to analyze 28
  • 29.
    Data Collection Step 4 - Post Program Method Level 3 Level 4 • Surveys • Questionnaires • Observations on the job • Interviews • Focus Groups • Action planning/improvement plans • Performance contracting • Performance monitoring 29
  • 30.
    Action Plan PartI Name: (optional) _______________________________________ Company/Organization: (optional) __________________________ Job Title (optional): _____________________________________ Course Date: ___________________________________________ Specific Steps: I will do this End Result: So that 1. Action 1 2. Action 2 3. Action etc….. Expected Intangible Benefits: 30
  • 31.
    Action Plan PartII Name: (optional) _______________________________________ Company/Organization: (optional) __________________________ Job Title (optional): _____________________________________ Course Date: ___________________________________________ Analysis A. What is the unit of measure? Does this measure reflect your performance alone? B. What is the value? $________ C. How did you arrive at this value? D. How did this measure change during the last month of the evaluation period compared to the average before the program? E. What percent of the change was actually caused by the application of the course? F. What level of confidence do you place on the above information? 100%=certainty and 0%=No Confidence Actual Intangible Benefits: 31
  • 32.
  • 33.
    Tabulate Costs Tabulate Costs Data Analysis of Solution Reporting of Solution Convert Data Convert Data Calculate the Calculate the Generate Generate Isolate the Isolate the to Monetary to Monetary Return on Return on Impact Impact Effects Effects Value Value Investment Investment Study Study Level 5: ROI Identify Identify Intangible Intangible Measures Measures 33
  • 34.
    Step 5 -Isolating Methods • Isolation shows your contribution • Techniques used • Control groups • Trend line analysis • Forecasting methods • End user/performer’s, supervisor’s, and/or management’s estimate of impact (percent) • Use of experts/previous studies • Subordinate’s input of program impact • Calculate/Estimate the impact of other factors • Customer input 34
  • 35.
    Schedule Delays 100% Percent of Project on Schedule PM Implementation Actual Average 94.4% 95% 90% Pre Program Average Average of Trend Projected 92.3% 87.3% on 85% Pr o jecti d Tren J F M A M J J A S O N D J Months 35
  • 36.
    Example of aParticipant’s Estimation Adjusted Factor that Percent of Confidence Percent of Influenced Improvement Expressed as a Improvement Improvement Caused By Percent Caused By Project 60% 80% 48% Management System Changes 15% 70% 10.5% Market Changes 5% 60% 3% Process Changes 20% 80% 16% Total 100% 36
  • 37.
    Step 6 – Converting Data to Monetary Value • Challenging • Use data bases • Look at past project performance • Look at profits / savings from output • Historical costs / savings • Experts input • End user input • Staff estimation 37
  • 38.
    Example of ConvertingData Using External Database Cost of PMP Certified Consultant* Non –certified PM $120/hr = $240k annually Certified PM $180/hr = $360k annually Cost for PMP 150% increase in billable rate * External data - value obtained from industry professionals 38
  • 39.
    Example of ConvertingData Using Historical Records & Expert Input The Cost of a Schedule delay Actual Costs Reworks, Penalties, from Records Loss Revenue 35 $852,000 Days Estimated Project Staff Time, Additional from Staff Management Time 39
  • 40.
    Example of ConvertingData Using Historical Records & Expert Input The Cost of a schedule delay $852,000 Per Day / 35 Days = $24k per day 40
  • 41.
    Co Step 7 - Intangible Benefits mp lai nt s Teamwork Con f li c t s Commitment Stress act ion e nt tisf ag em Sa E ng Job Customer Service 41
  • 42.
    Step 8 -Tabulating Costs • Consider all costs • Analysis costs • Planning costs • PM costs • Monitoring and control costs • Operating/maintenance costs • Evaluation costs 42
  • 43.
    Tabulating Costs • Recommended items • Needs assessment •Travel/lodging/meals • Development costs •Participants’ time • Program materials •Project Management costs • Training costs •Operations overhead • Consulting costs •Evaluation costs 43
  • 44.
    Tabulating Program Costs Direct Indirect • Program Materials • Needs Assessment • Methodology • Program Development • Training Costs • Participant Time • Facilities • Administrative Overhead • Travel • Evaluation 44
  • 45.
    Step 9 -Calculating ROI Benefits/Cost Monetary Benefits Ratio = Program Costs Net Monetary Benefits X 100 ROI = Program Costs 45
  • 46.
    ROI Example Costs forproject $80,000 Benefits from project $240,000 $240,000 = 3.0 BCR = $80,000 $160,000 ROI = x 100 = 200 % $80,000 46
  • 47.
  • 48.
    Tabulate Costs Tabulate Costs Data Analysis of Solution Reporting of Solution Convert Data Convert Data Calculate the Calculate the Generate Generate Isolate the Isolate the to Monetary to Monetary Return on Return on Impact Impact Effects Effects Value Value Investment Investment Study Study Level 5: ROI Identify Identify Intangible Intangible Measures Measures 48
  • 49.
    Step 10 -ROI Impact Study • Complete report • General information • Methodology • Data analysis • Costs • Results • Barriers and enablers • Summary of findings • Conclusions and recommendations • Exhibits - attachments 49
  • 50.
    How do youget started with ROI? • Develop an evaluation strategy • Build capability – Training – Publications – ROI Certification • Conduct an ROI Study • Revise policies and procedures 50
  • 51.
    Summary • Identified whyyou need to measure the value of project management • Introduced the ROI Methodology • Explained the benefits of implementing the ROI Methodology in your organization 51
  • 52.
    Contact Information • WayneBrantley – Villanova University • 1-800-874-7877, ext. 509 • Wayne.Brantley@VillanovaU.com 52