Downloaded 13 times
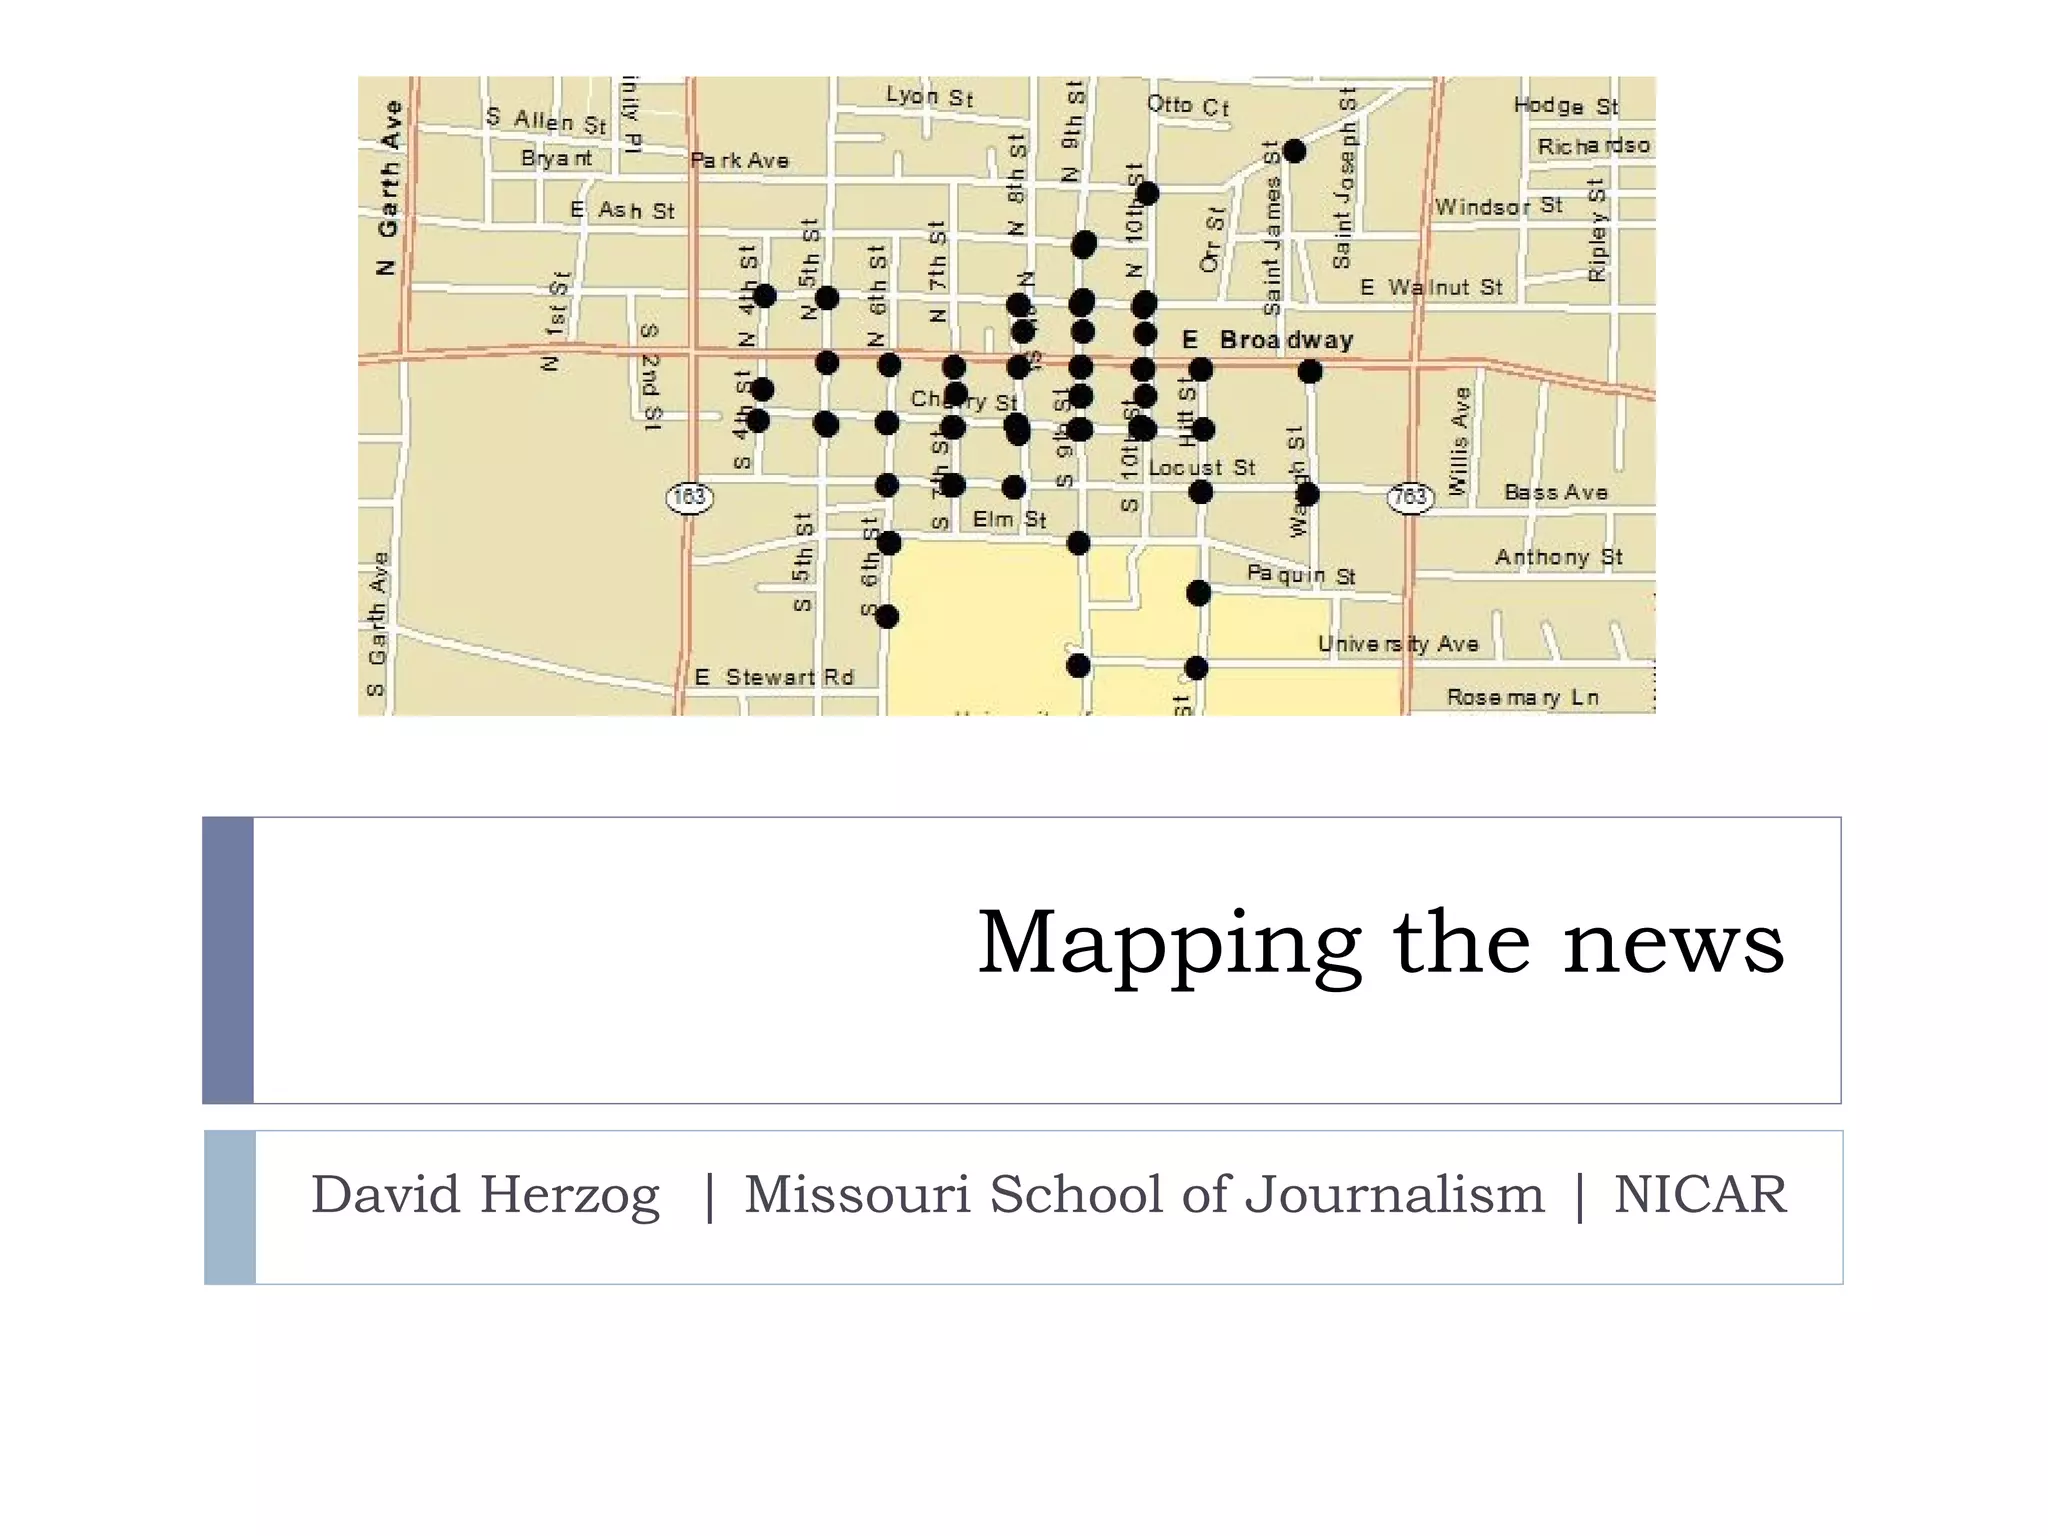
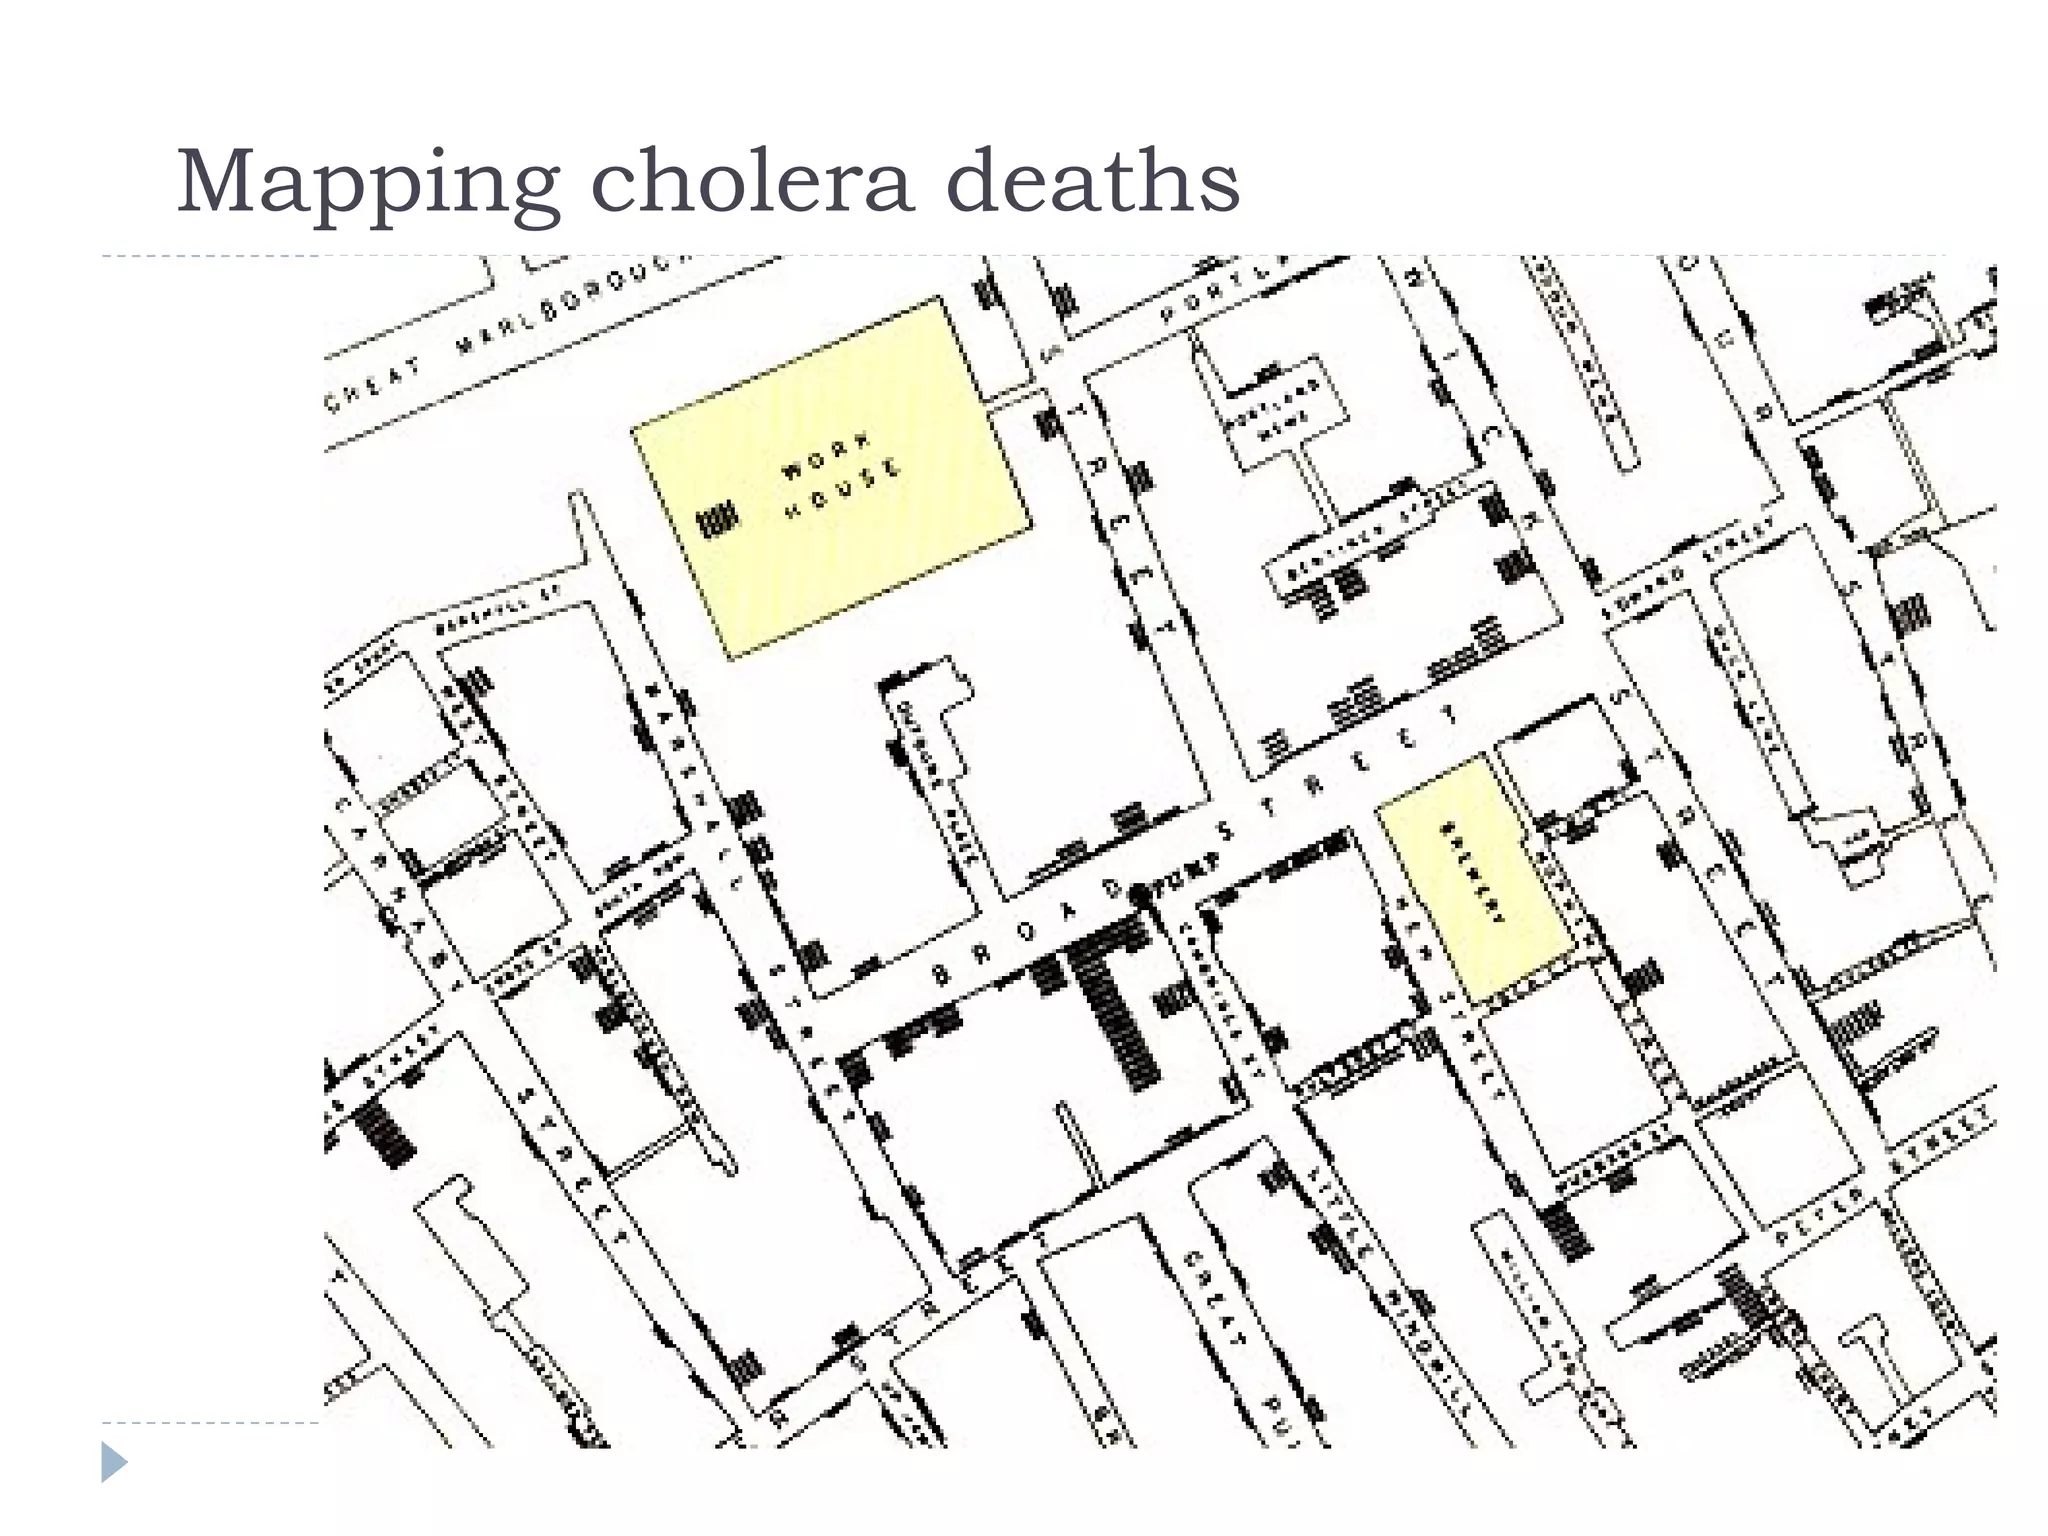
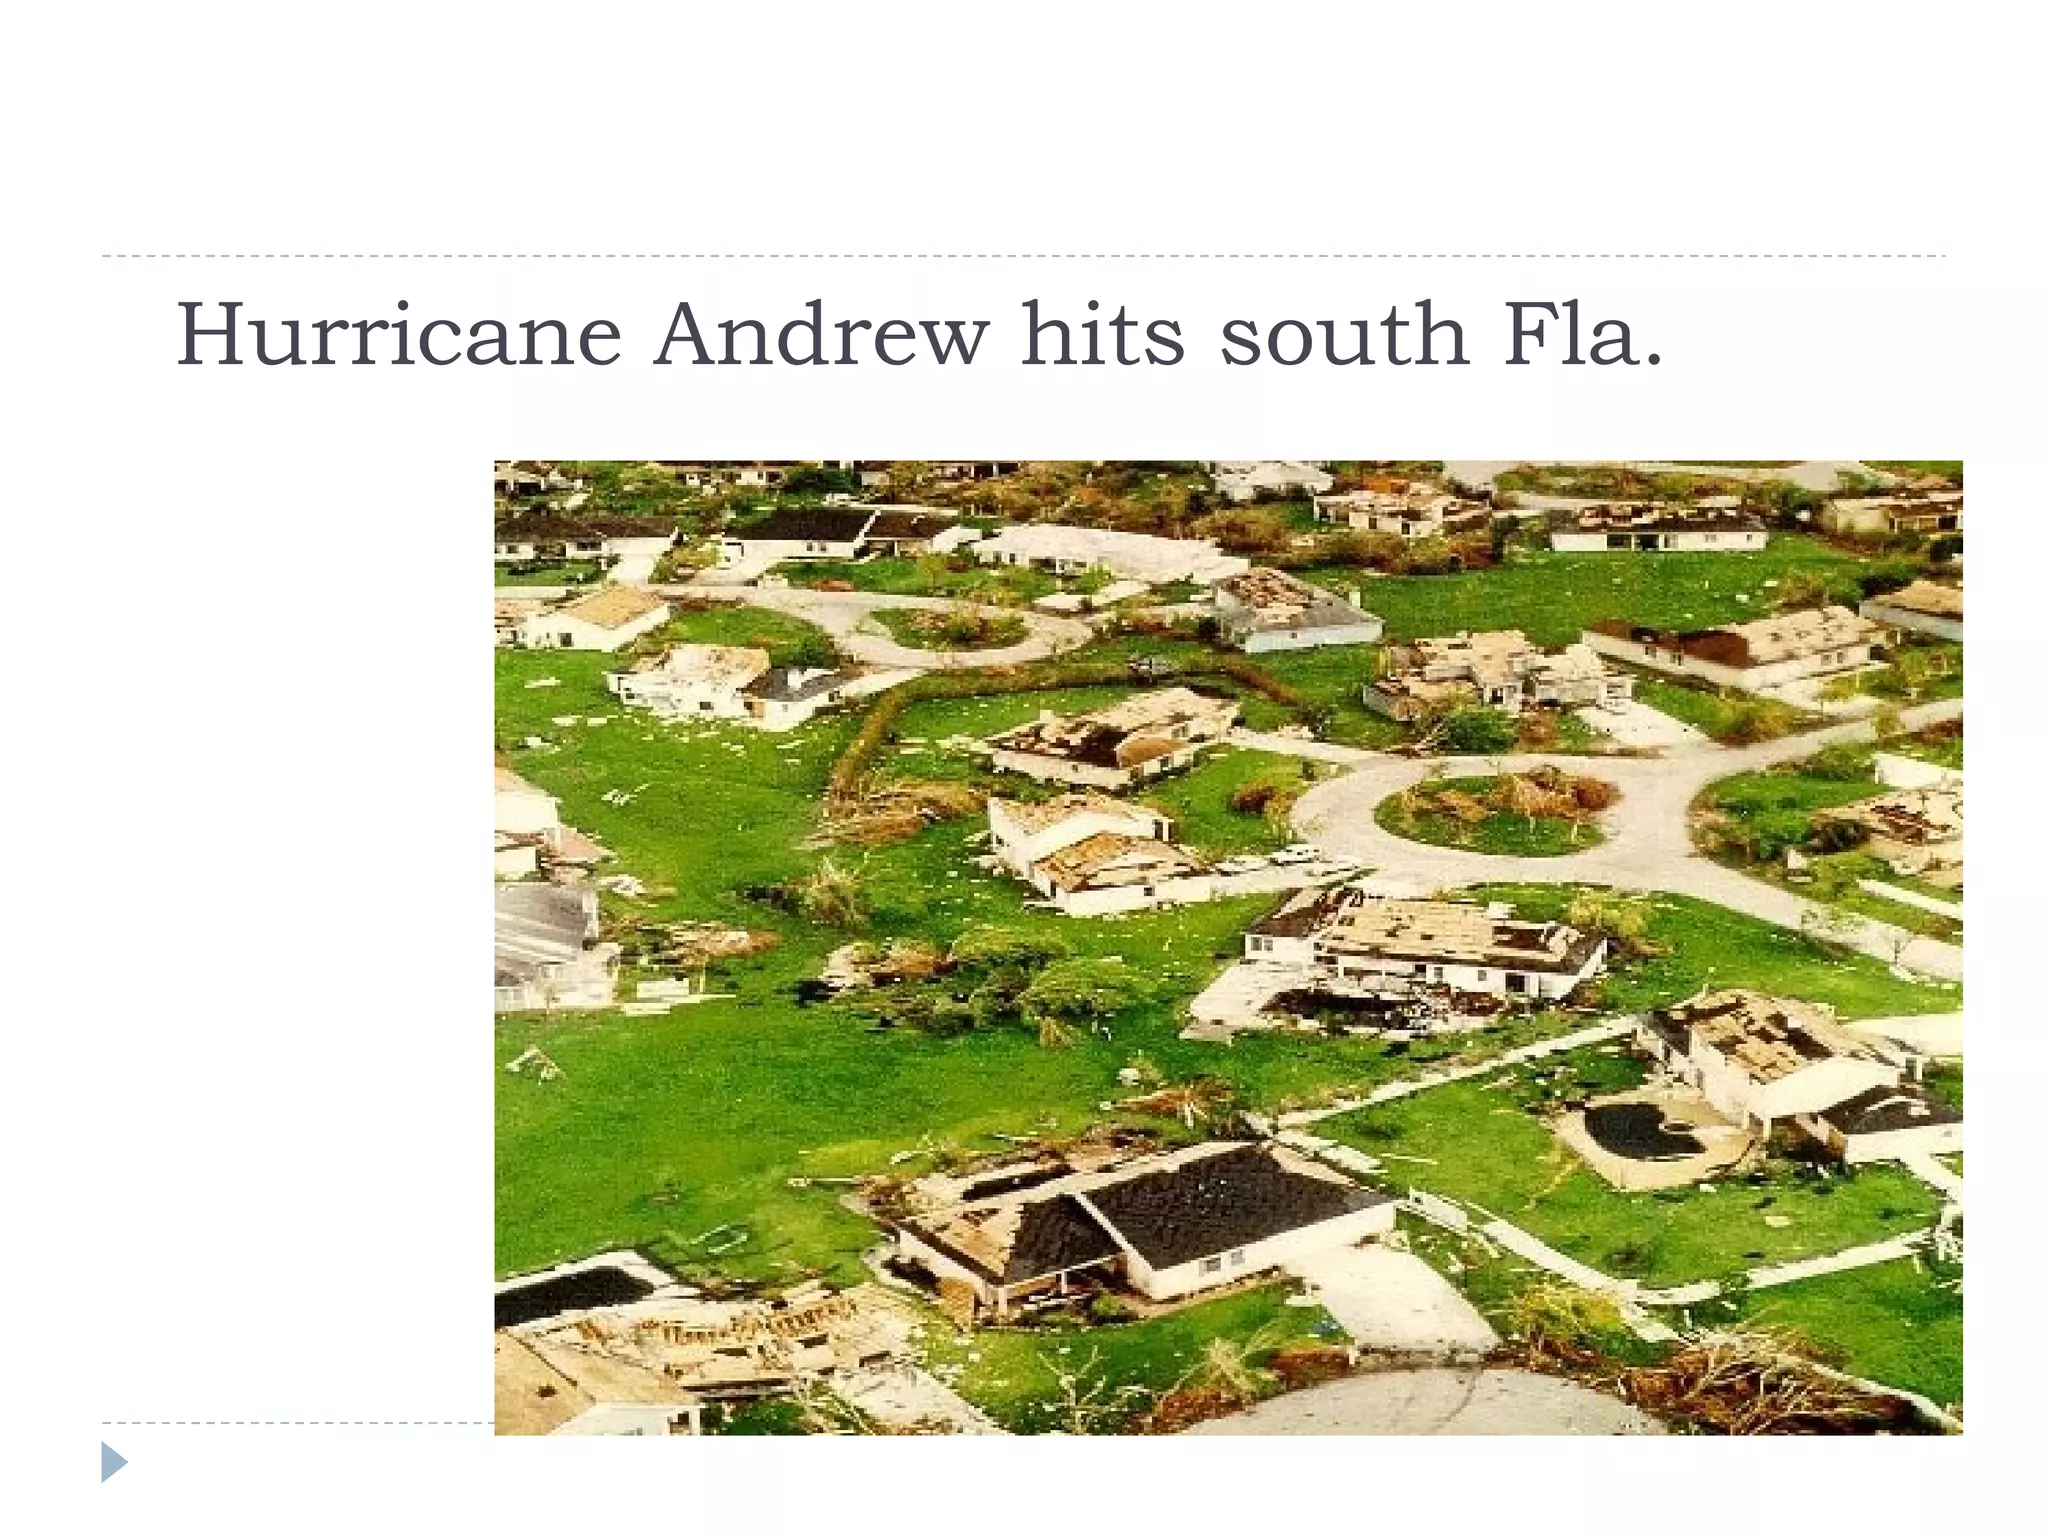
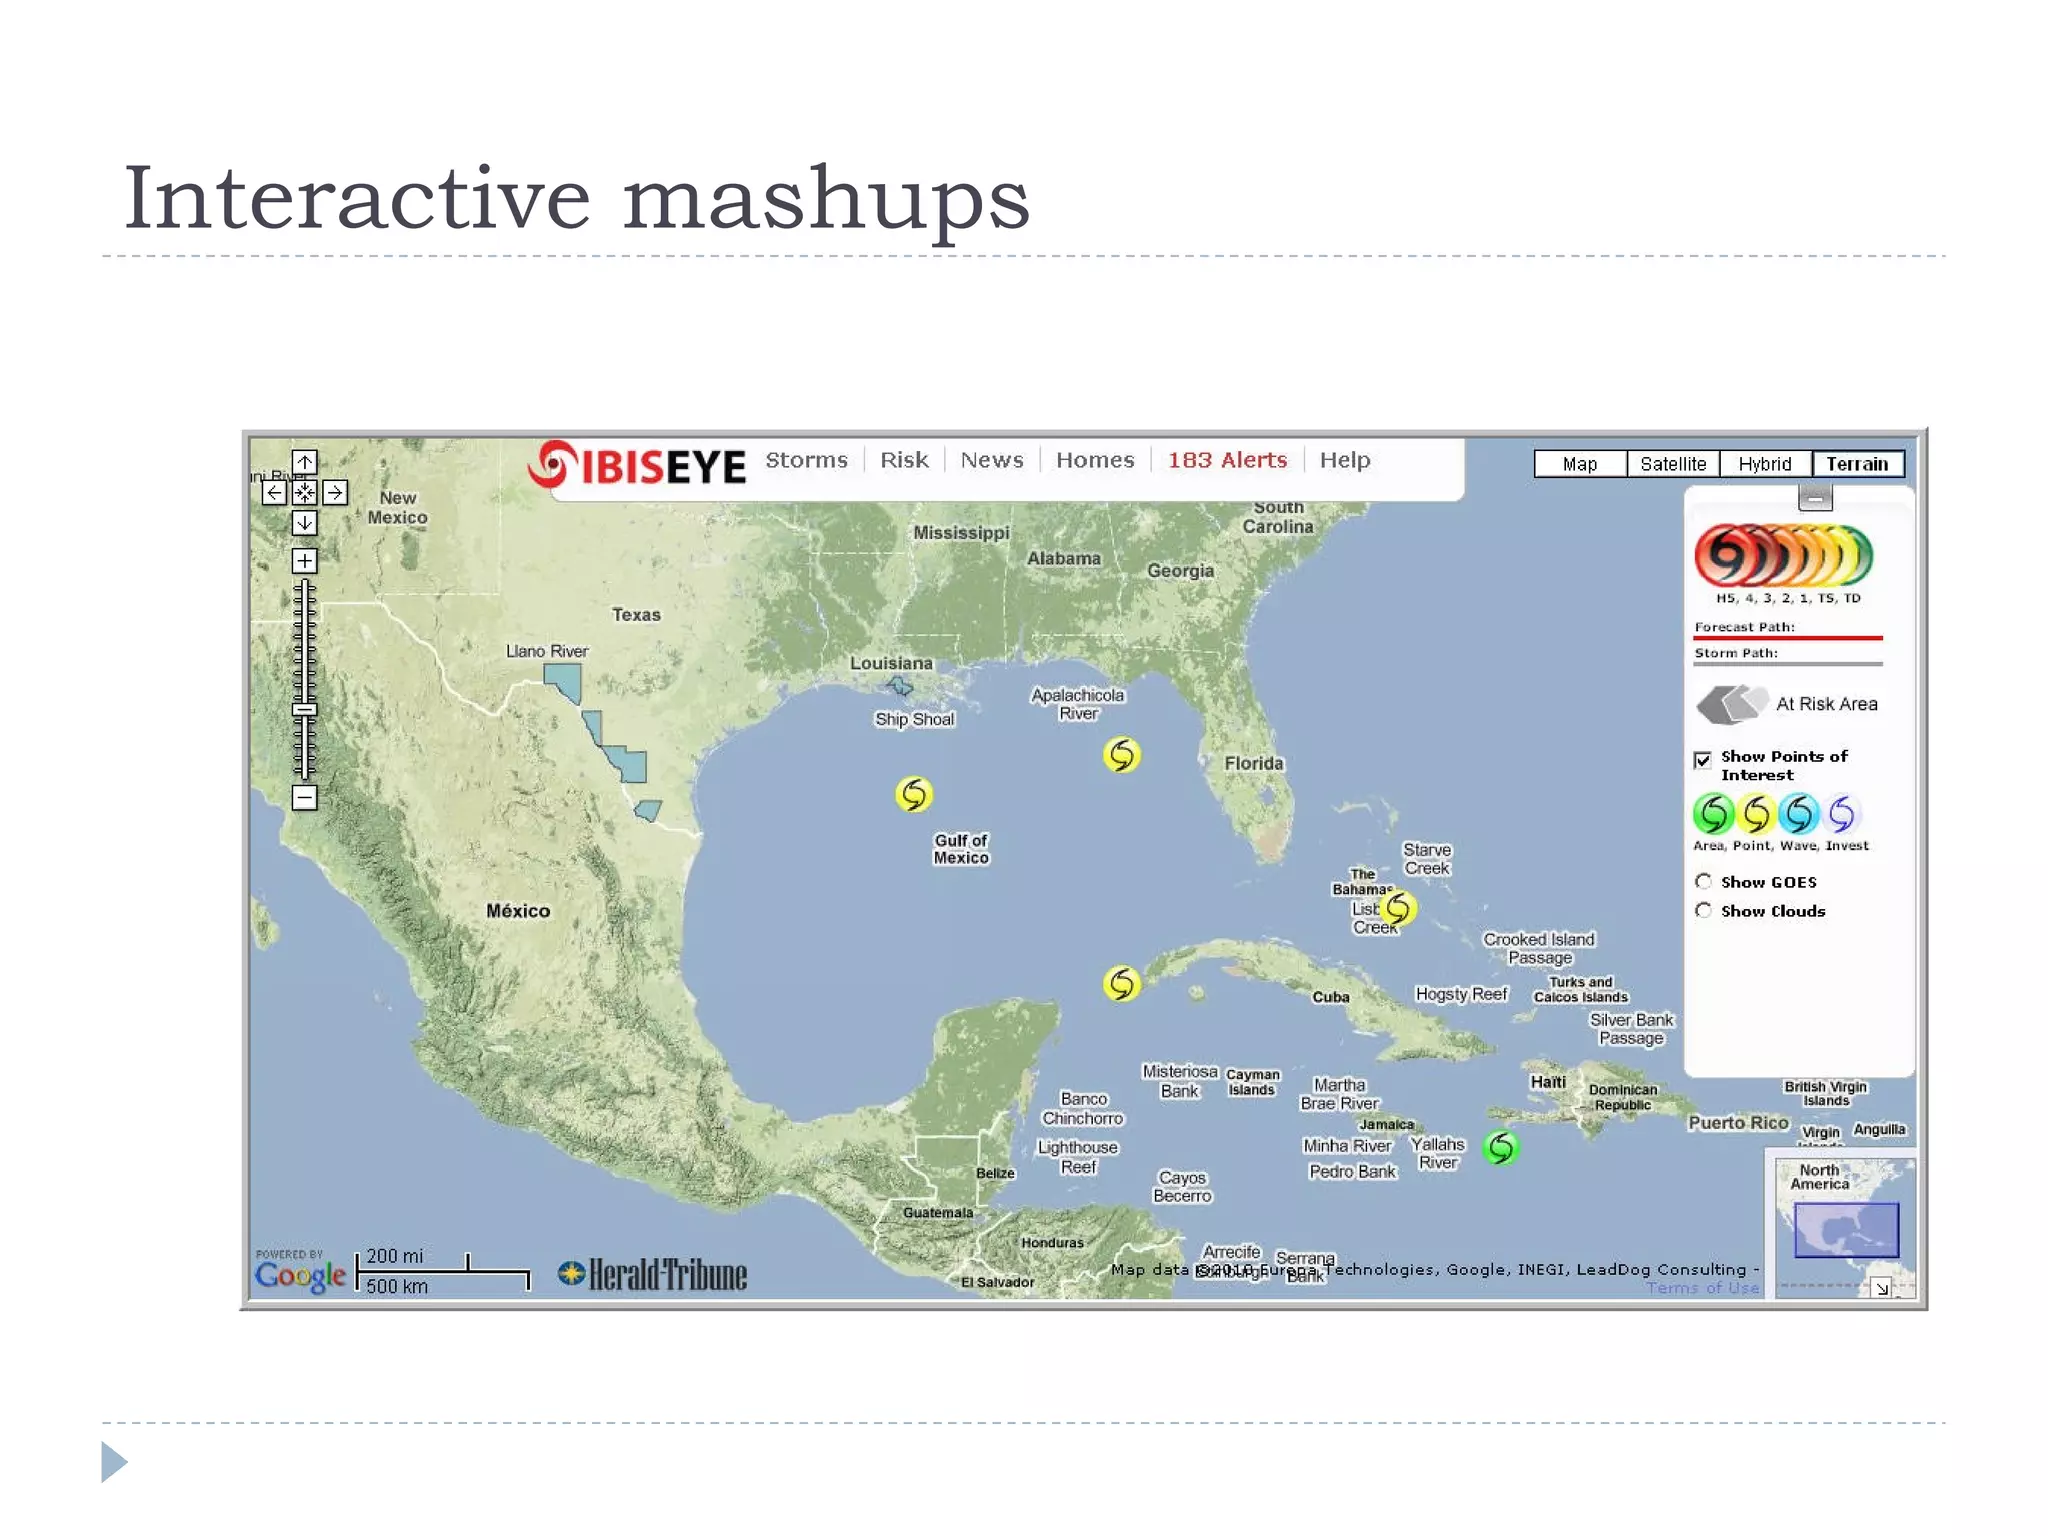
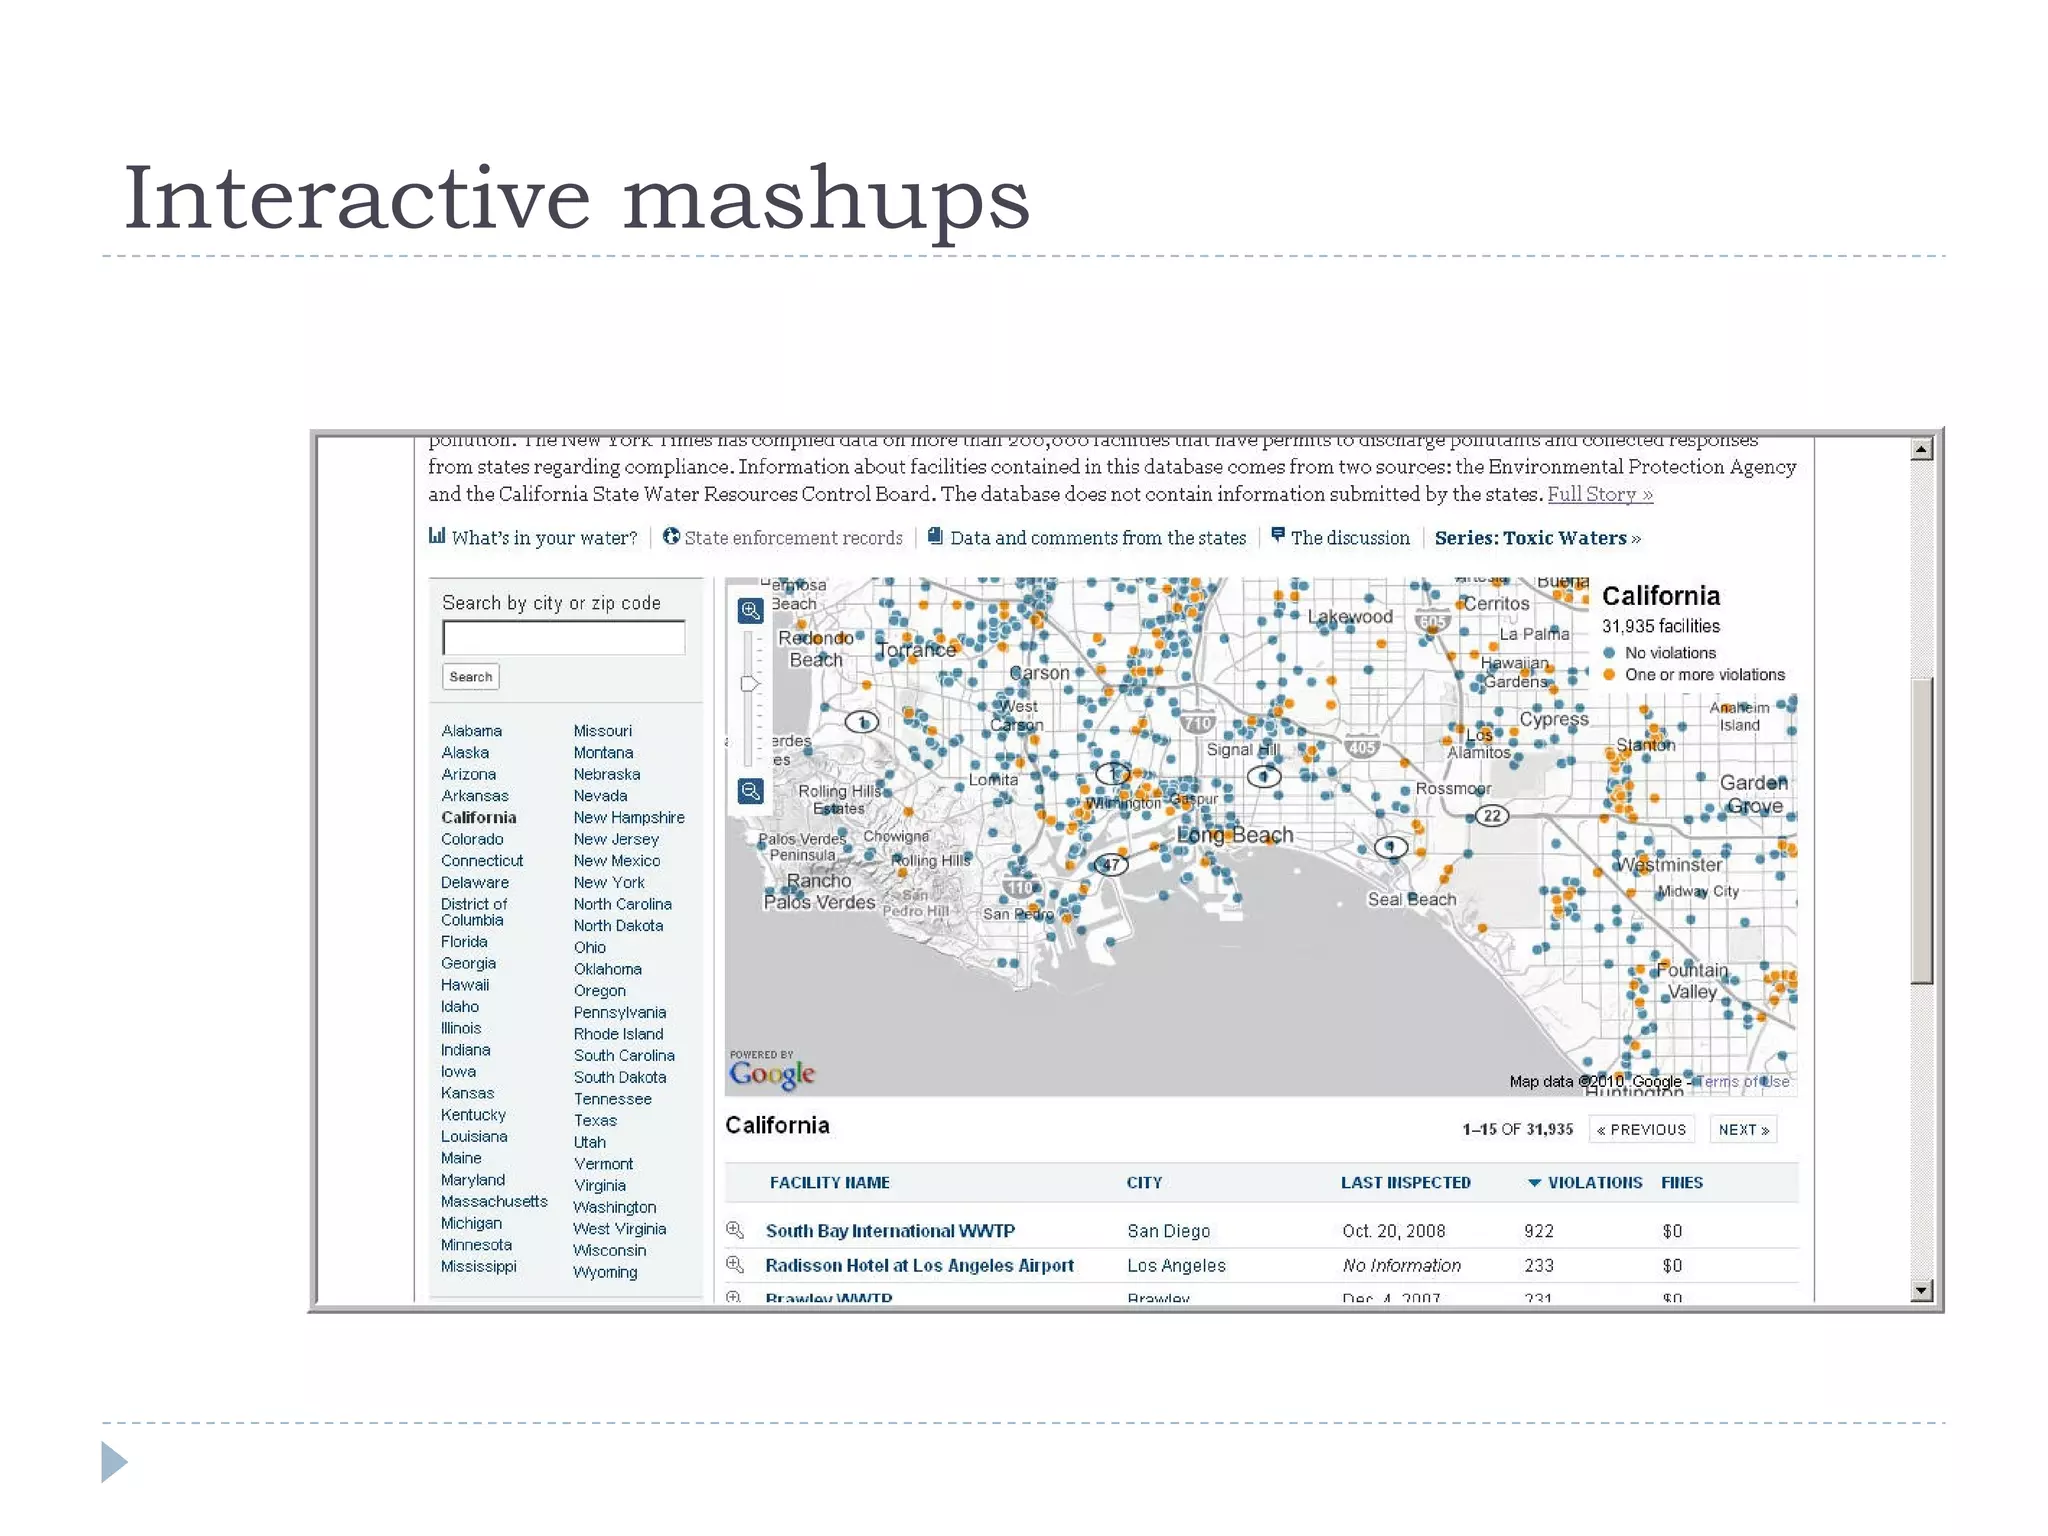
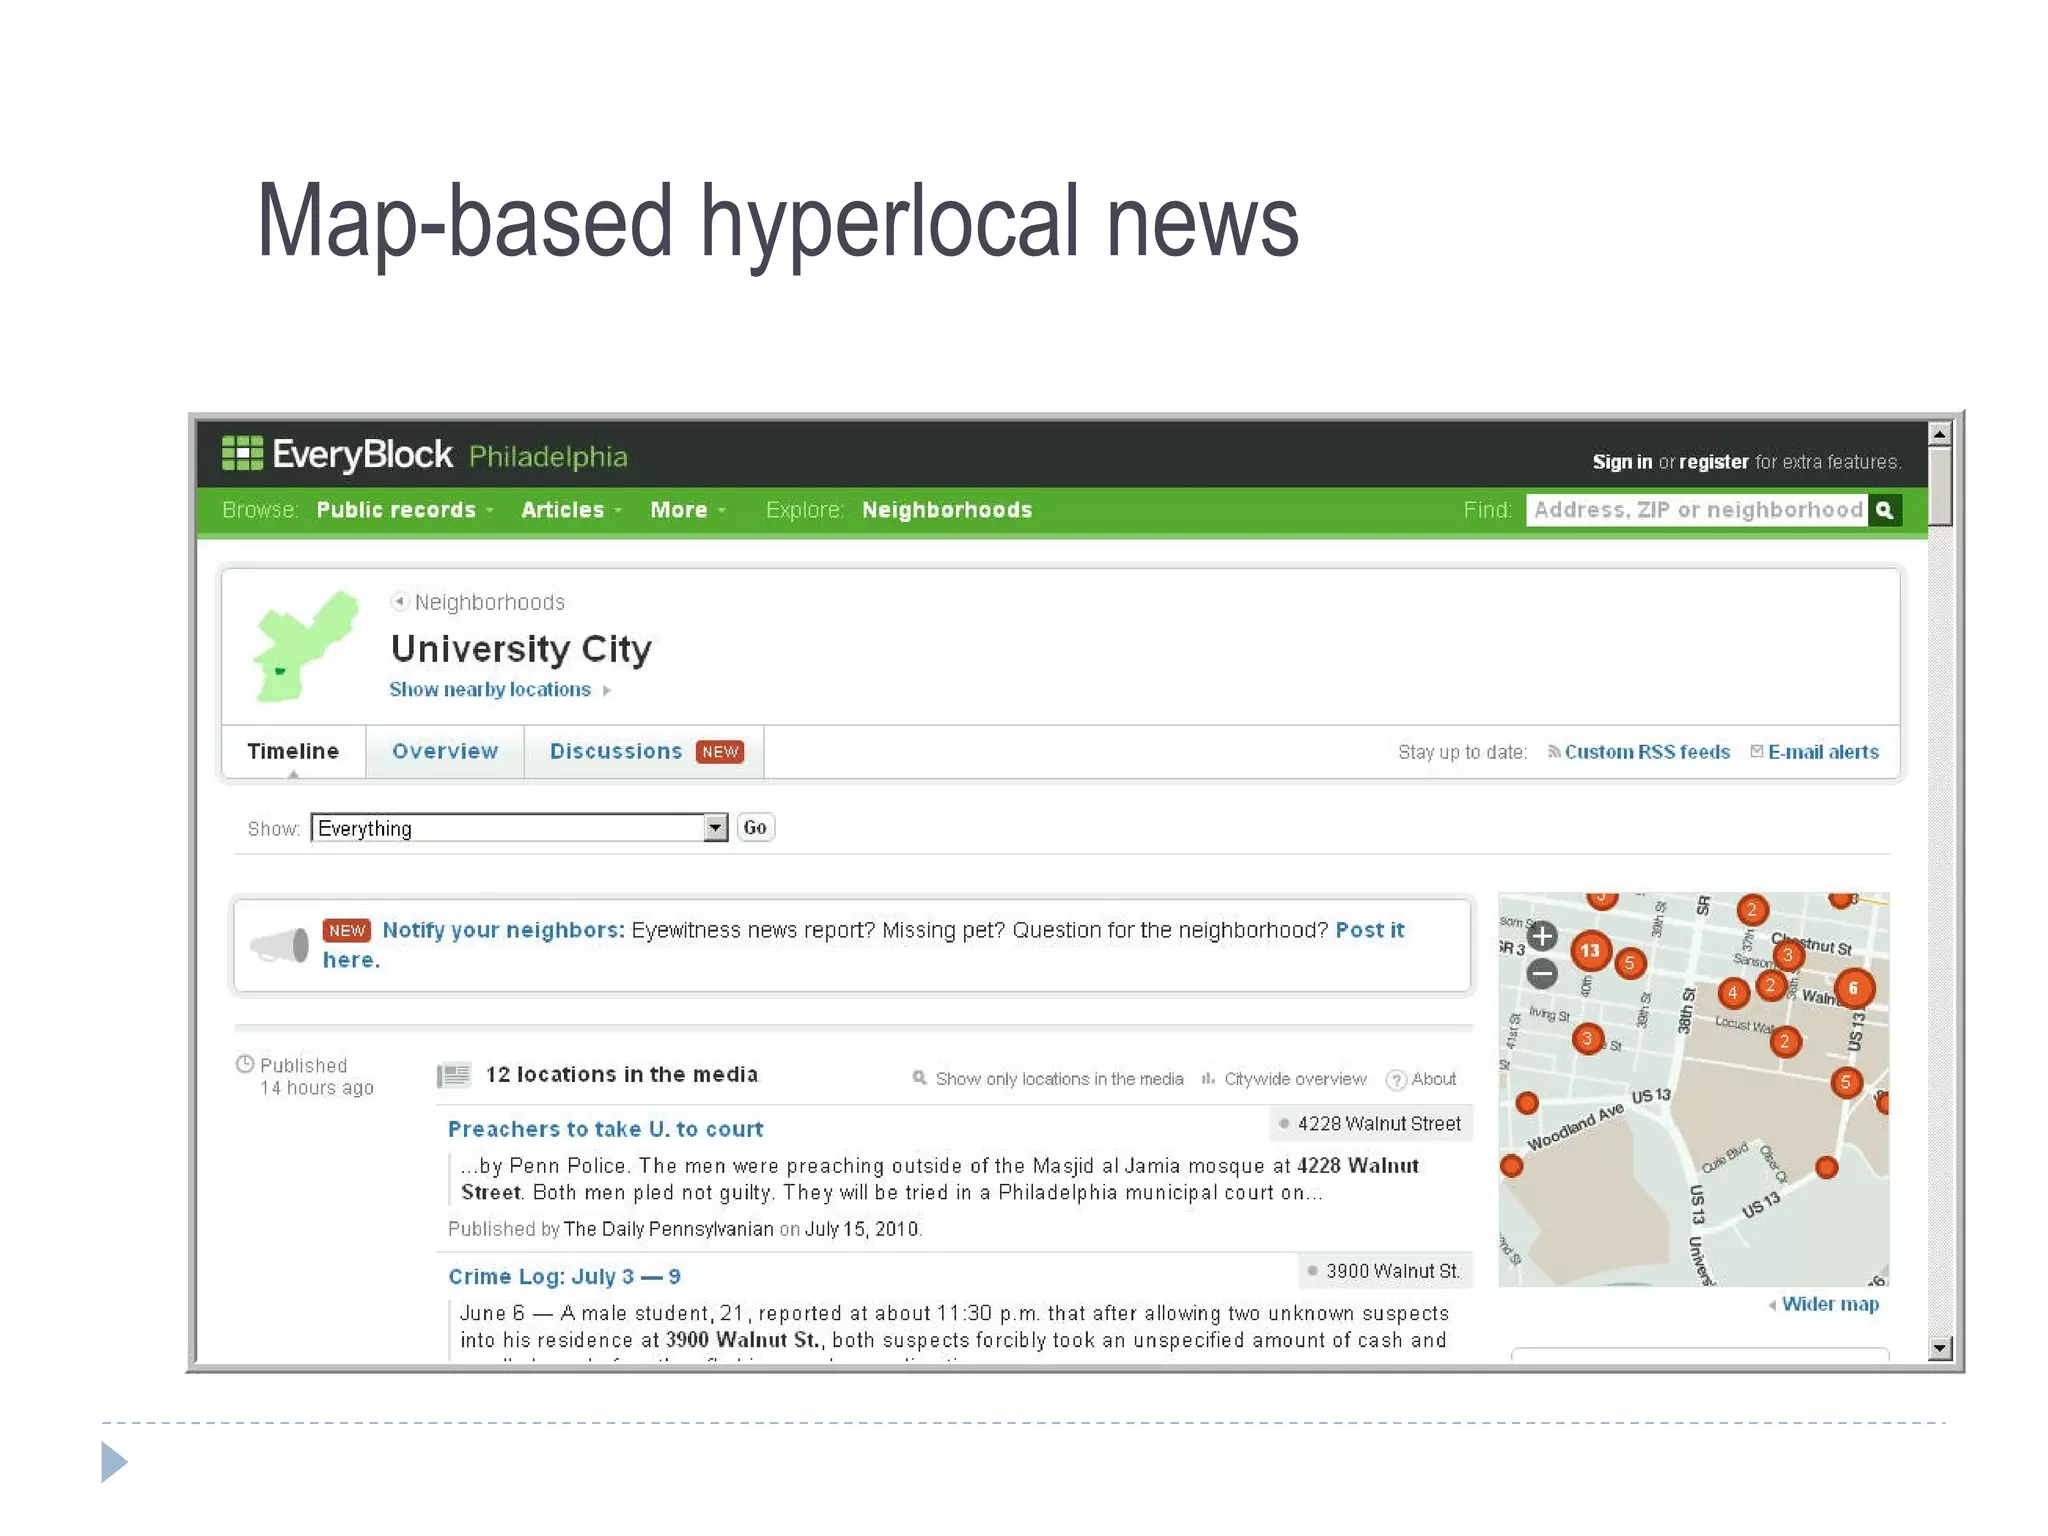
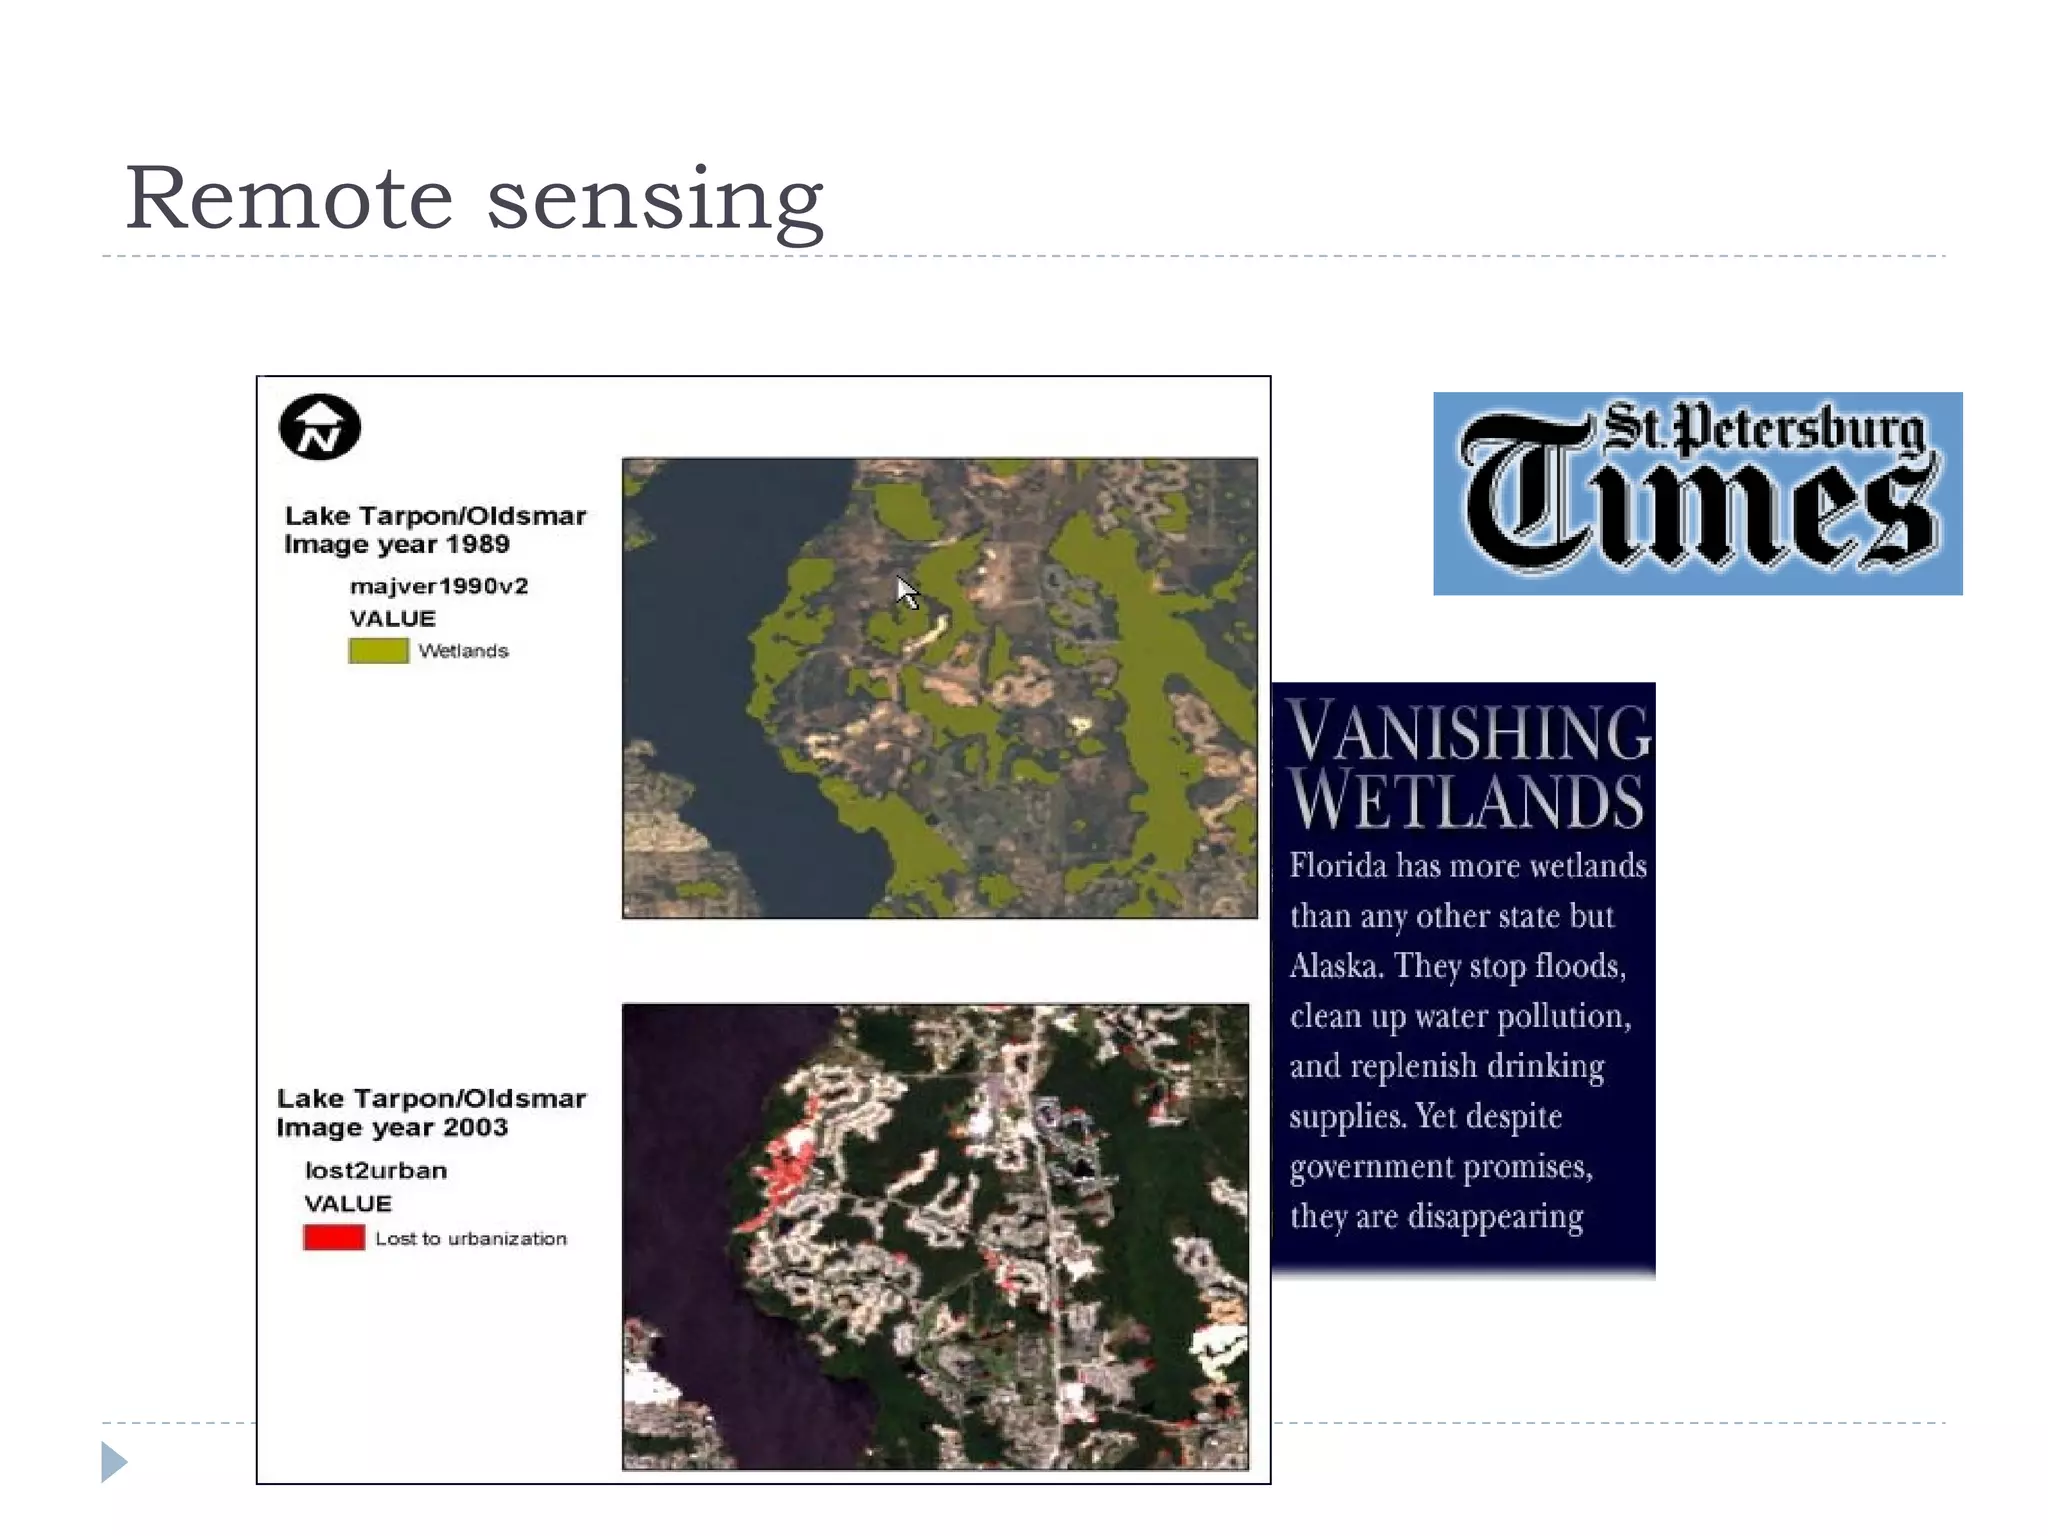
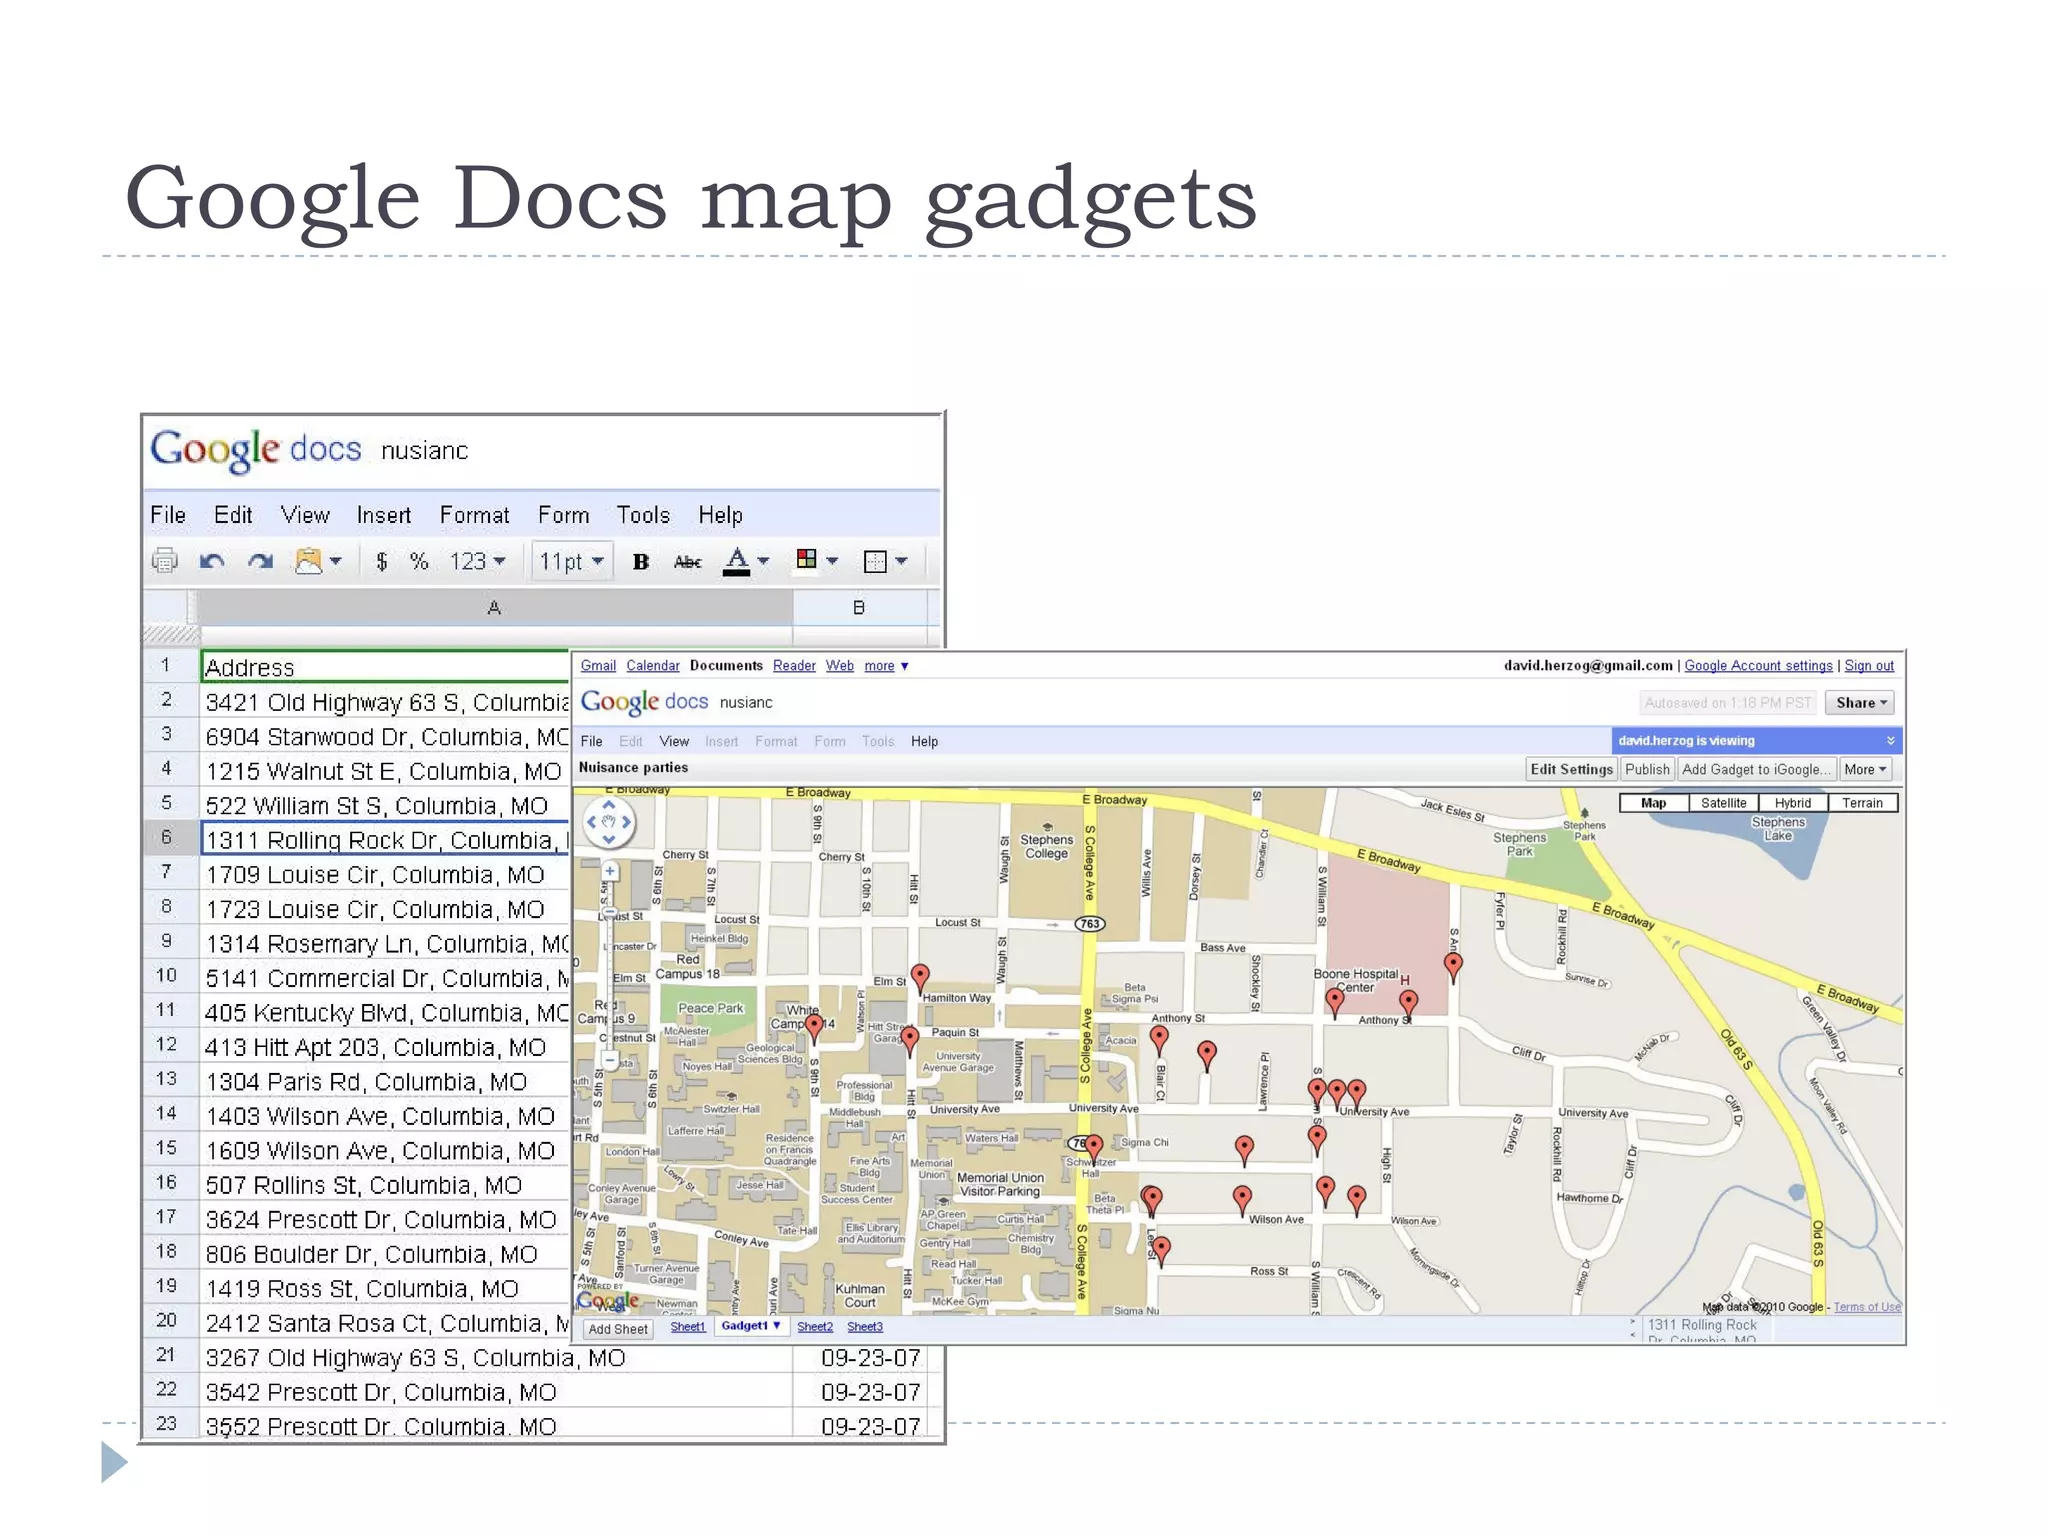
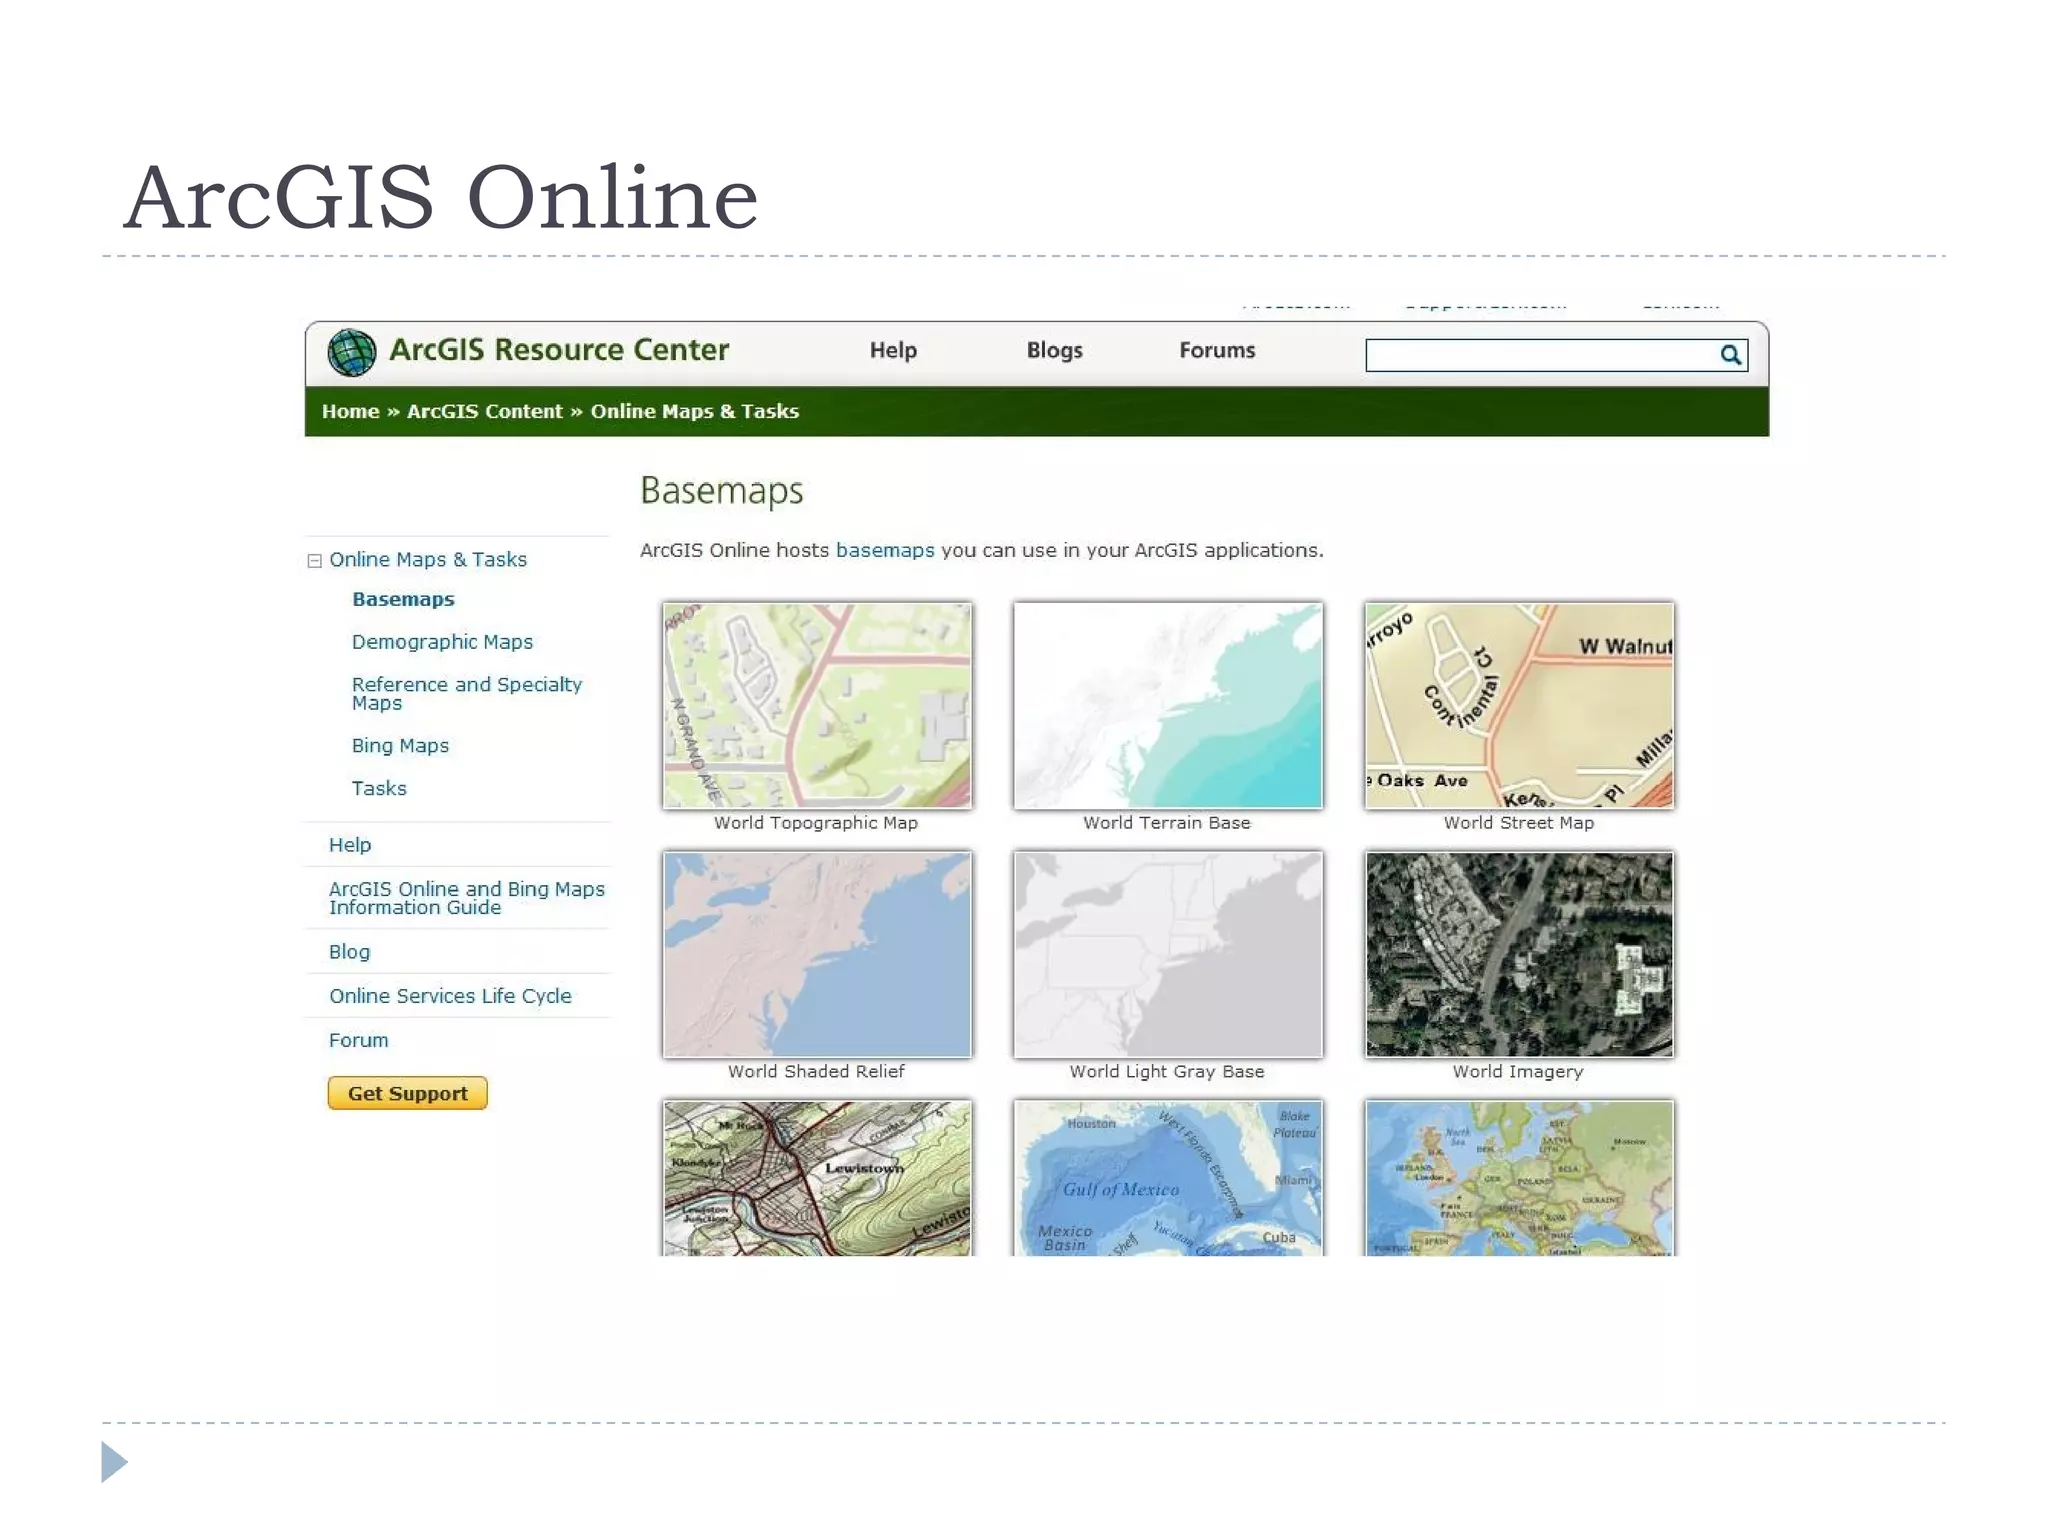
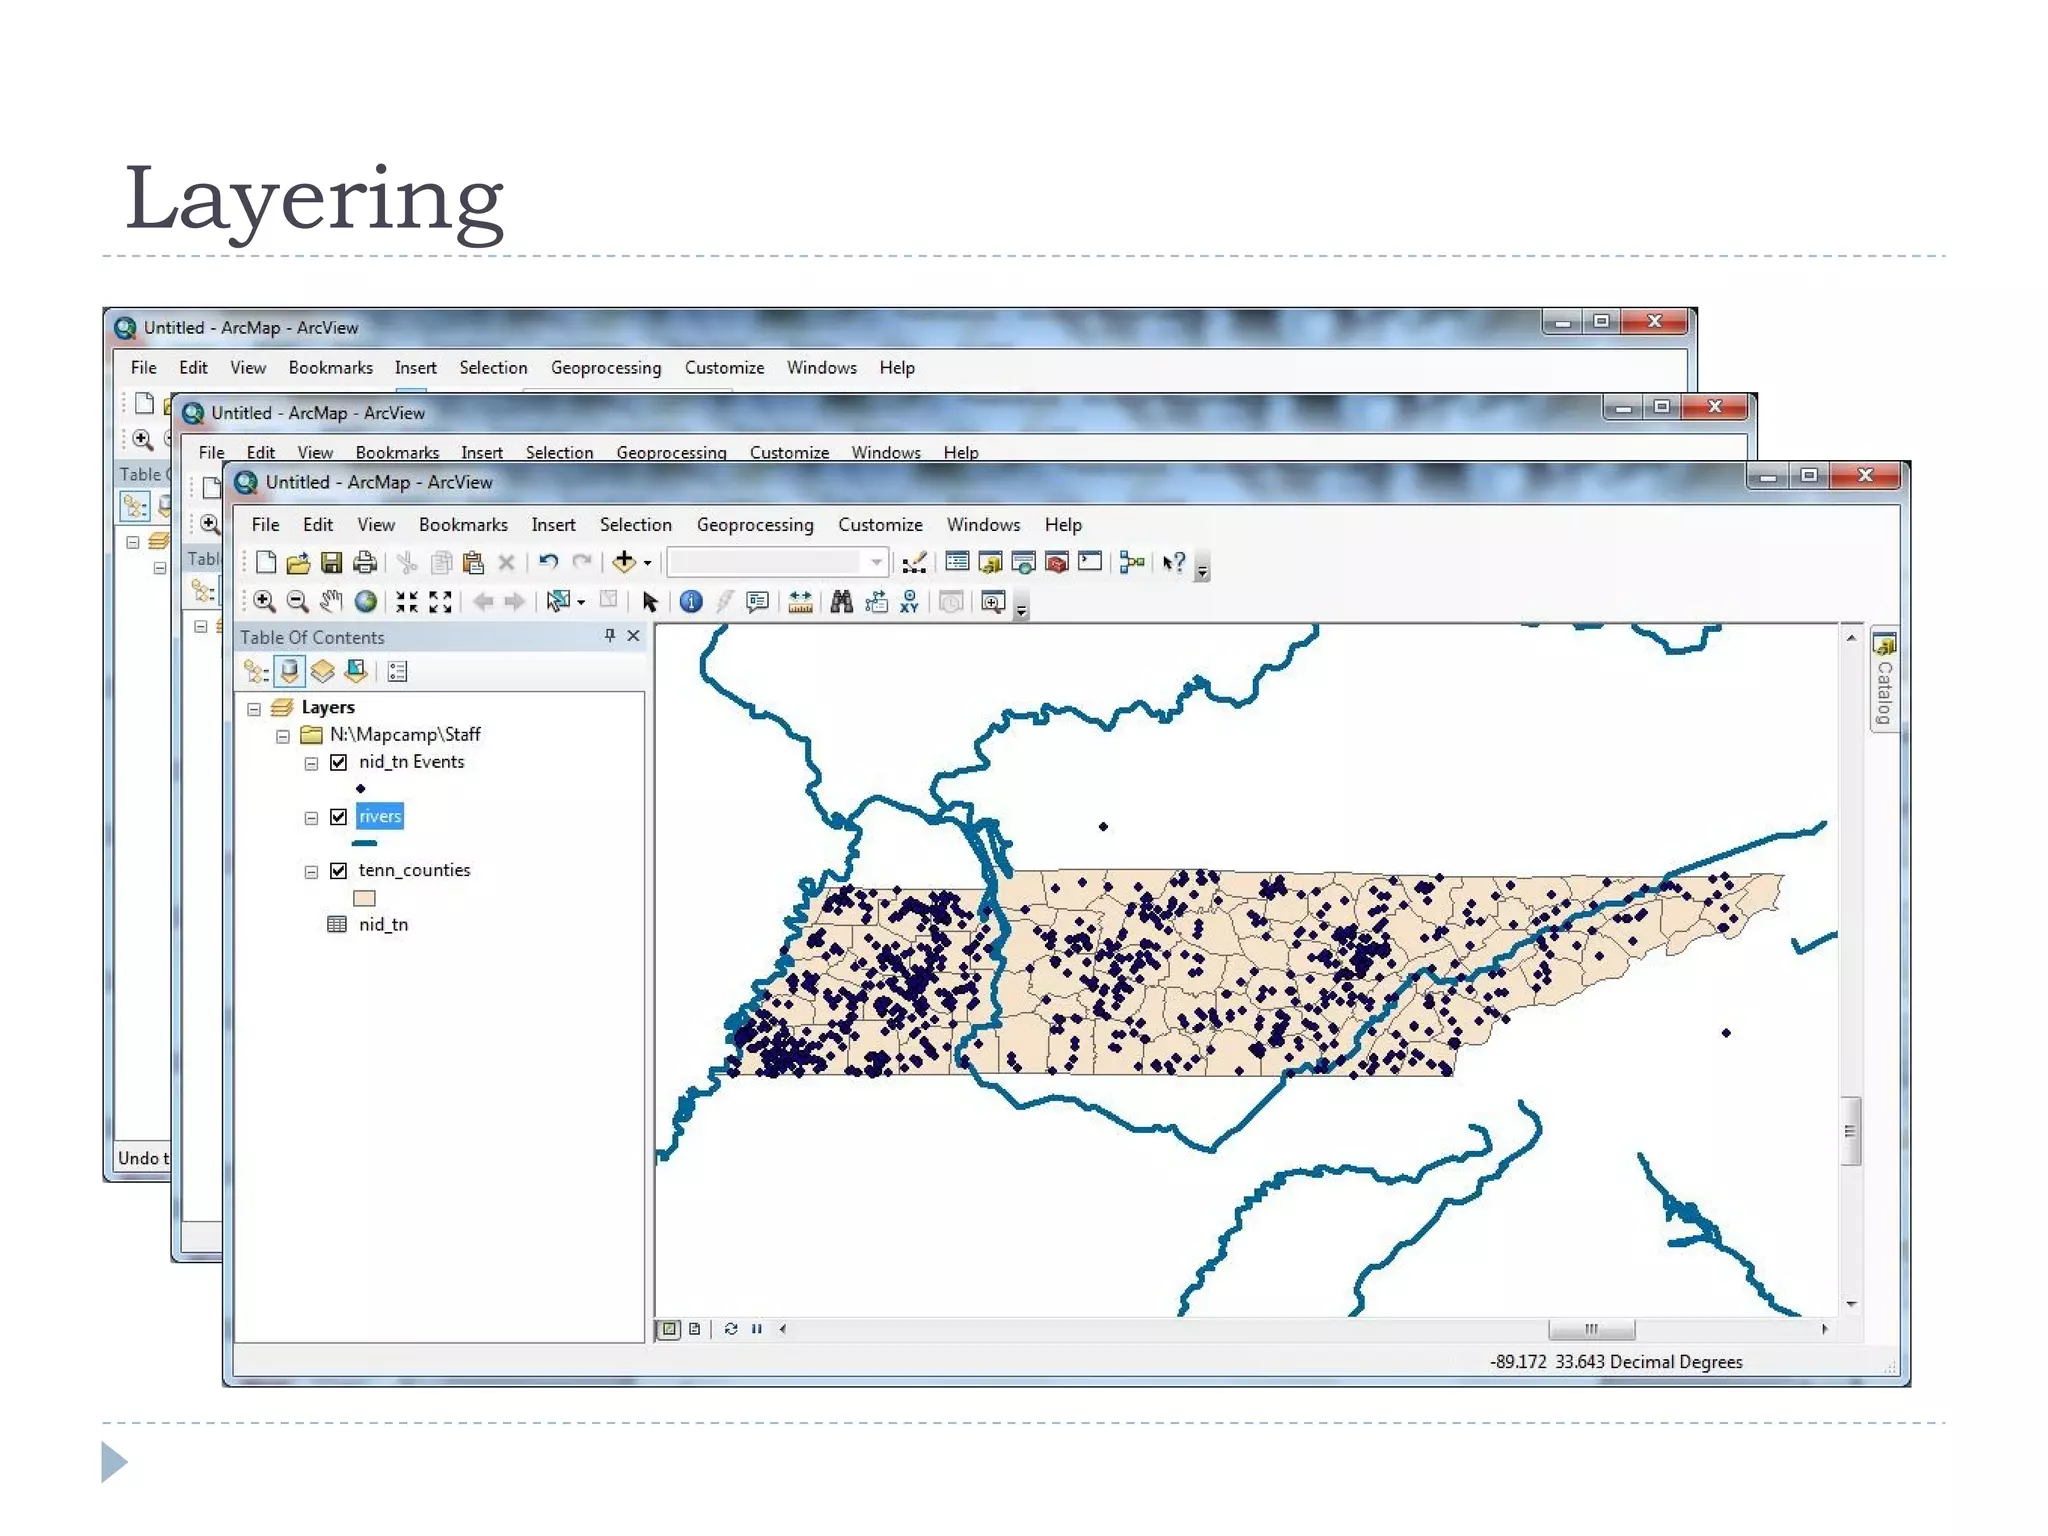
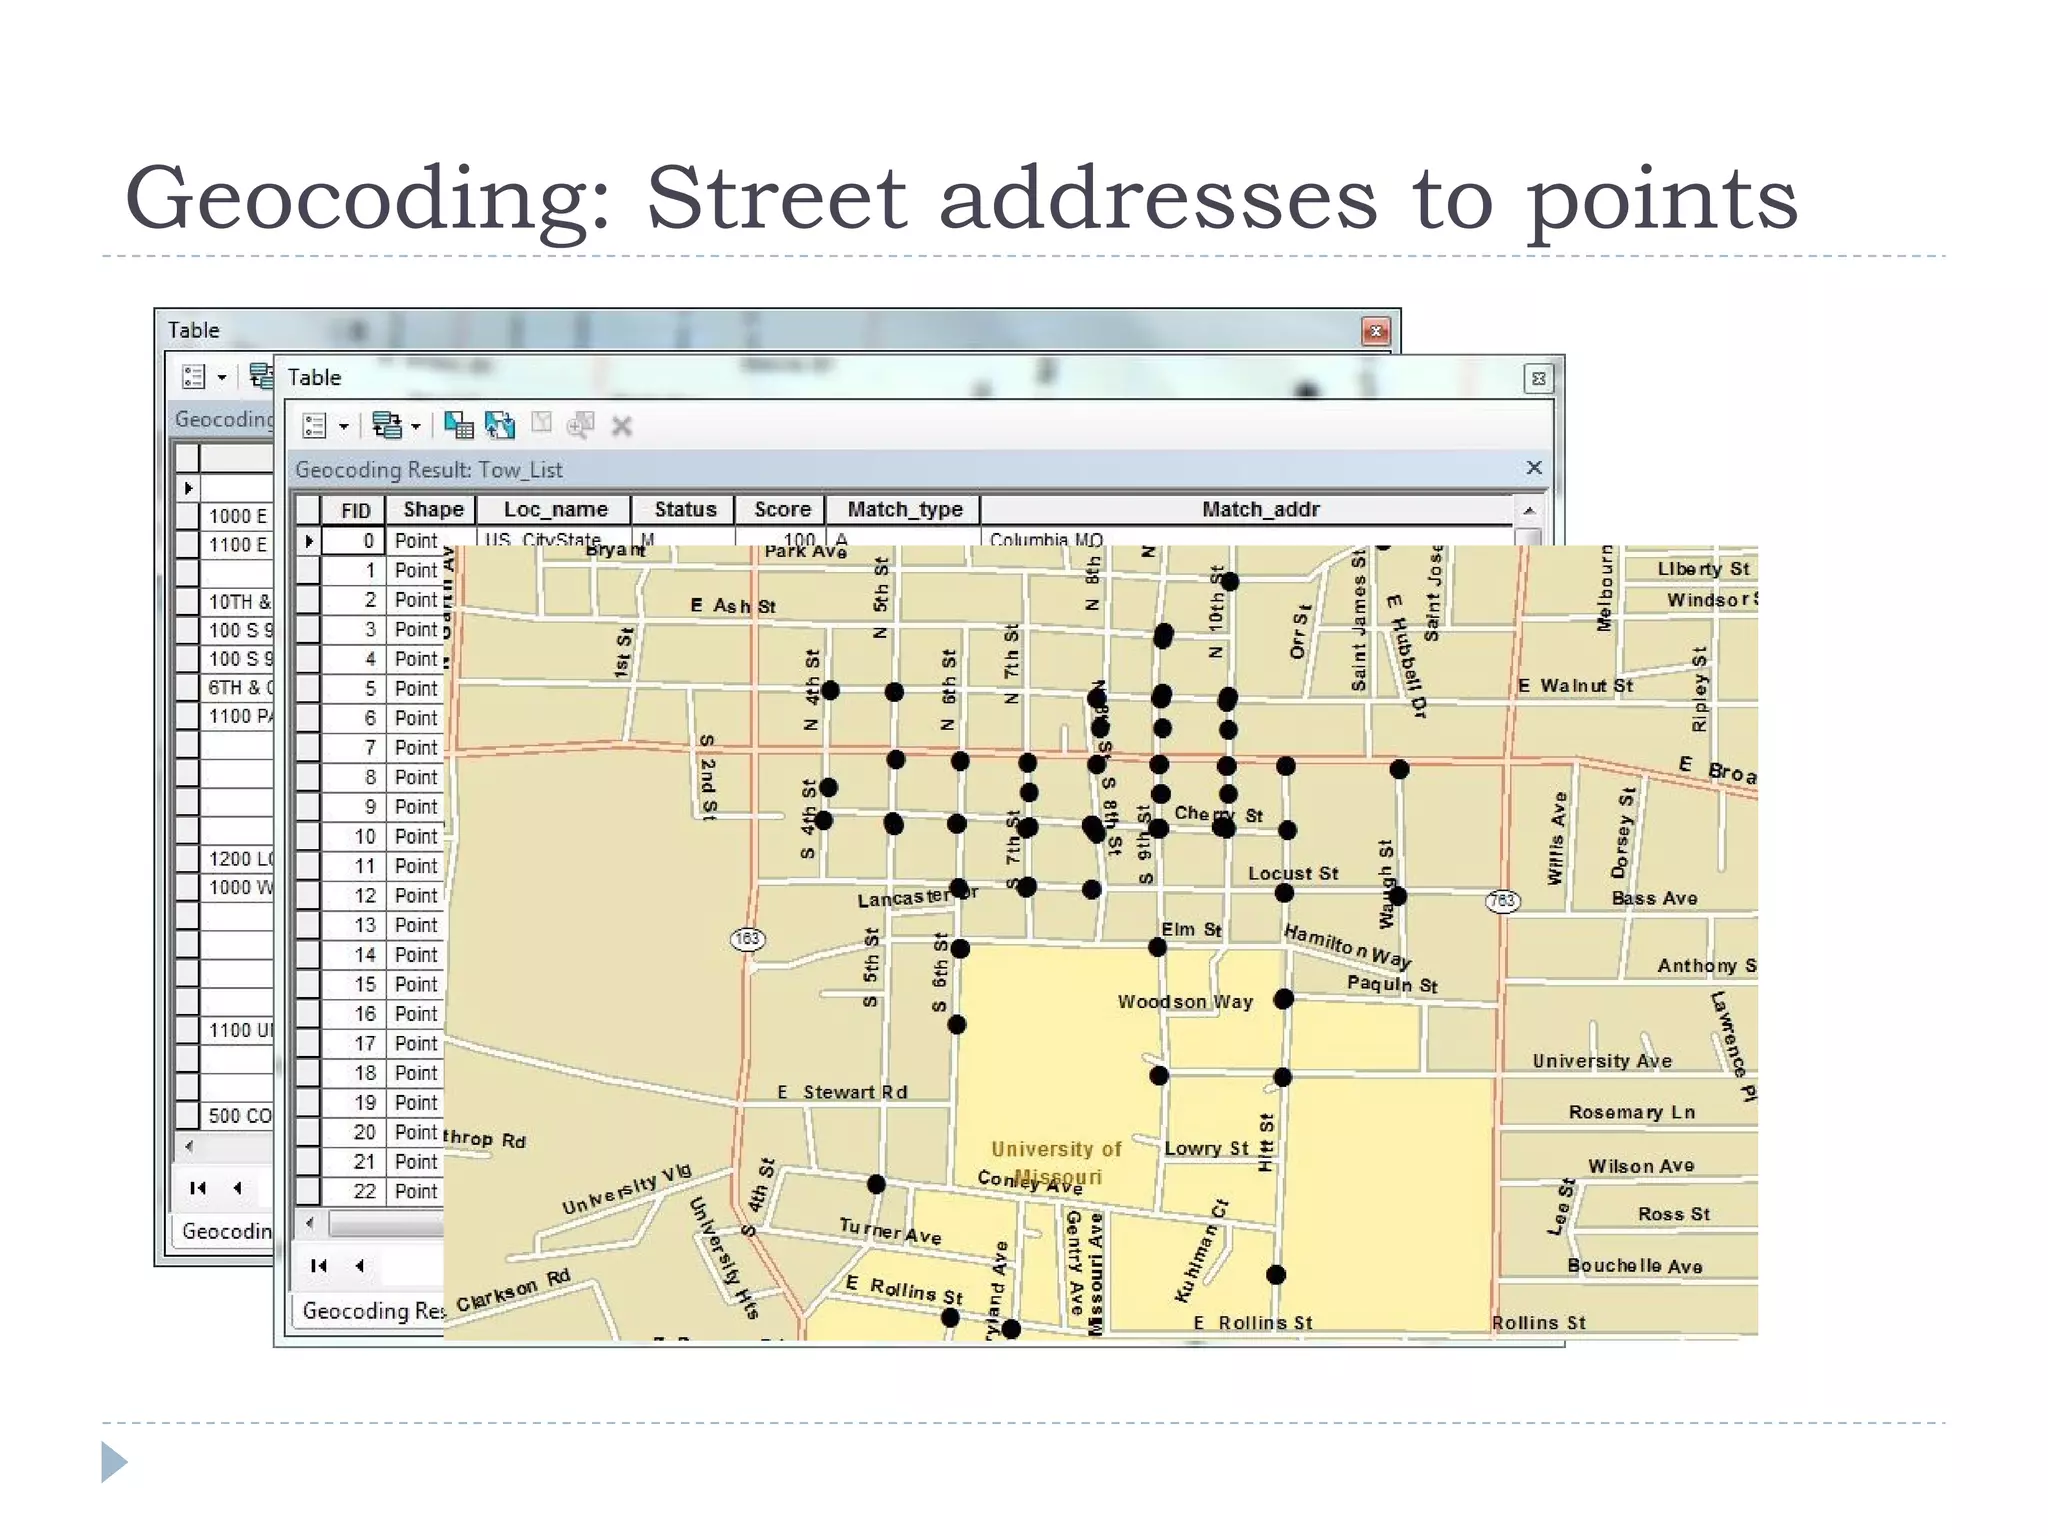
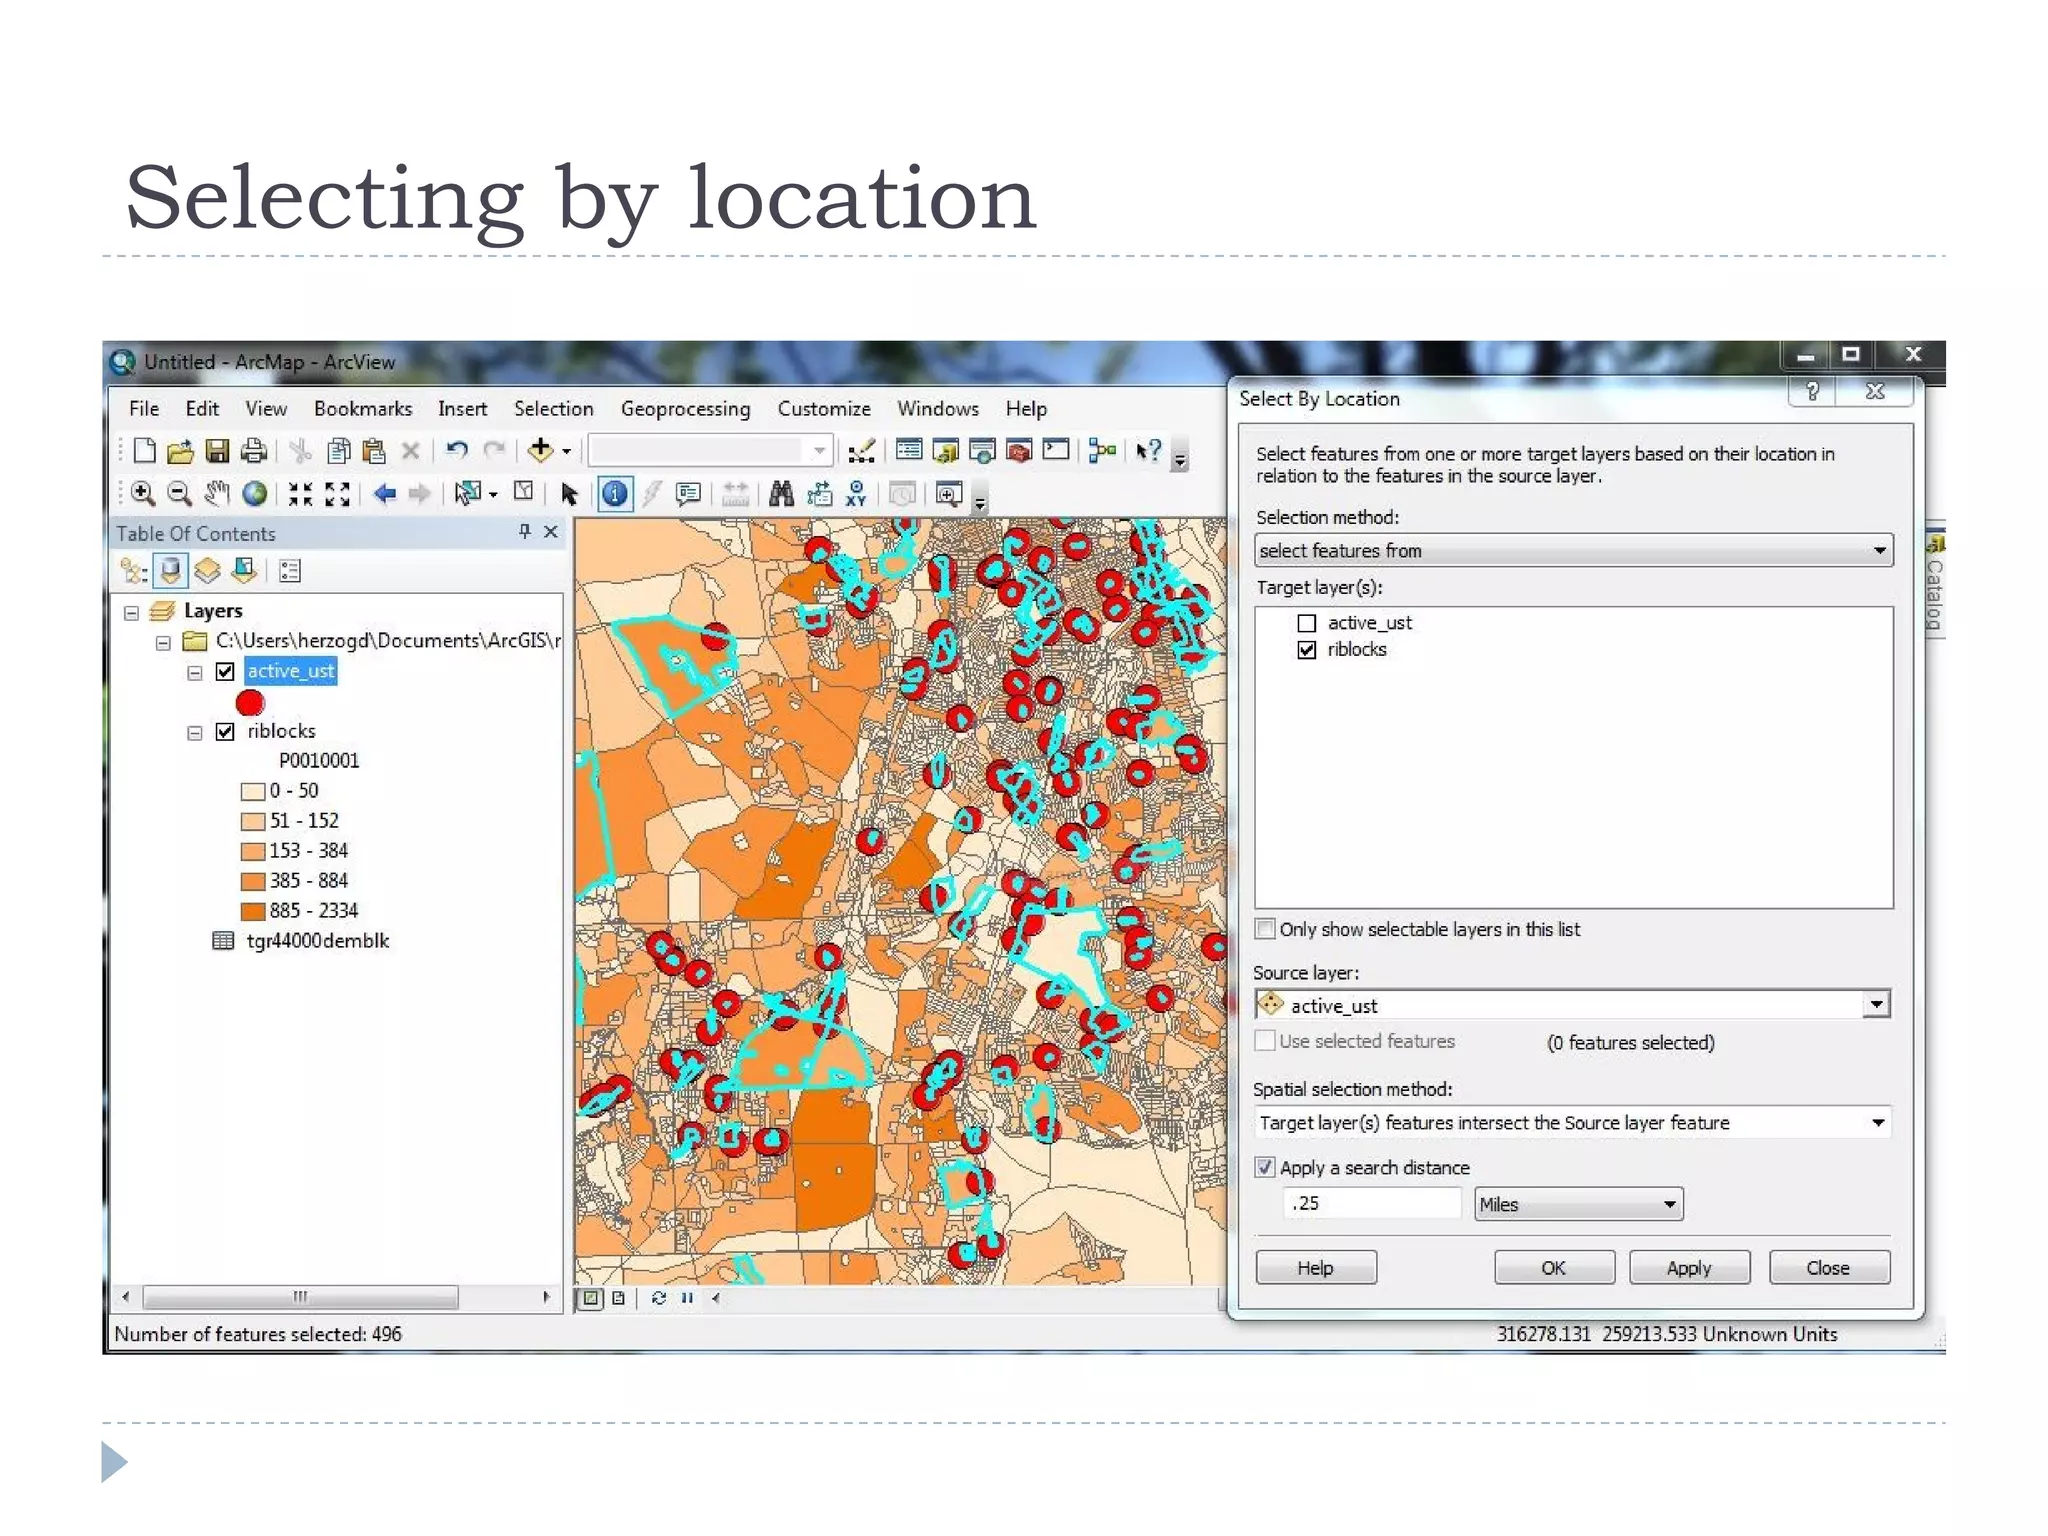
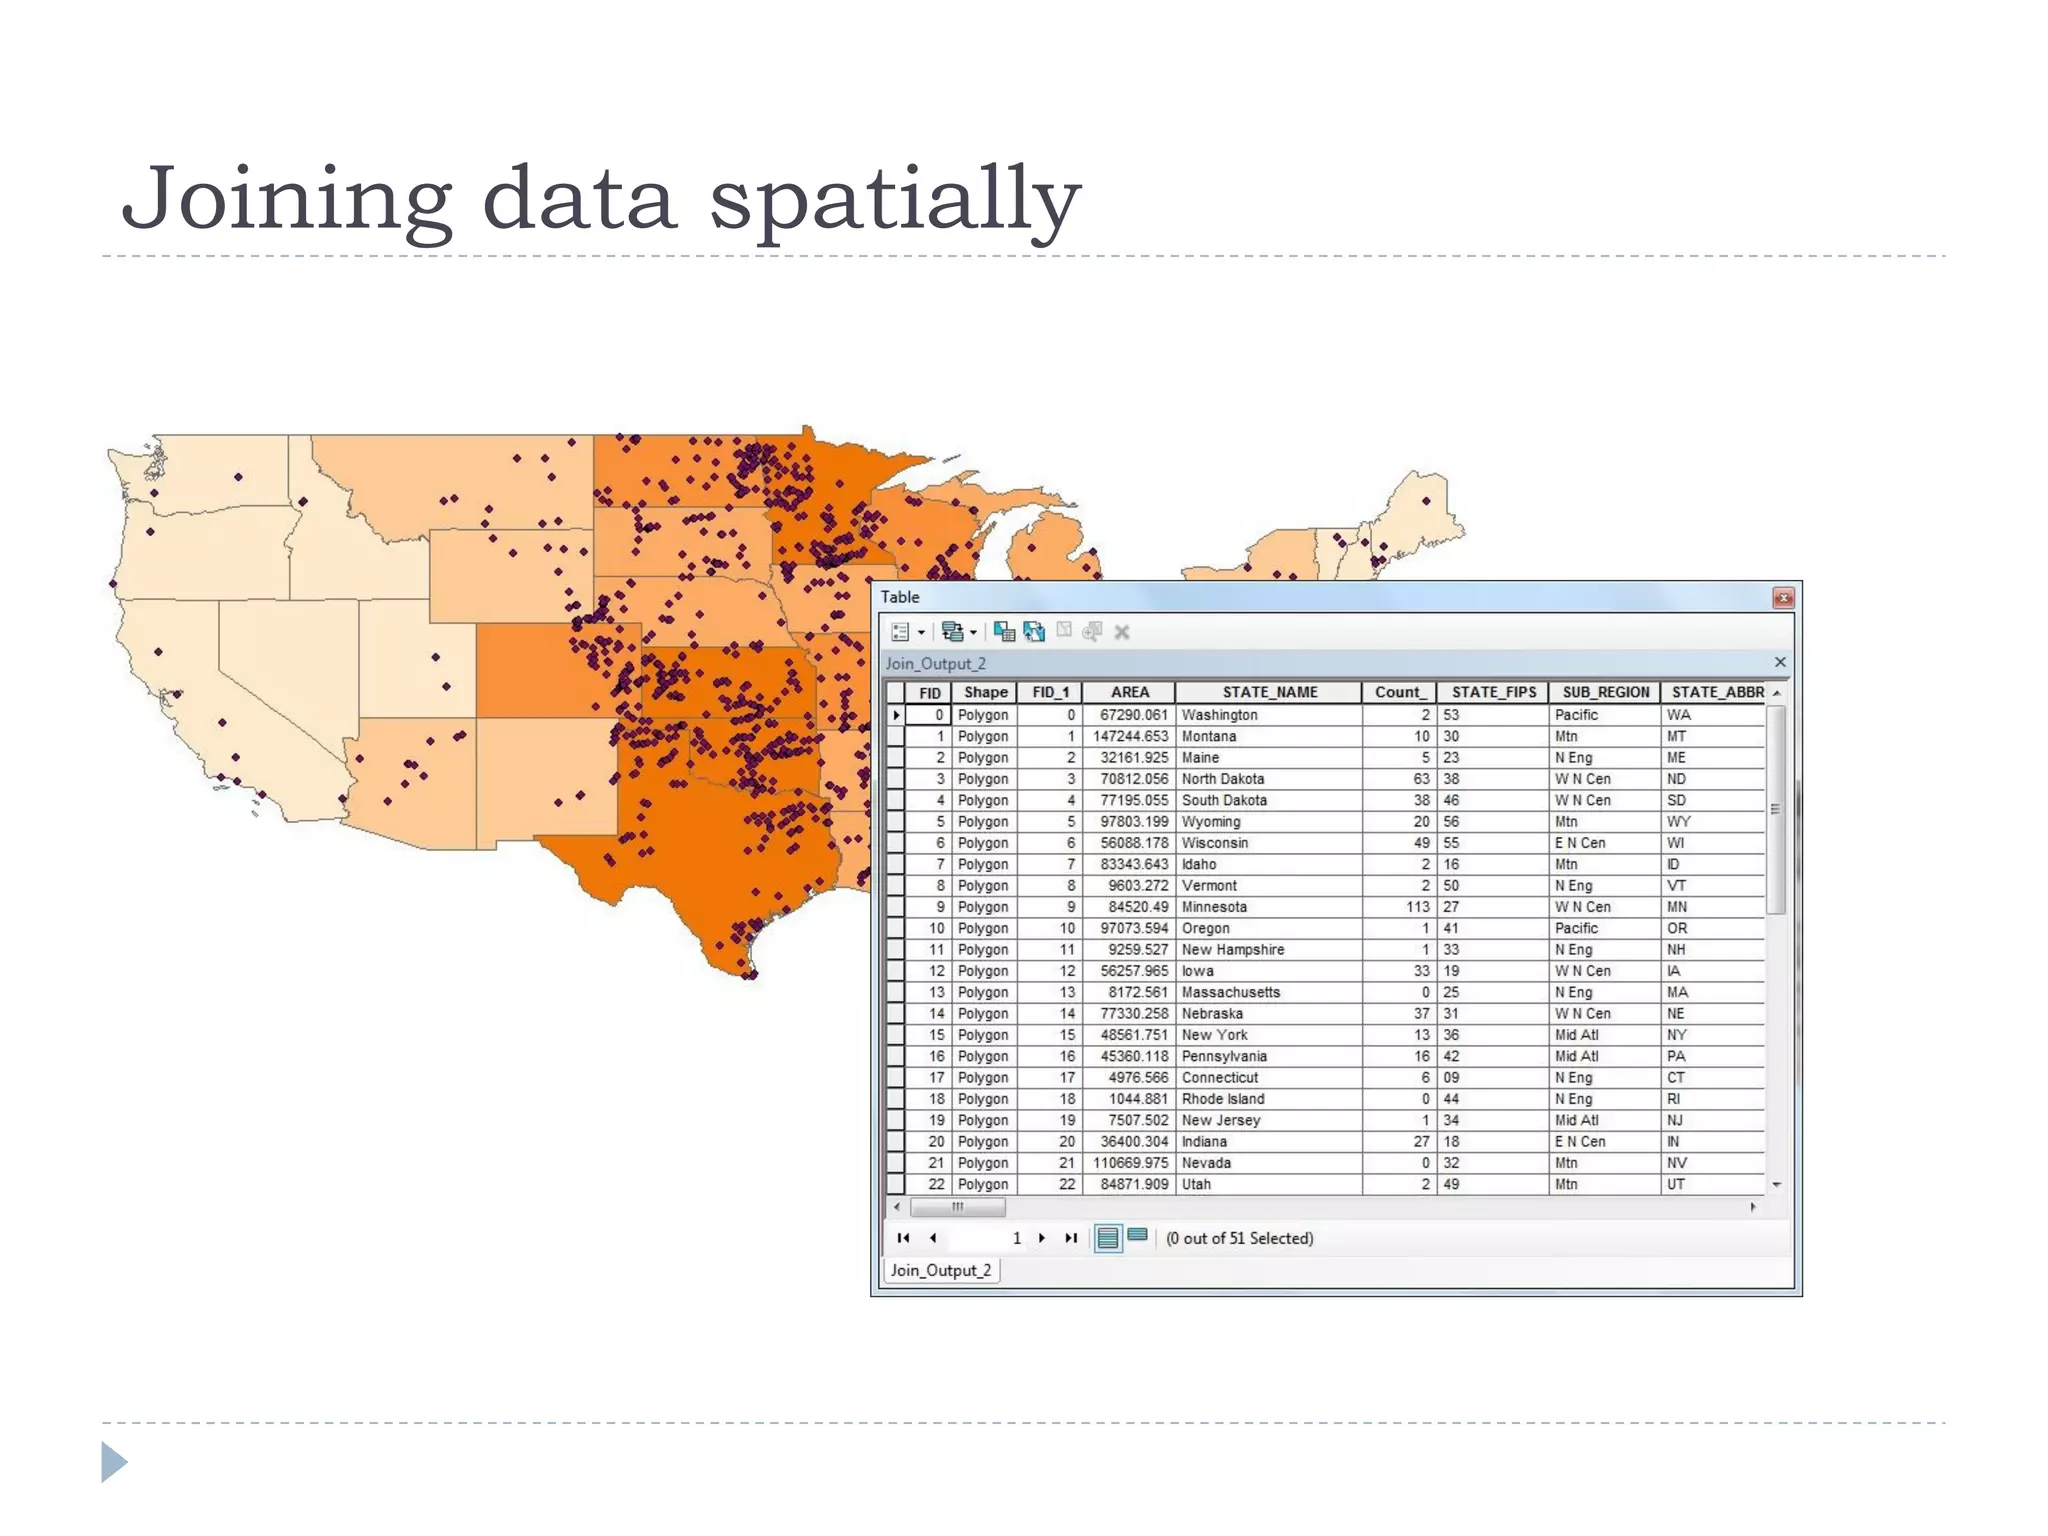
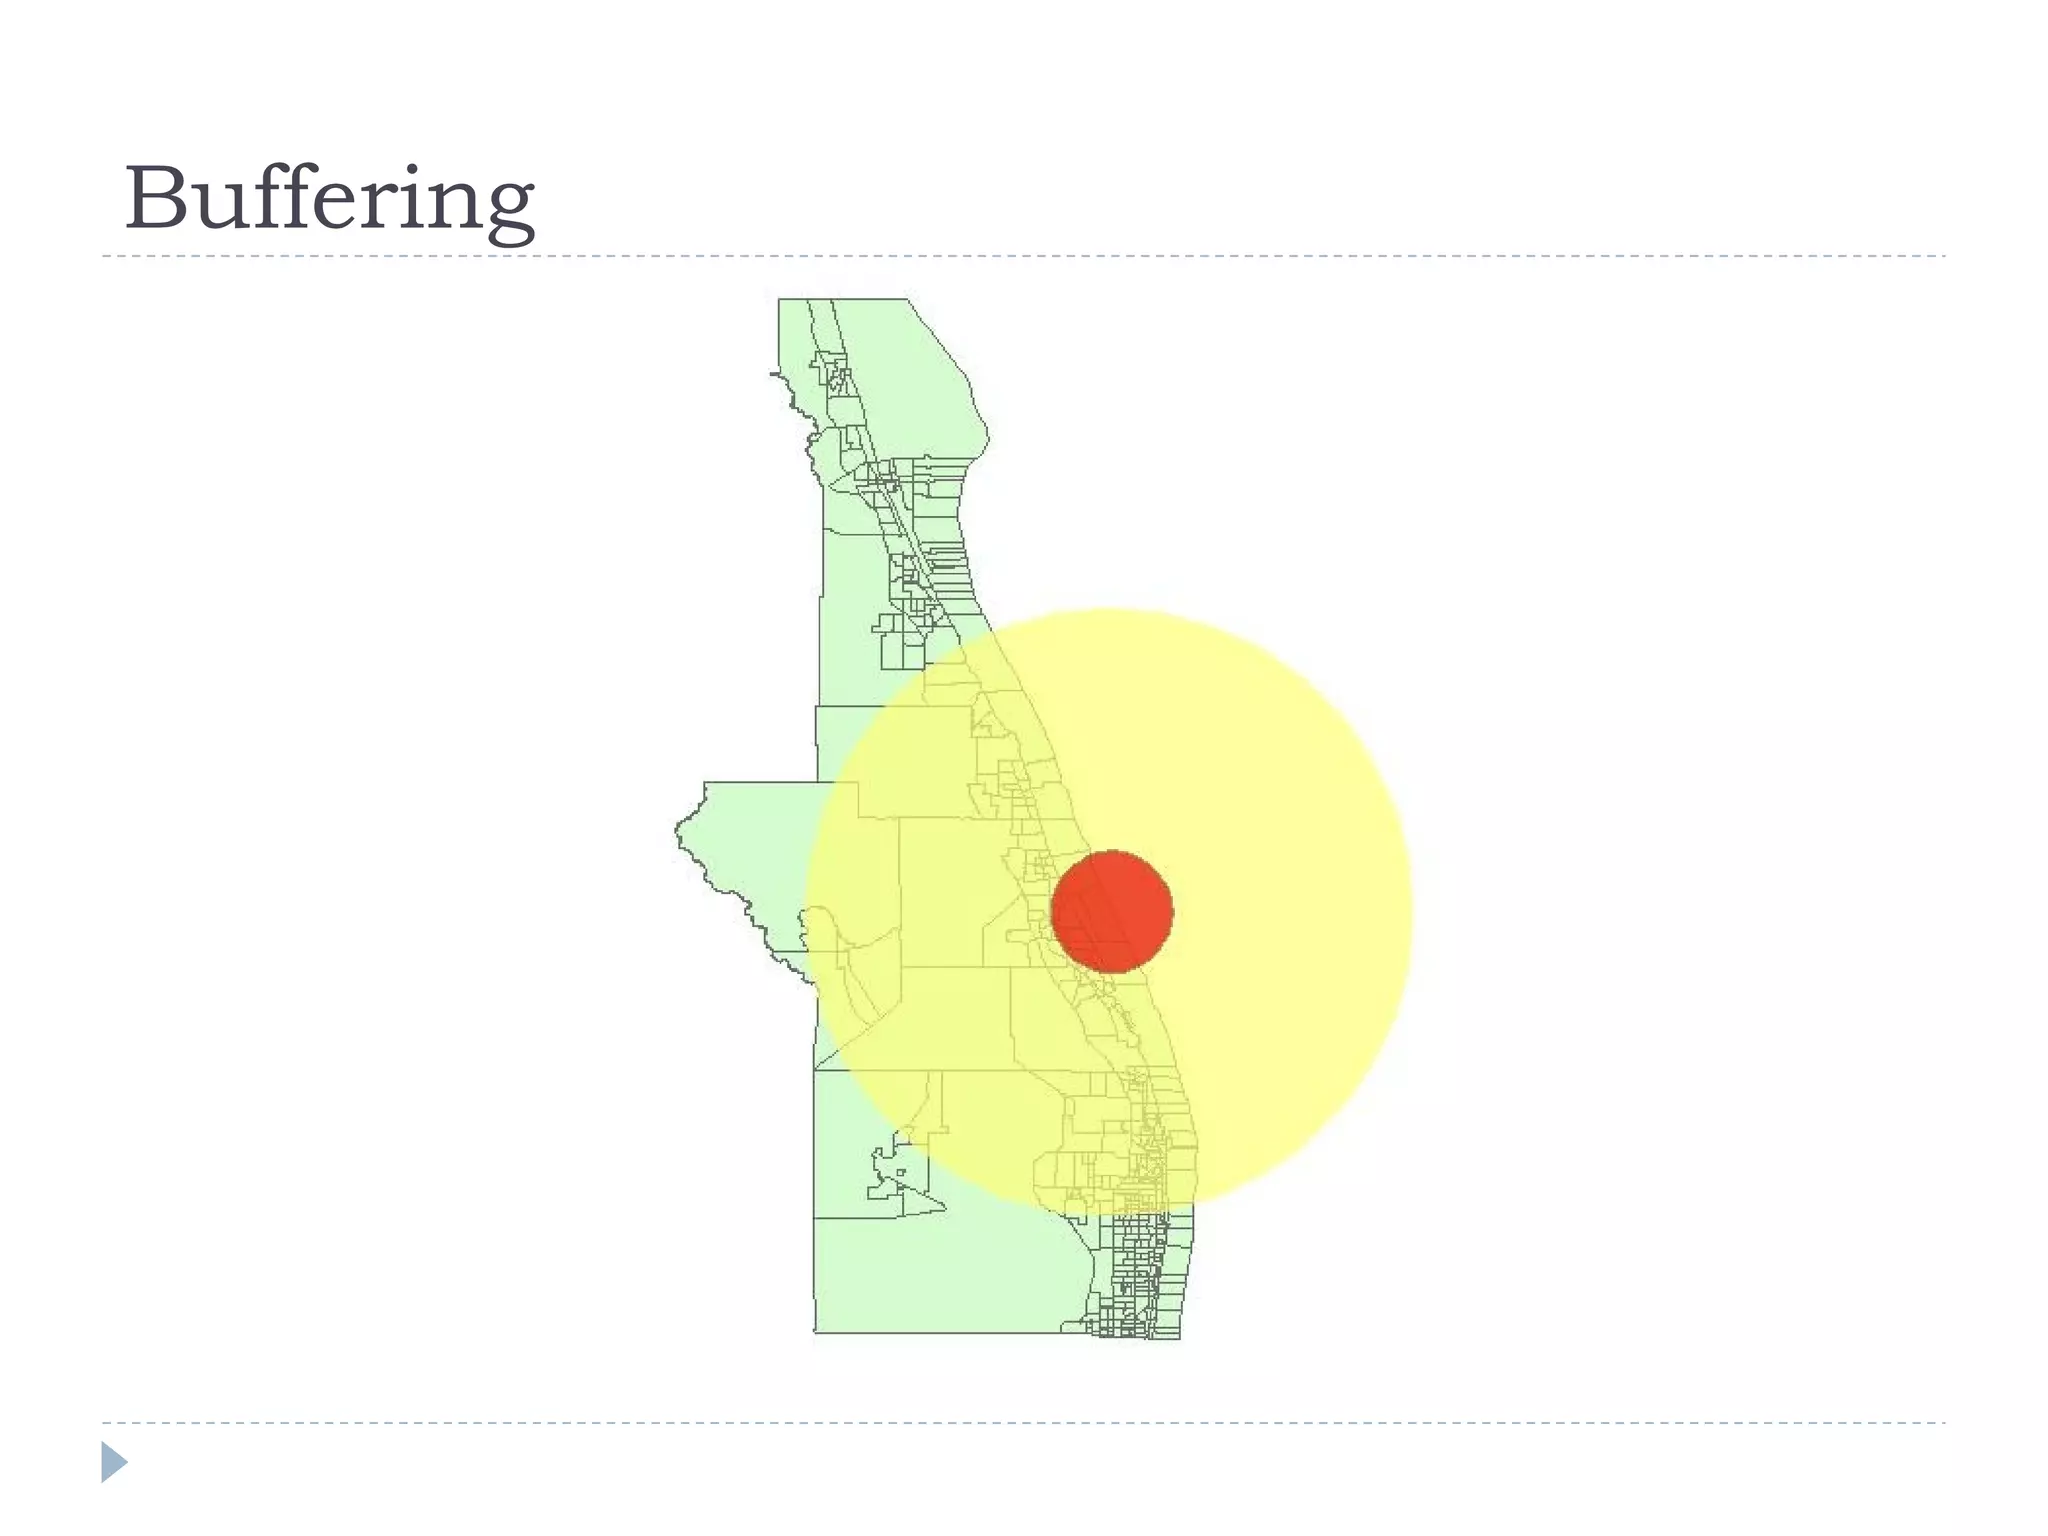
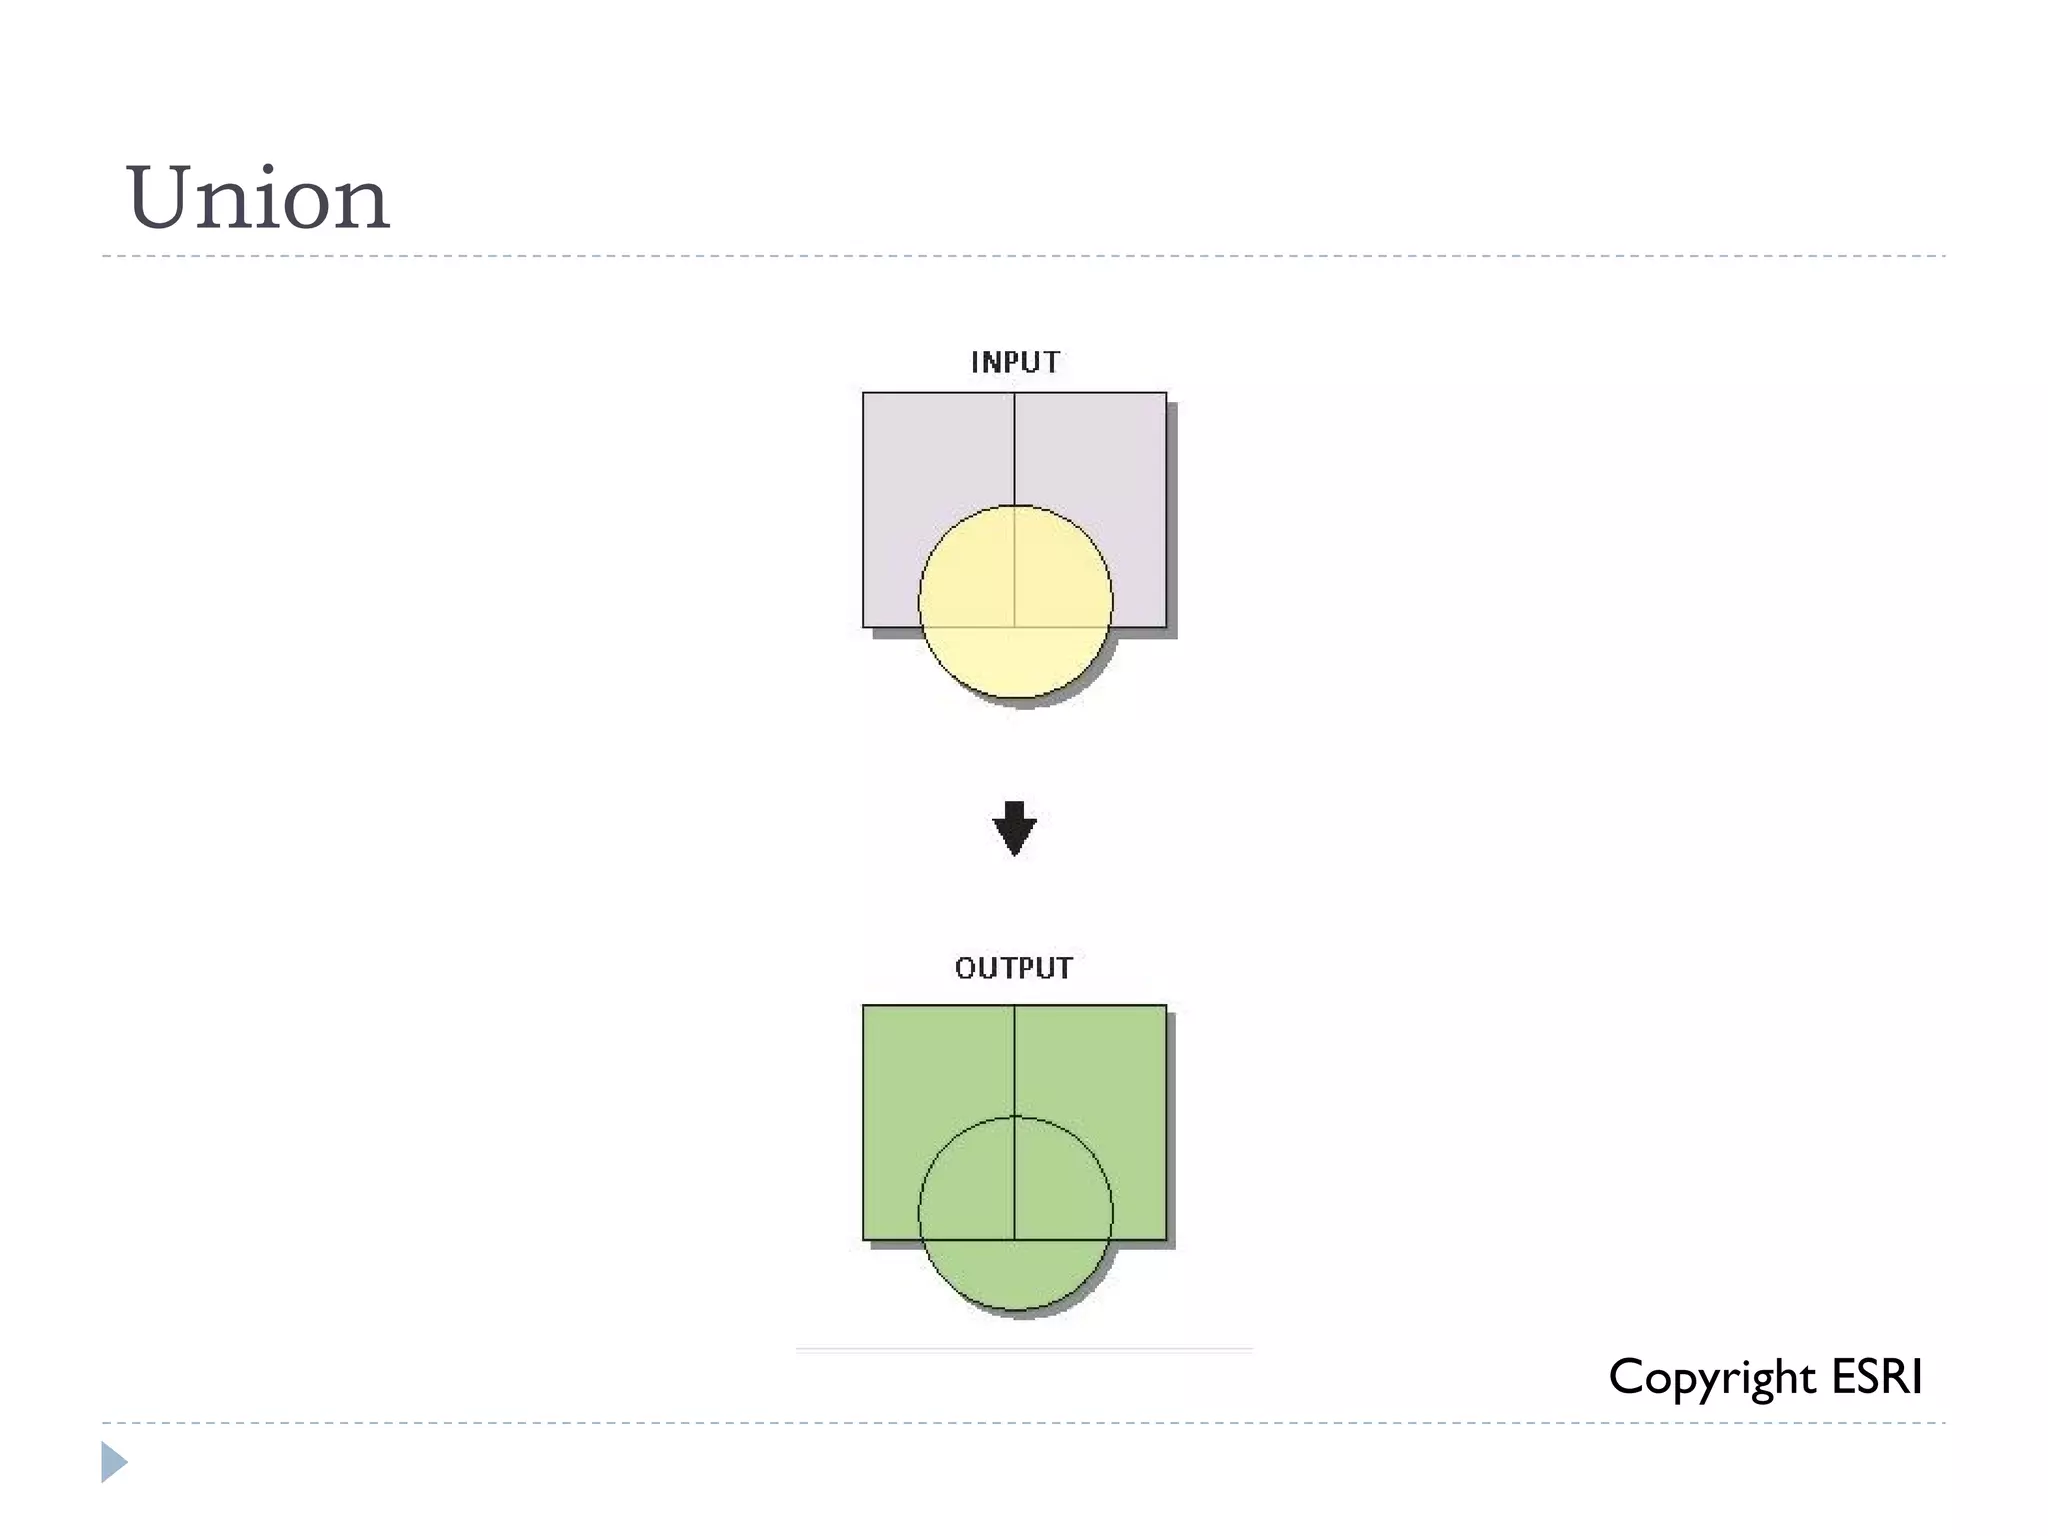

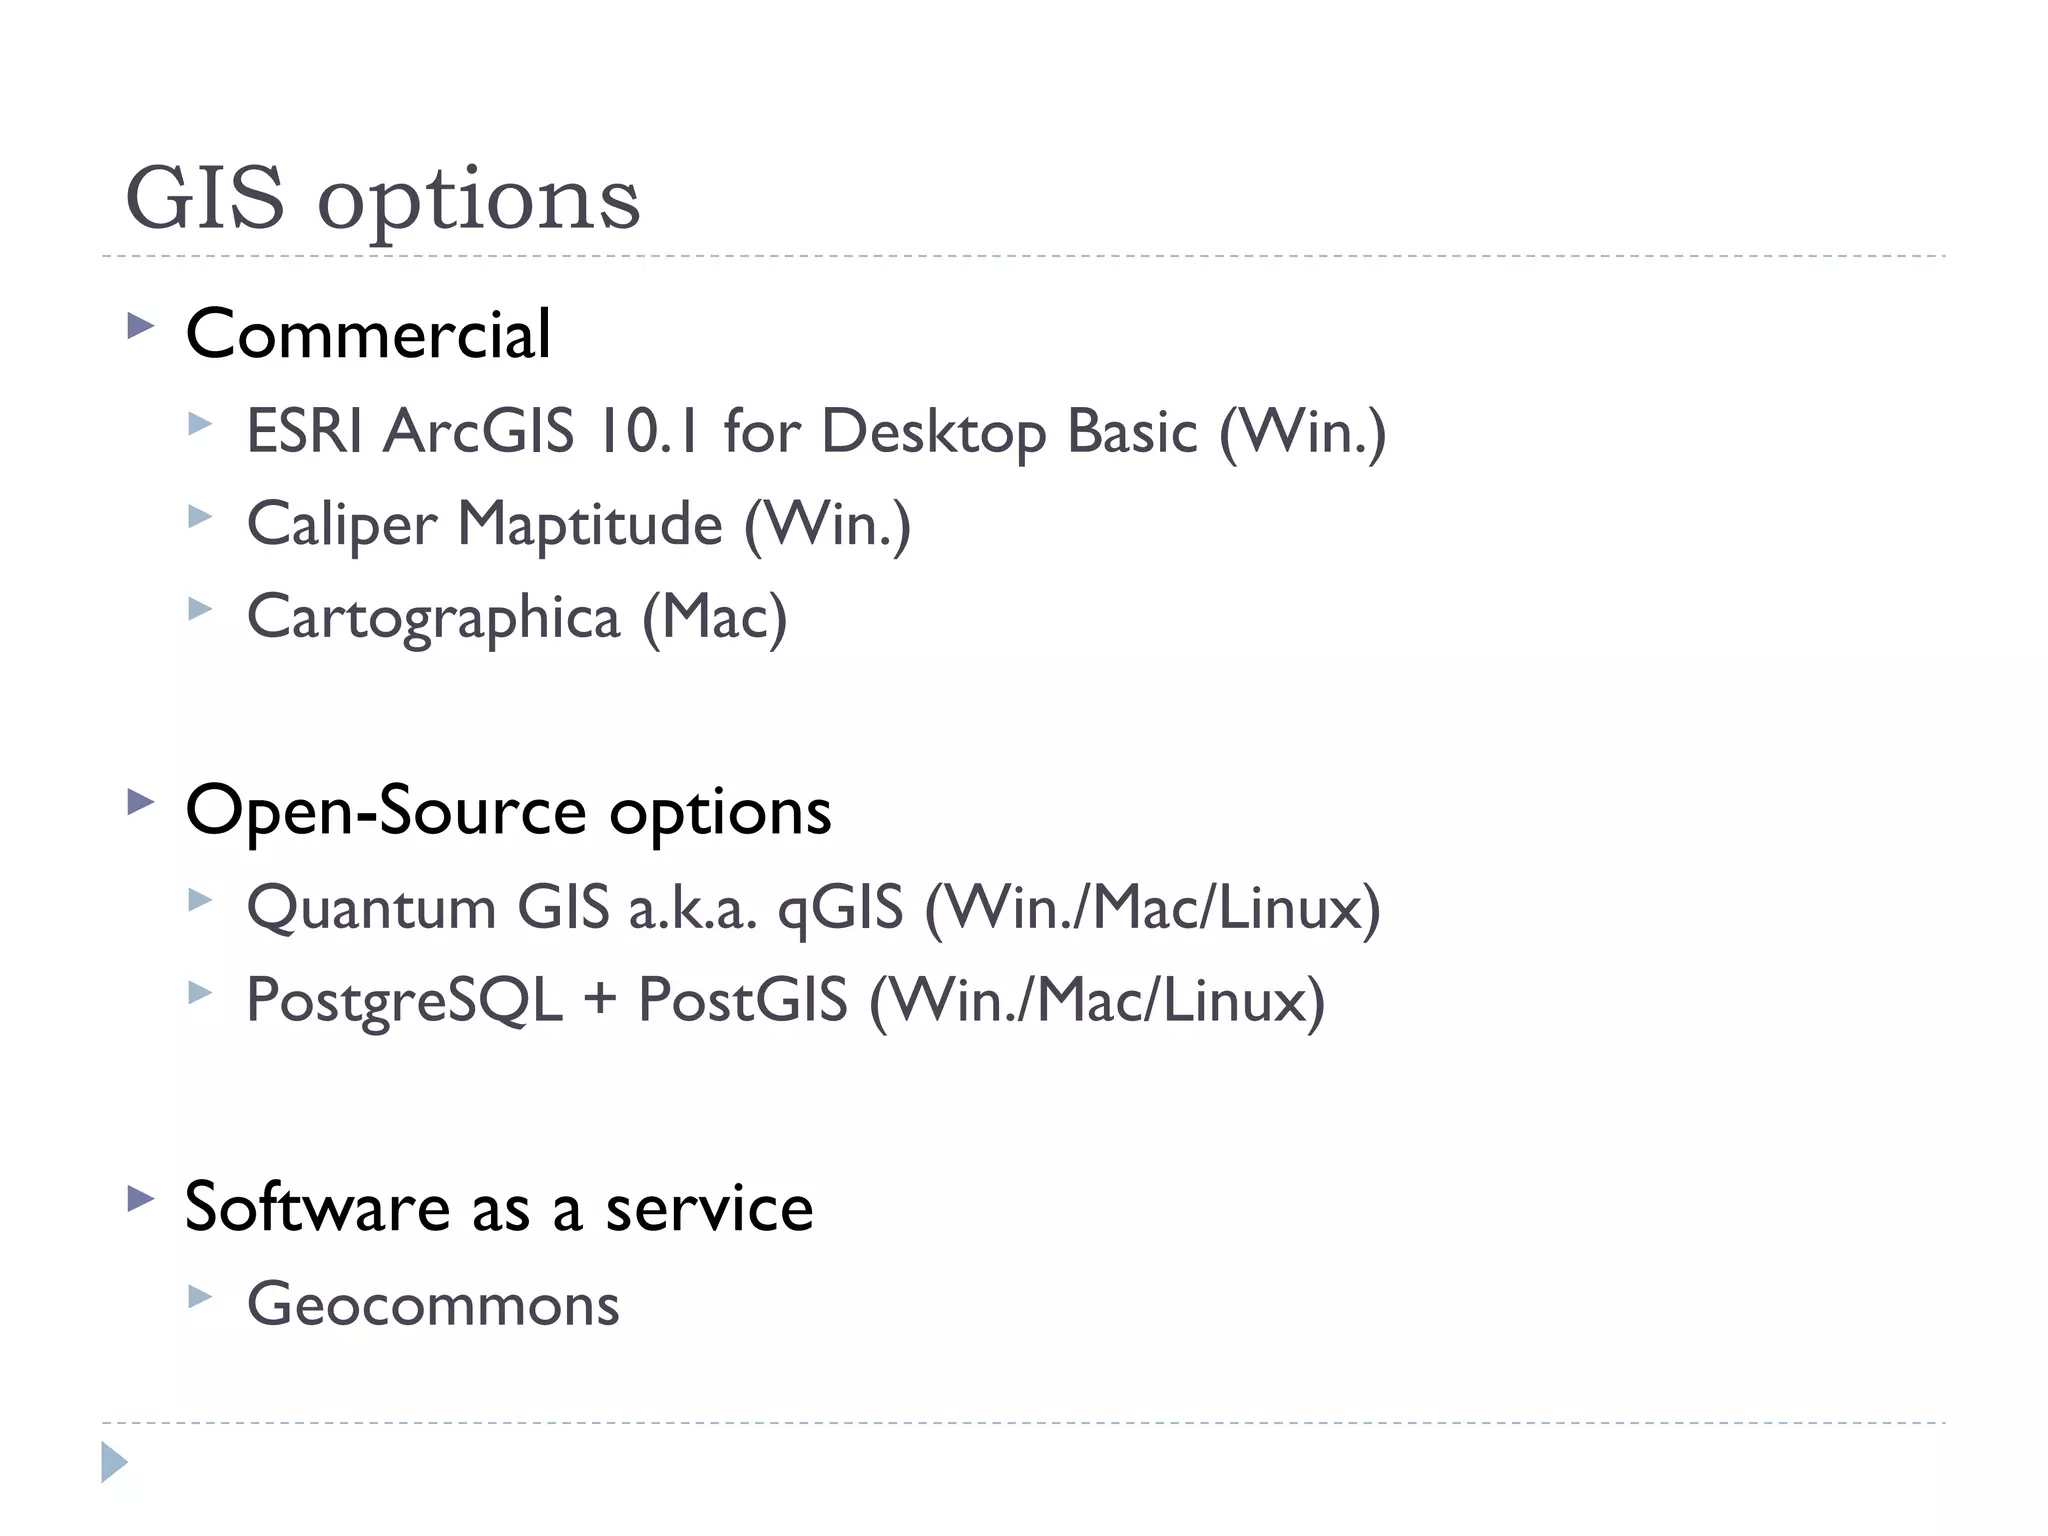
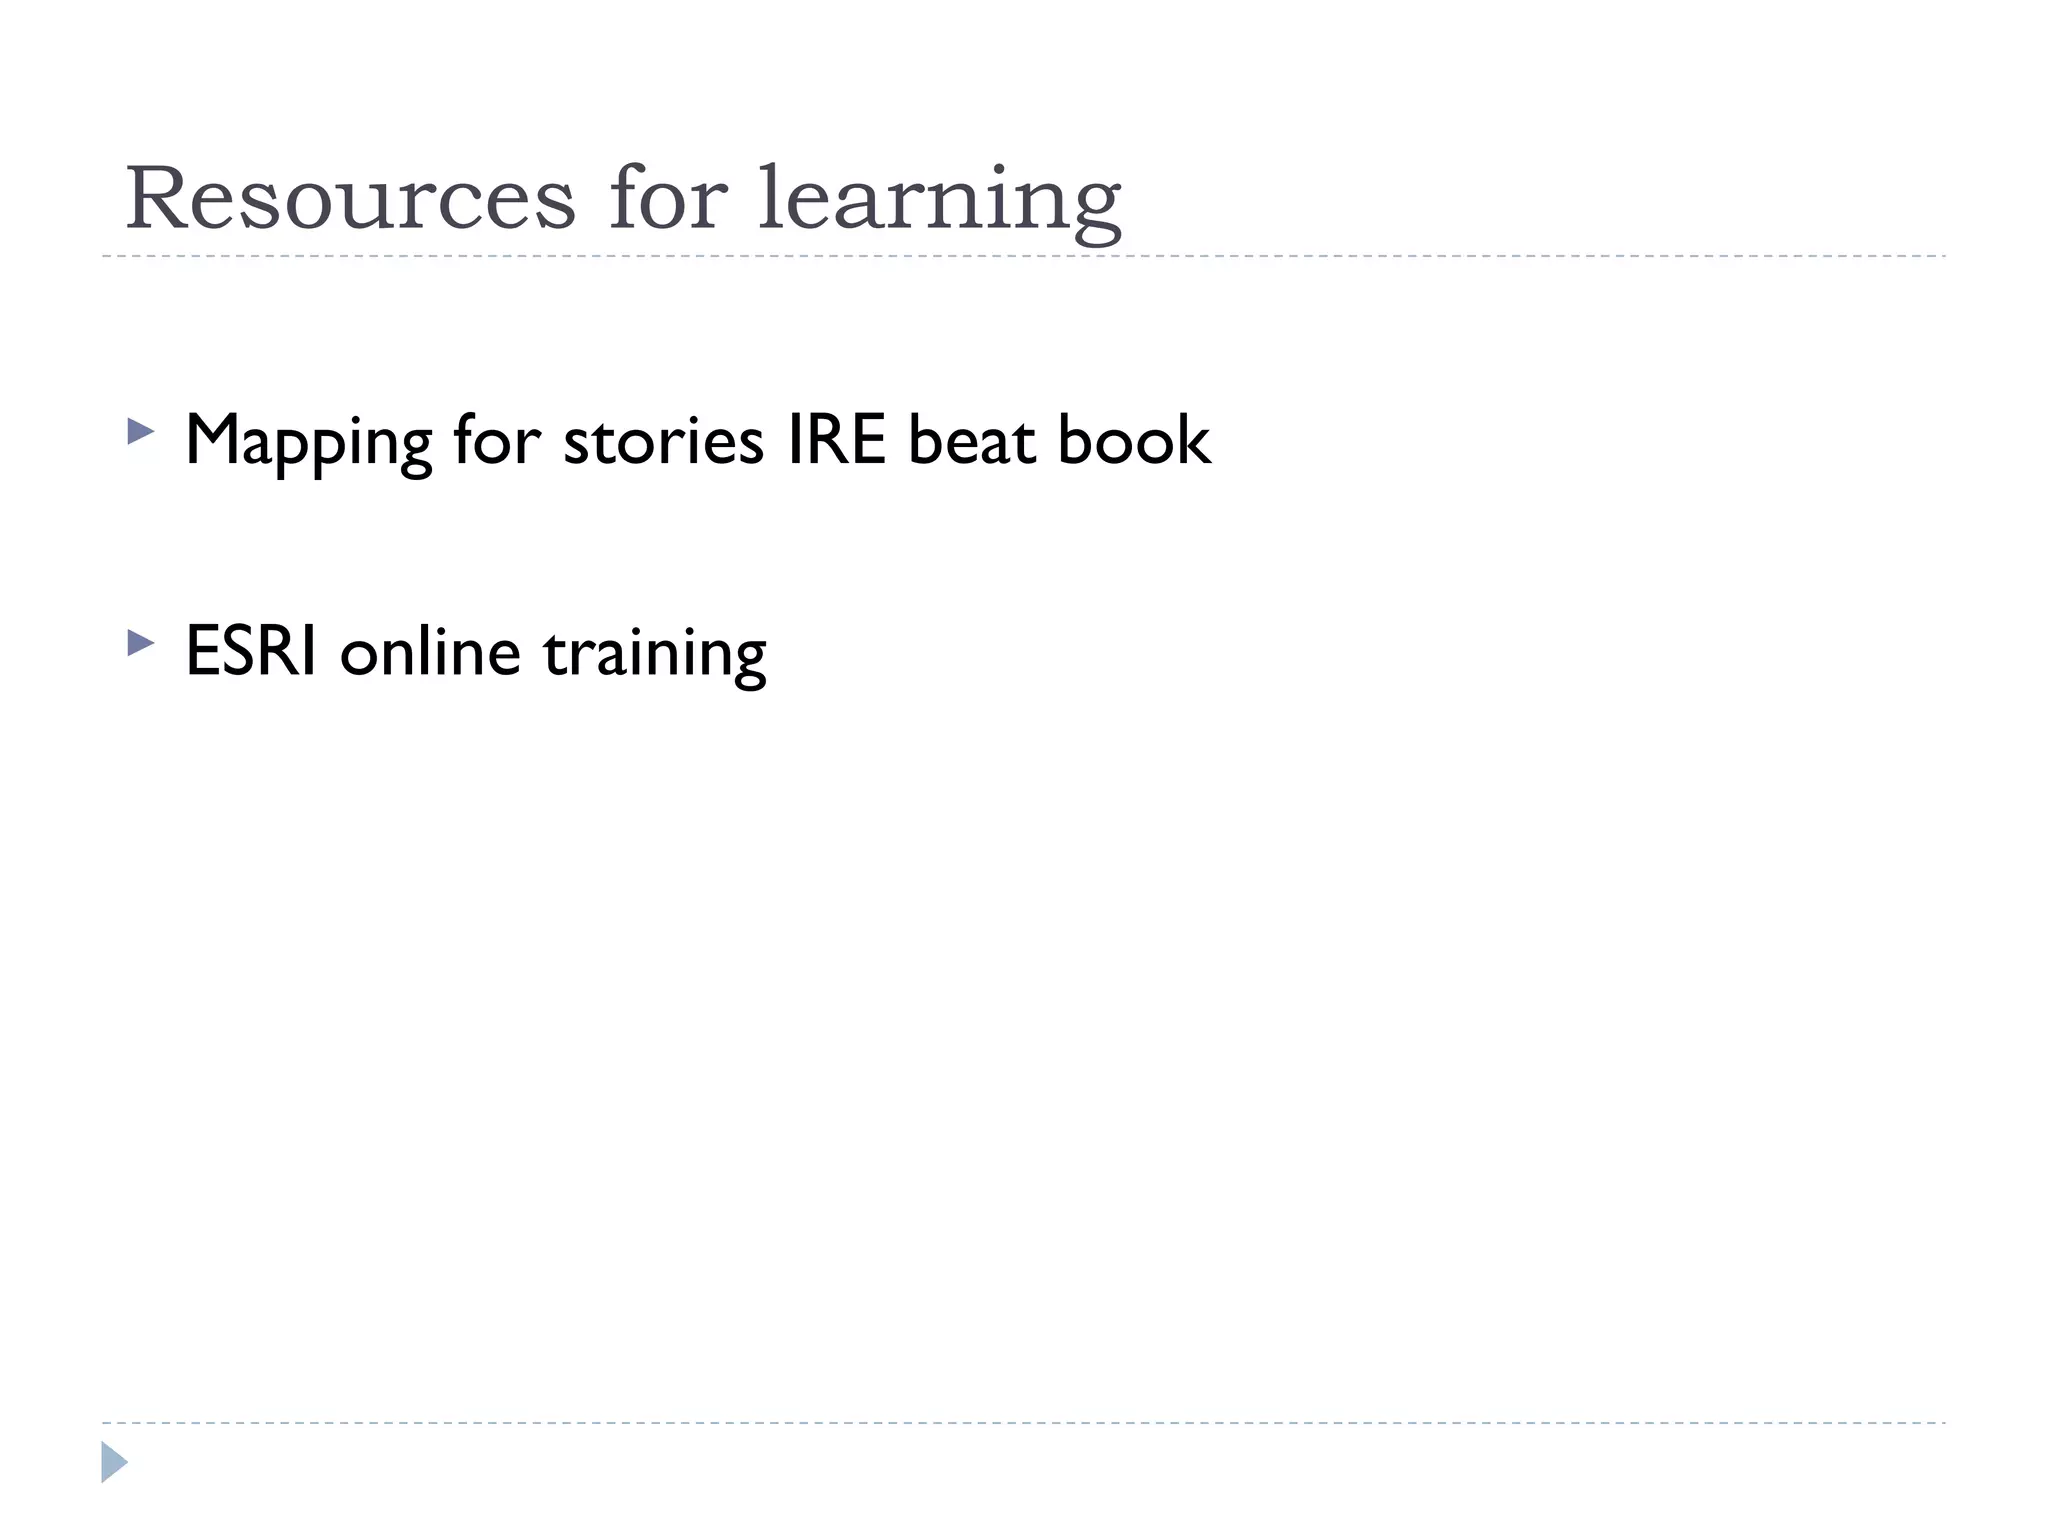

This document discusses the history and uses of geographic information systems (GIS) for mapping news stories. It outlines how GIS was first used in the 1850s to map cholera outbreaks in London, then later to map Hurricane Andrew's damage in 1992 Miami. Modern applications include interactive maps, hyperlocal news maps, data exploration, and open-source options like QGIS. GIS allows layering of data, geocoding addresses, selecting data by location or attributes, and spatial analysis tools. While GIS programs require investment of money and time, there are also free and open-source options as well as online training resources.


