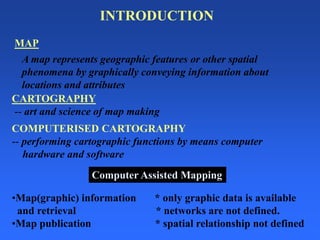
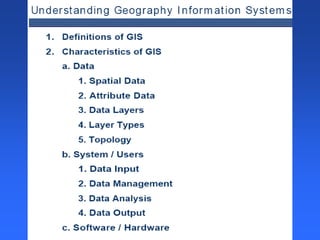
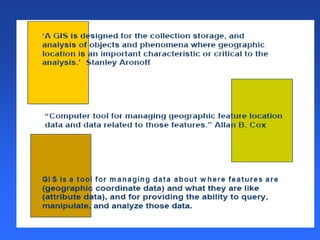
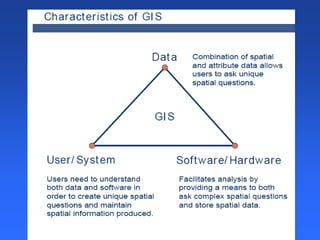
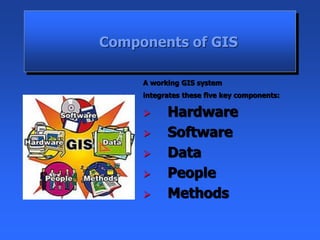
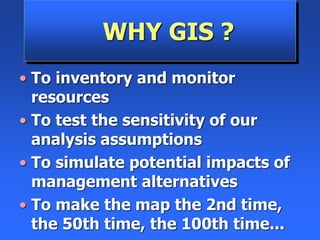
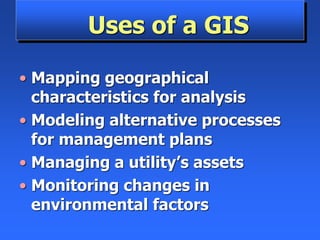
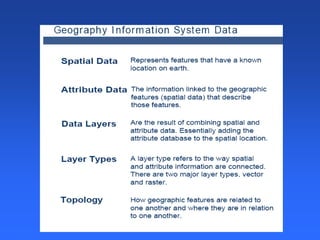
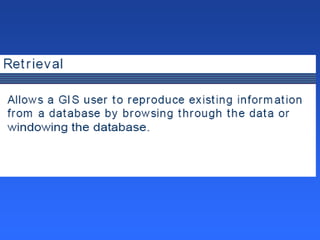
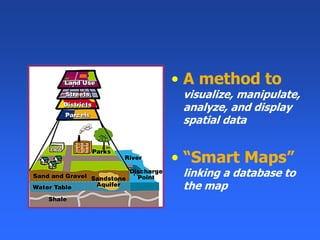
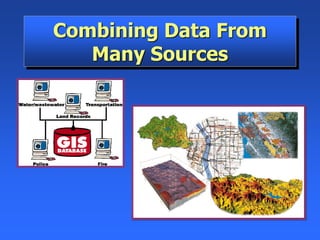
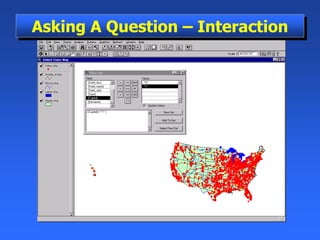
COMPUTERISED CARTOGRAPHY
-- performing cartographic functions by means computer
hardware and software
CARTOGRAPHY
-- art and science of map making
A map represents geographic features or other spatial
phenomena by graphically conveying information about
locations and attributes
MAP
•Map(graphic) information * only graphic data is available
and retrieval * networks are not defined.
•Map publication * spatial relationship not defined
Computer Assisted Mapping
INTRODUCTION
Graphics are holistic:
“a picture says more than a thousand words...”
“First road left, then
cross the railroad and
continue until you
cross the river, then
the first right and right
again on the
crossroads...”
Introduction
Why Use Graphics
Why GIS?
• 70% of the decisions, we make are
based on geographical
considerations
• Ability to assimilate spatial and non-
spatial data
• Visualisation Impact
• Sharing of Information
• Analytical Capability in a spatial
context
GIS is a System of computer software, hardware
and data, and personnel to help manipulate,
analyze and present information that is tied to a
spatial location –
• spatial location – usually a geographic location
• information – visualization of analysis of data
• system – linking software, hardware, data
• personnel – a thinking explorer who is key to
the power of GIS
Geographic Information Systems
A Definition of GIS
What is Not GIS ?
• GPS – Global Positioning System
• A static map – paper or digital
– Maps are often a “product” of a GIS
– A way to visualize the analysis
• A software package
• GIS handles SPATIAL
information
– Information referenced by its location in
space
• GIS makes connections between
activities based on spatial
proximity
9
Why is GIS unique?
Components of GIS
A working GIS system
integrates these five key components:
➢ Hardware
➢ Software
➢ Data
➢ People
➢ Methods
WHY GIS ?
• To inventory and monitor
resources
• To test the sensitivity of our
analysis assumptions
• To simulate potential impacts of
management alternatives
• To make the map the 2nd time,
the 50th time, the 100th time...
• GIS improves efficiency
• GIS identifies opportunities
• GIS improves decisions by
providing needed tools and data
How Does GIS
Provide Benefit?
Uses of a GIS
• Mapping geographical
characteristics for analysis
• Modeling alternative processes
for management plans
• Managing a utility’s assets
• Monitoring changes in
environmental factors
Spatial Data
• Estimates are that 80% of all
data has a spatial component
– Data from most sciences can be
analyzed “spatially”
Two Ways to Input and Visualize Data
• Raster – Grid
– “pixels”
– a location and value
– Satellite images and aerial
photos are already in this
format
• Vector – Linear
– Points, lines & polygons
– “Features” (house, lake, etc.)
– Attributes
– size, type, length, etc.
Real world
• A method to
visualize, manipulate,
analyze, and display
spatial data
• “Smart Maps”
linking a database to
the map
Data Capture Sources
• Digitizing from paper maps
• Scanning
• Traditional surveying
techniques
• Paper records & field notes
• Photogrammetry
• Remote sensing
• GPS
Database
“Not Easy to Interpret”
Visualization
“Worth a Thousand Words”
Combining Data From
Many Sources
States
Five Data Layers
“Alike” Features
Roads
Capitals
Rivers
Lakes
“Spatial Analysis” – not just a map
Turning Data Into Information
Asking A Question – Interaction
Maps and Database are
“Interactive”
Multiple Databases can be
Linked and Related
• Emergency Services – Fire & Police
• Environmental – Monitoring & Modeling
• Business – Site Location, Delivery Systems
• Industry – Transportation, Communication,
Mining, Pipelines, Healthcare
• Government – Local, State, Federal, Military
• Education – Research, Teaching Tool,
Administration
Wherever Spatial Data Analysis
is Needed

Forestry gis 2021

  • 1.
    COMPUTERISED CARTOGRAPHY -- performingcartographic functions by means computer hardware and software CARTOGRAPHY -- art and science of map making A map represents geographic features or other spatial phenomena by graphically conveying information about locations and attributes MAP •Map(graphic) information * only graphic data is available and retrieval * networks are not defined. •Map publication * spatial relationship not defined Computer Assisted Mapping INTRODUCTION
  • 2.
    Graphics are holistic: “apicture says more than a thousand words...” “First road left, then cross the railroad and continue until you cross the river, then the first right and right again on the crossroads...” Introduction Why Use Graphics
  • 3.
    Why GIS? • 70%of the decisions, we make are based on geographical considerations • Ability to assimilate spatial and non- spatial data • Visualisation Impact • Sharing of Information • Analytical Capability in a spatial context
  • 4.
    GIS is aSystem of computer software, hardware and data, and personnel to help manipulate, analyze and present information that is tied to a spatial location – • spatial location – usually a geographic location • information – visualization of analysis of data • system – linking software, hardware, data • personnel – a thinking explorer who is key to the power of GIS Geographic Information Systems A Definition of GIS
  • 8.
    What is NotGIS ? • GPS – Global Positioning System • A static map – paper or digital – Maps are often a “product” of a GIS – A way to visualize the analysis • A software package
  • 9.
    • GIS handlesSPATIAL information – Information referenced by its location in space • GIS makes connections between activities based on spatial proximity 9 Why is GIS unique?
  • 10.
    Components of GIS Aworking GIS system integrates these five key components: ➢ Hardware ➢ Software ➢ Data ➢ People ➢ Methods
  • 11.
    WHY GIS ? •To inventory and monitor resources • To test the sensitivity of our analysis assumptions • To simulate potential impacts of management alternatives • To make the map the 2nd time, the 50th time, the 100th time...
  • 12.
    • GIS improvesefficiency • GIS identifies opportunities • GIS improves decisions by providing needed tools and data How Does GIS Provide Benefit?
  • 13.
    Uses of aGIS • Mapping geographical characteristics for analysis • Modeling alternative processes for management plans • Managing a utility’s assets • Monitoring changes in environmental factors
  • 15.
    Spatial Data • Estimatesare that 80% of all data has a spatial component – Data from most sciences can be analyzed “spatially”
  • 19.
    Two Ways toInput and Visualize Data • Raster – Grid – “pixels” – a location and value – Satellite images and aerial photos are already in this format • Vector – Linear – Points, lines & polygons – “Features” (house, lake, etc.) – Attributes – size, type, length, etc. Real world
  • 27.
    • A methodto visualize, manipulate, analyze, and display spatial data • “Smart Maps” linking a database to the map
  • 28.
    Data Capture Sources •Digitizing from paper maps • Scanning • Traditional surveying techniques • Paper records & field notes • Photogrammetry • Remote sensing • GPS
  • 29.
  • 30.
  • 34.
  • 35.
    States Five Data Layers “Alike”Features Roads Capitals Rivers Lakes
  • 36.
    “Spatial Analysis” –not just a map Turning Data Into Information
  • 37.
    Asking A Question– Interaction
  • 38.
    Maps and Databaseare “Interactive”
  • 39.
    Multiple Databases canbe Linked and Related
  • 45.
    • Emergency Services– Fire & Police • Environmental – Monitoring & Modeling • Business – Site Location, Delivery Systems • Industry – Transportation, Communication, Mining, Pipelines, Healthcare • Government – Local, State, Federal, Military • Education – Research, Teaching Tool, Administration Wherever Spatial Data Analysis is Needed