The document discusses how to forecast a company's balance sheet by formulating explicit parameters and formulas for each line item. Key aspects covered include:
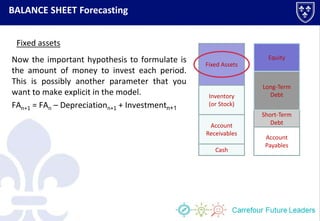
- Using depreciation and investment amounts to forecast fixed assets
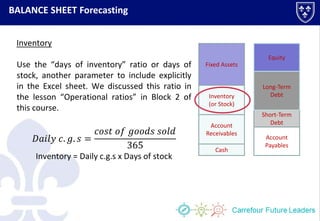
- Calculating inventory using days of inventory and cost of goods sold
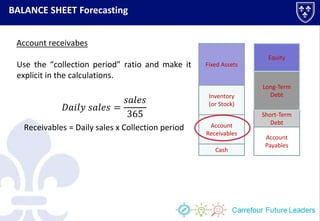
- Figuring accounts receivable using collection period and daily sales
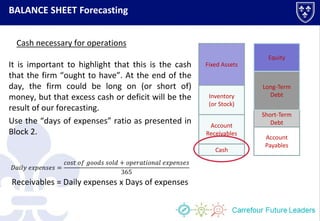
- Determining cash needed using days of expenses ratio
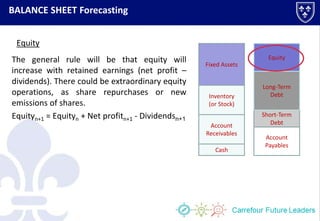
- Updating equity with retained earnings from net profit less dividends
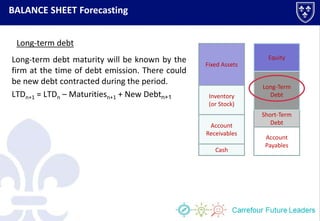
- Accounting for long-term debt maturities and new debt amounts
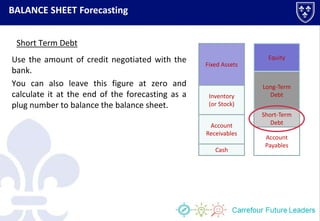
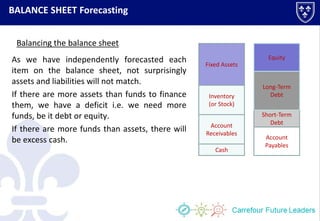
- Optionally leaving short-term debt as a plug number to balance the sheet


![Credit Training[Finall]](https://cdn.slidesharecdn.com/ss_thumbnails/credittrainingfinall-091227073414-phpapp02-thumbnail.jpg?width=640&height=640&fit=bounds)


