Download to read offline
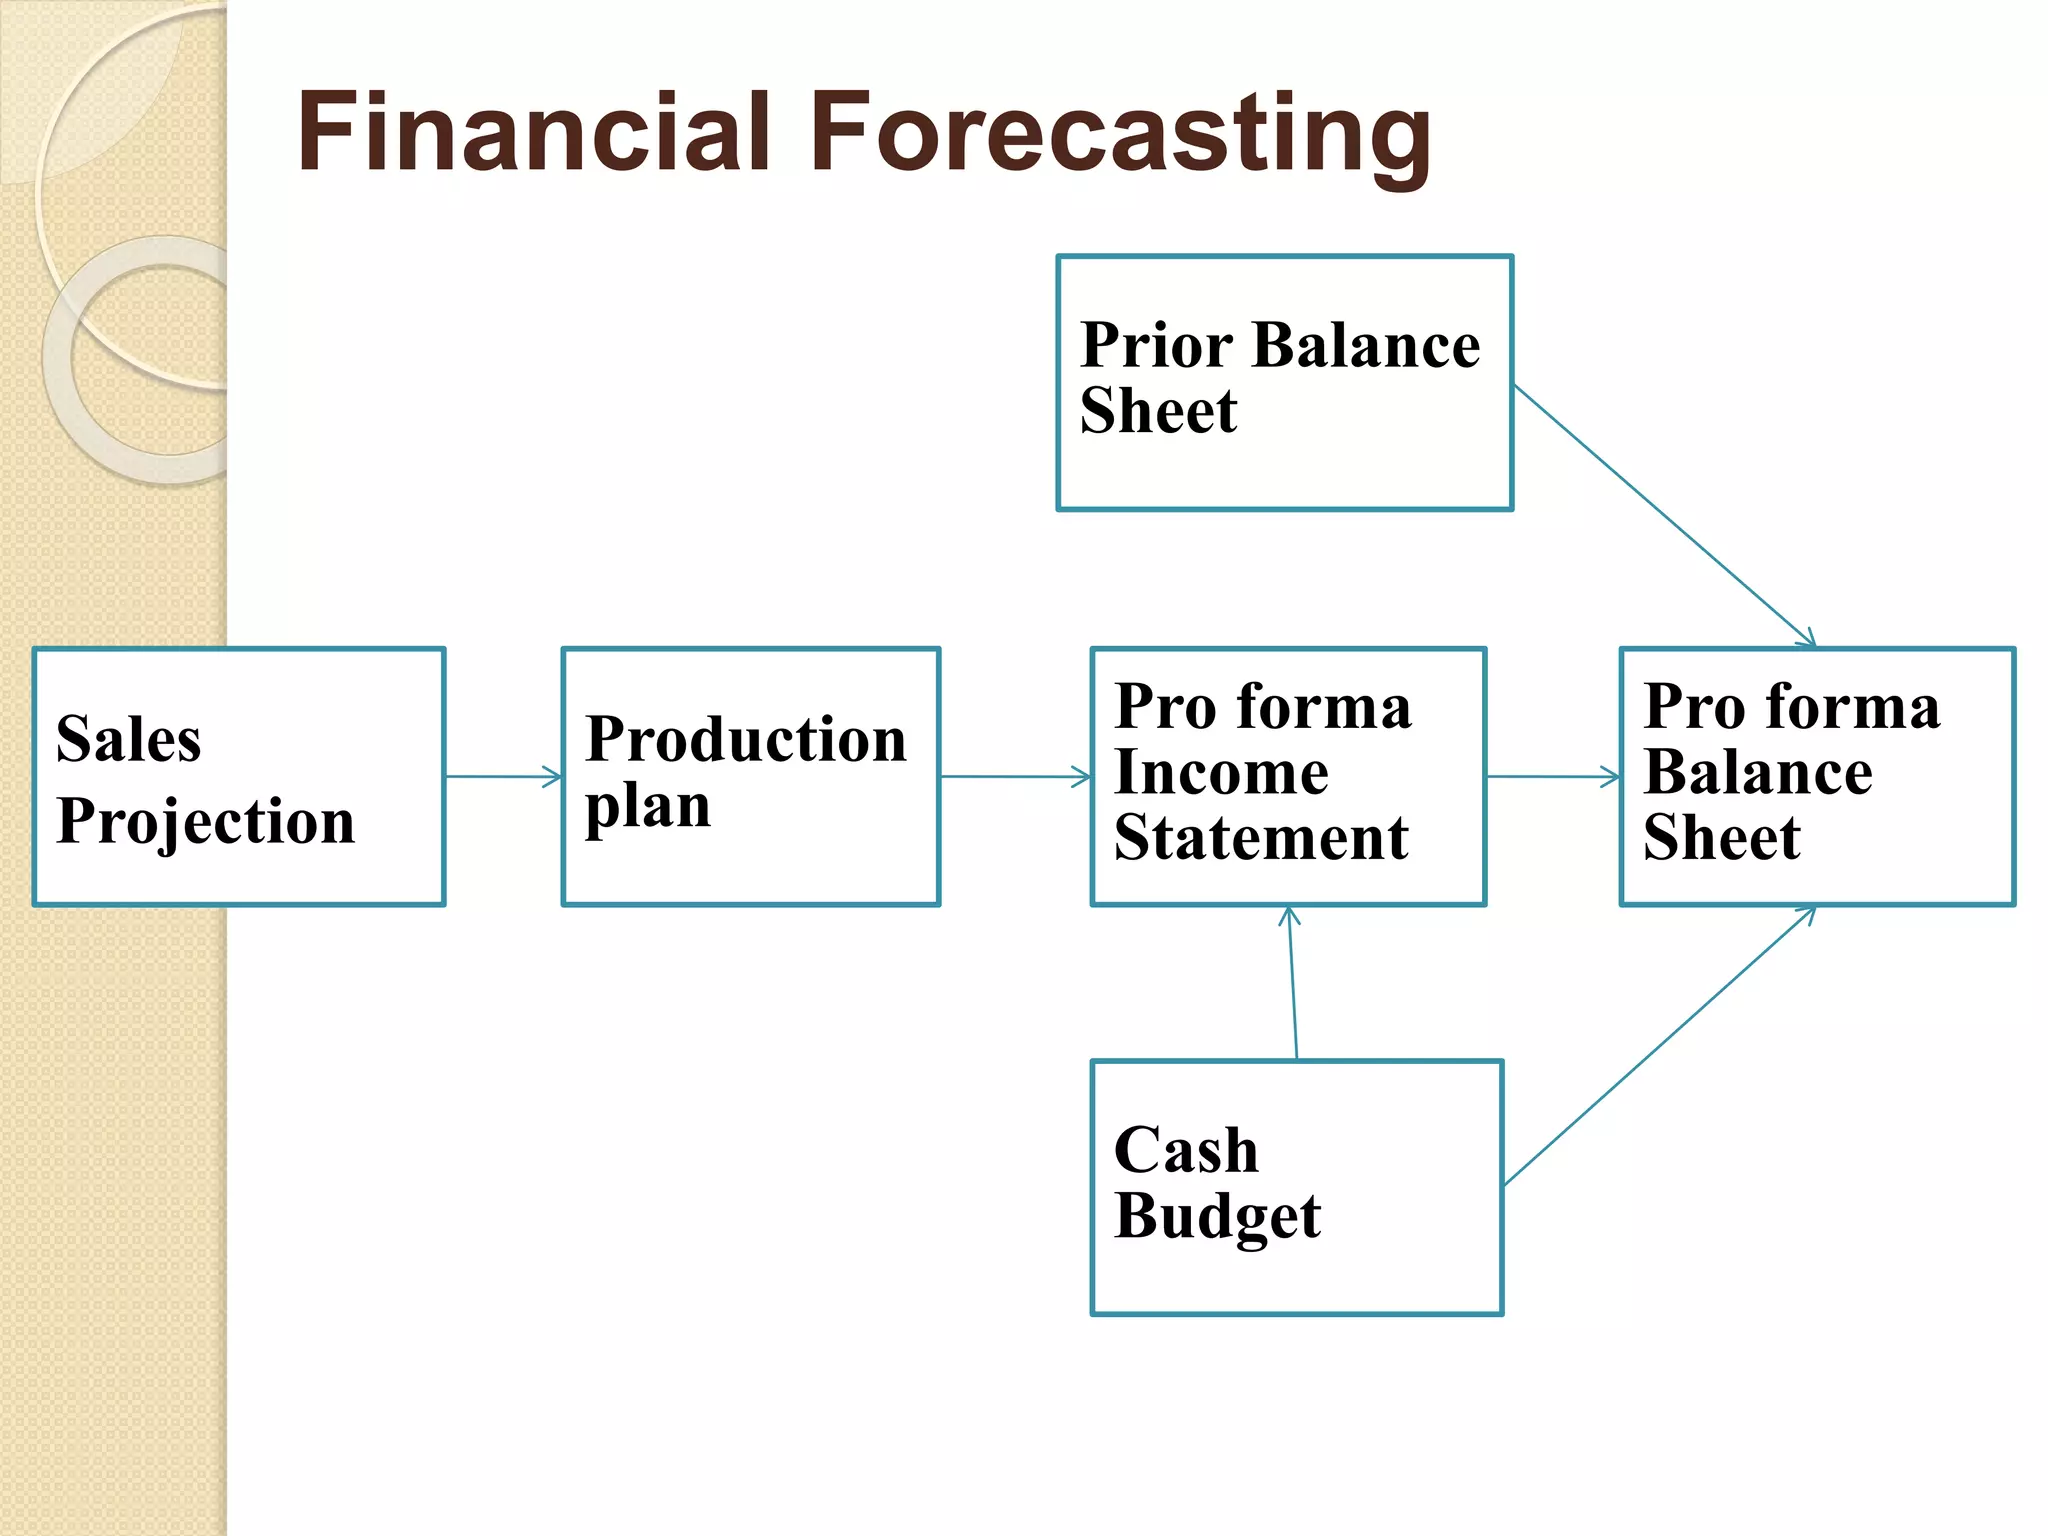
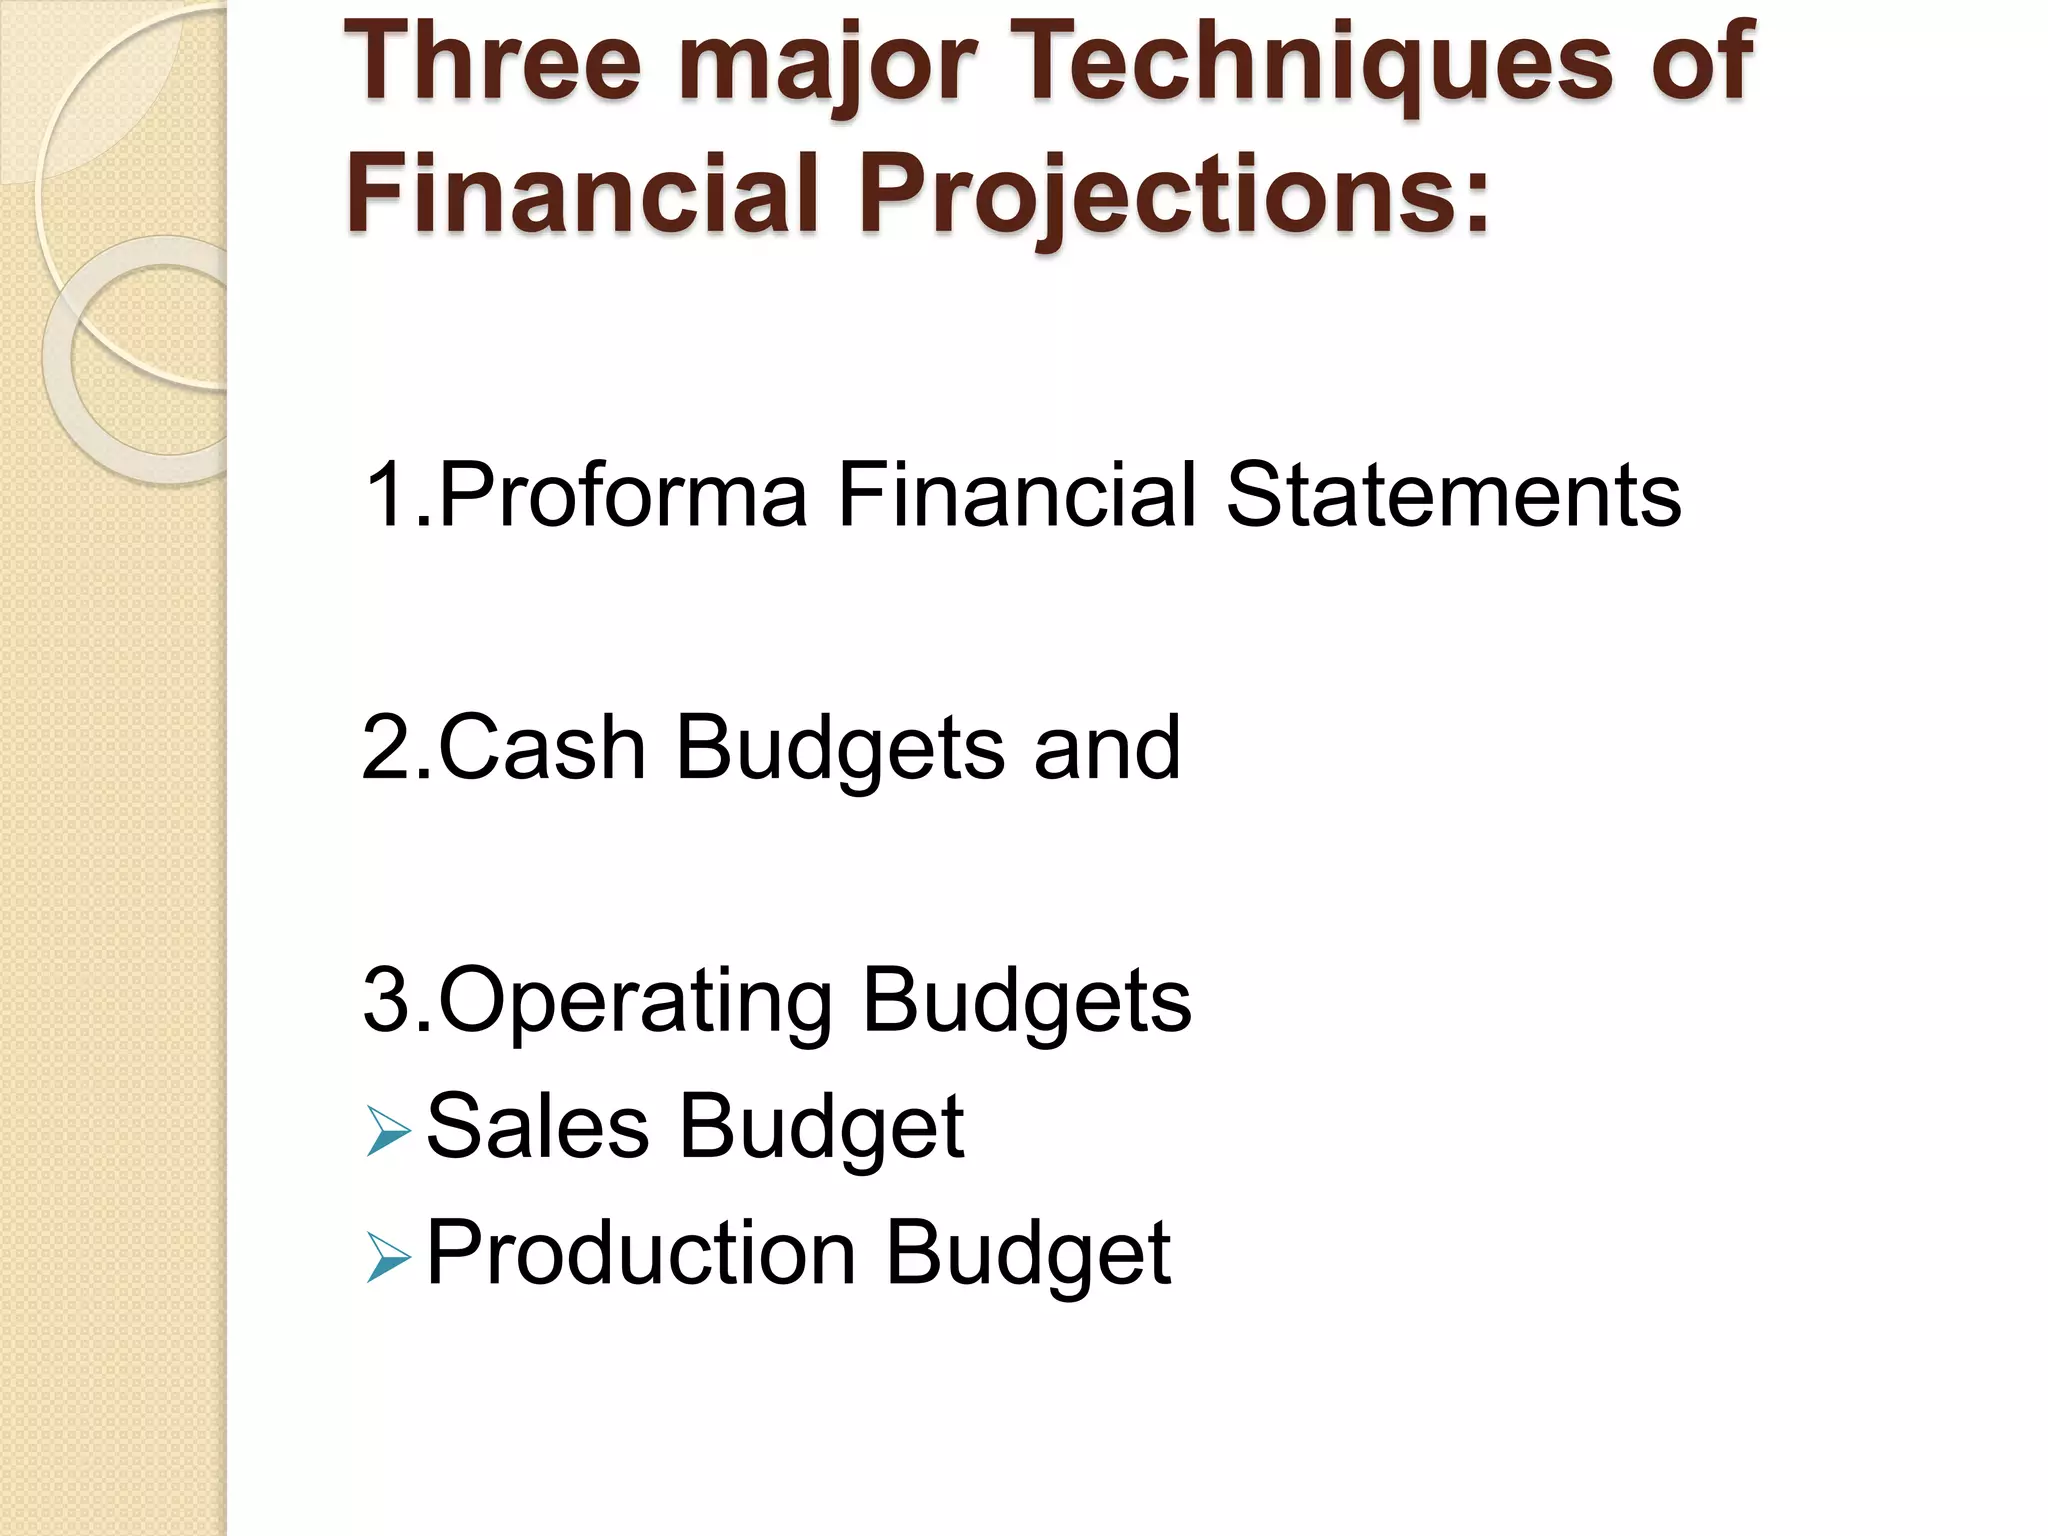
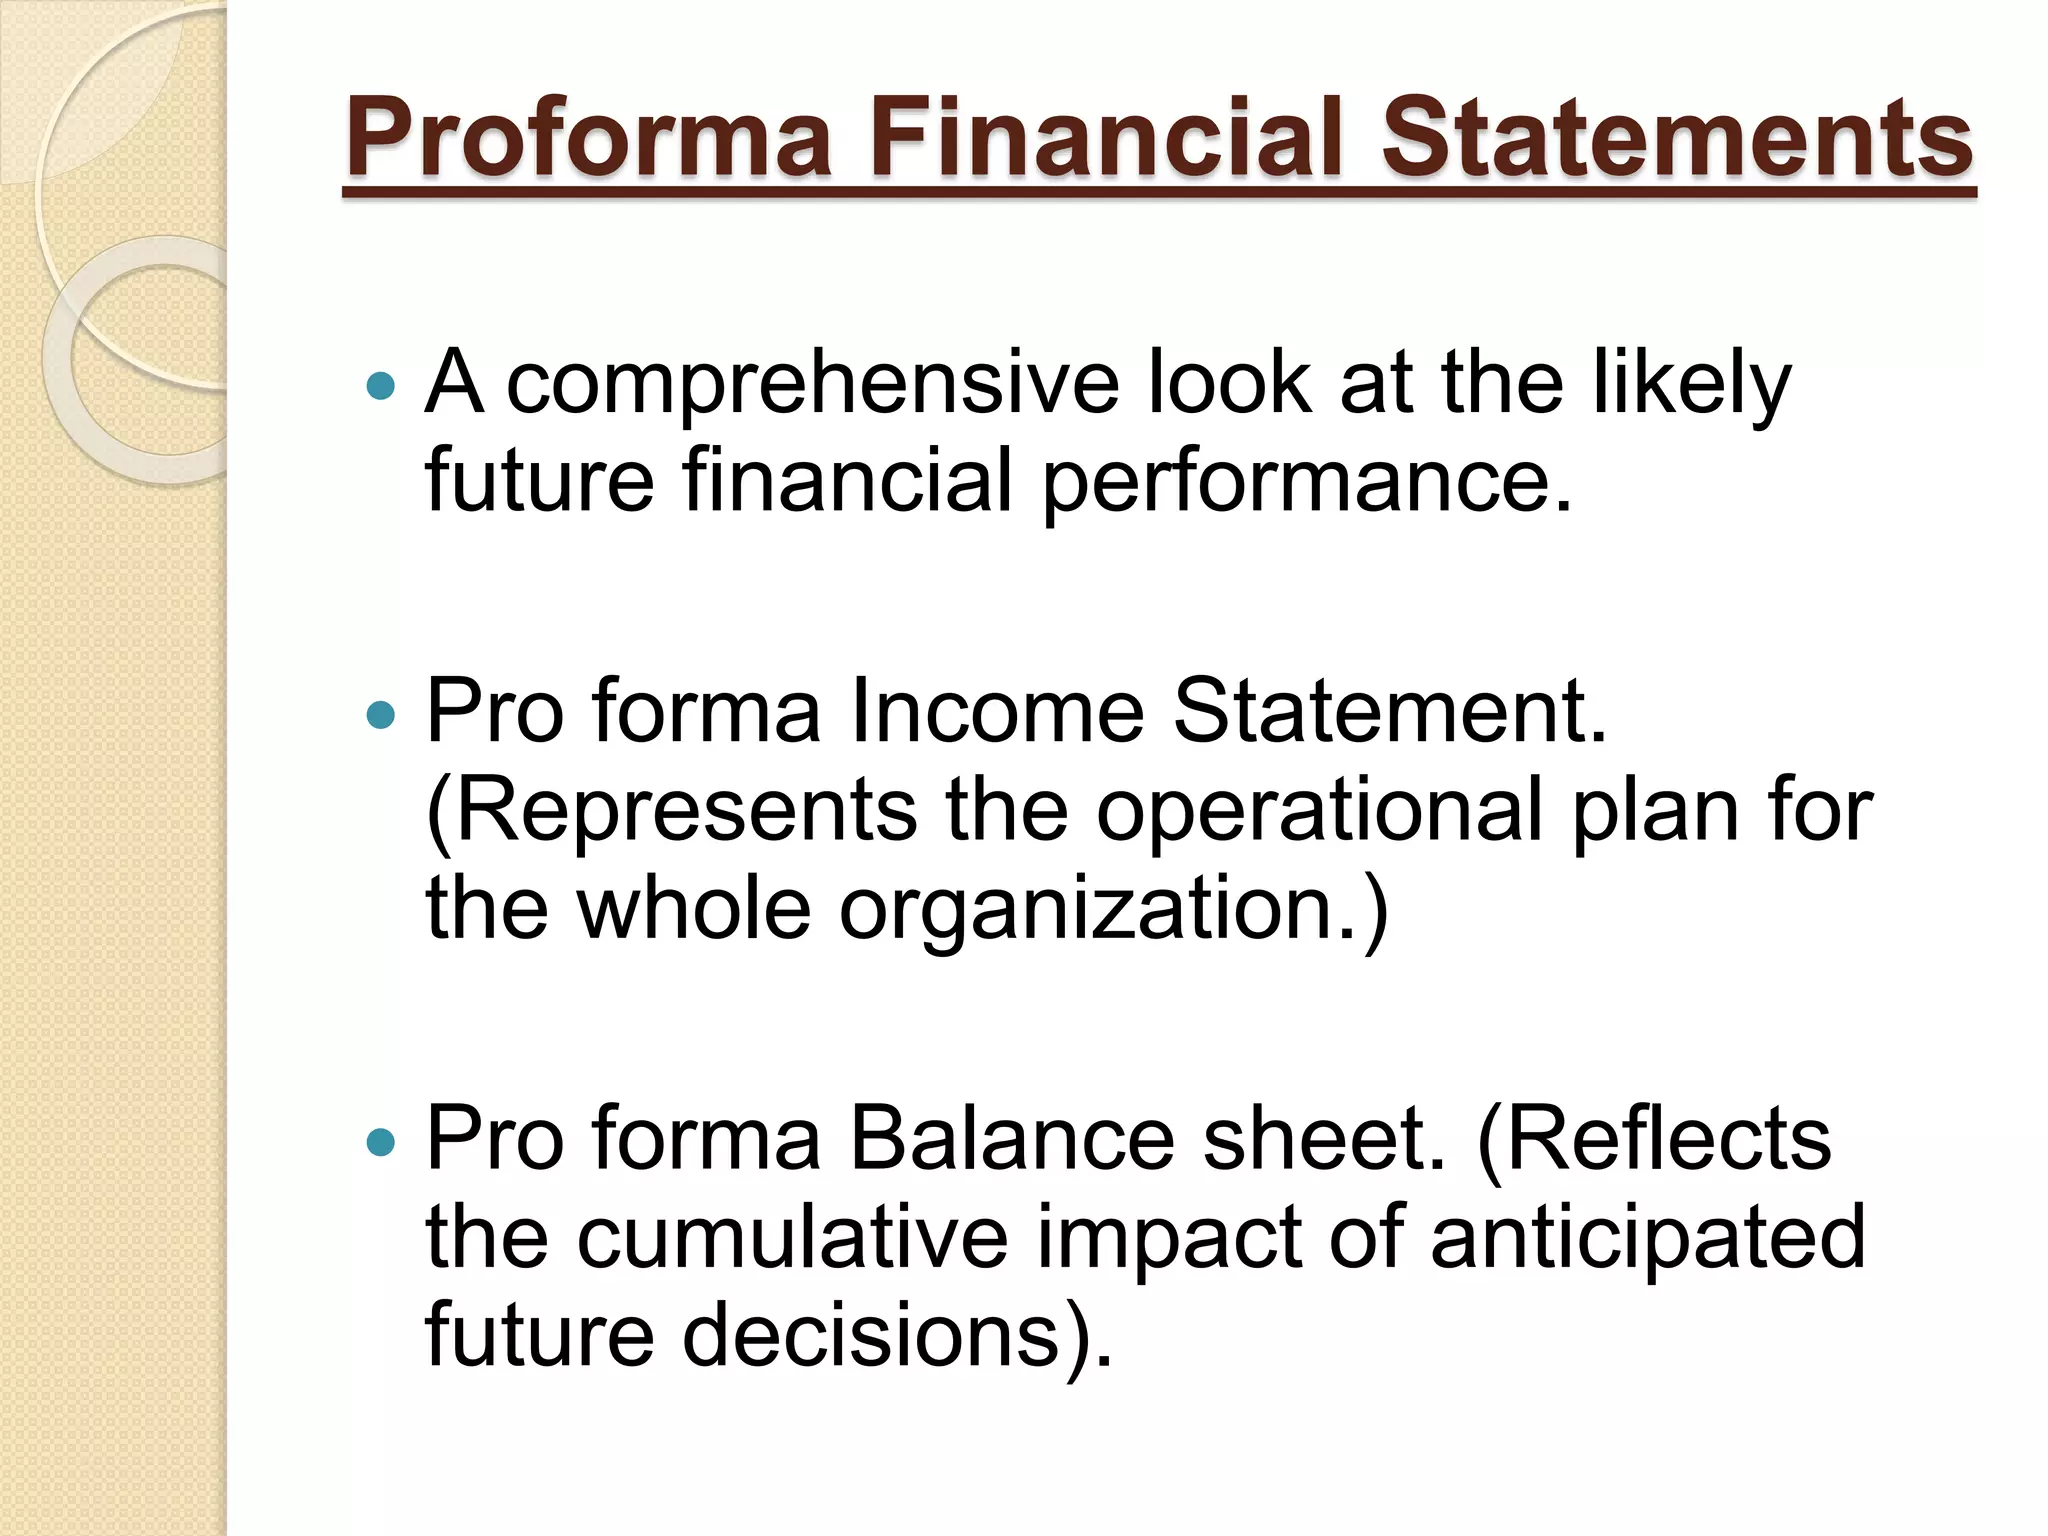
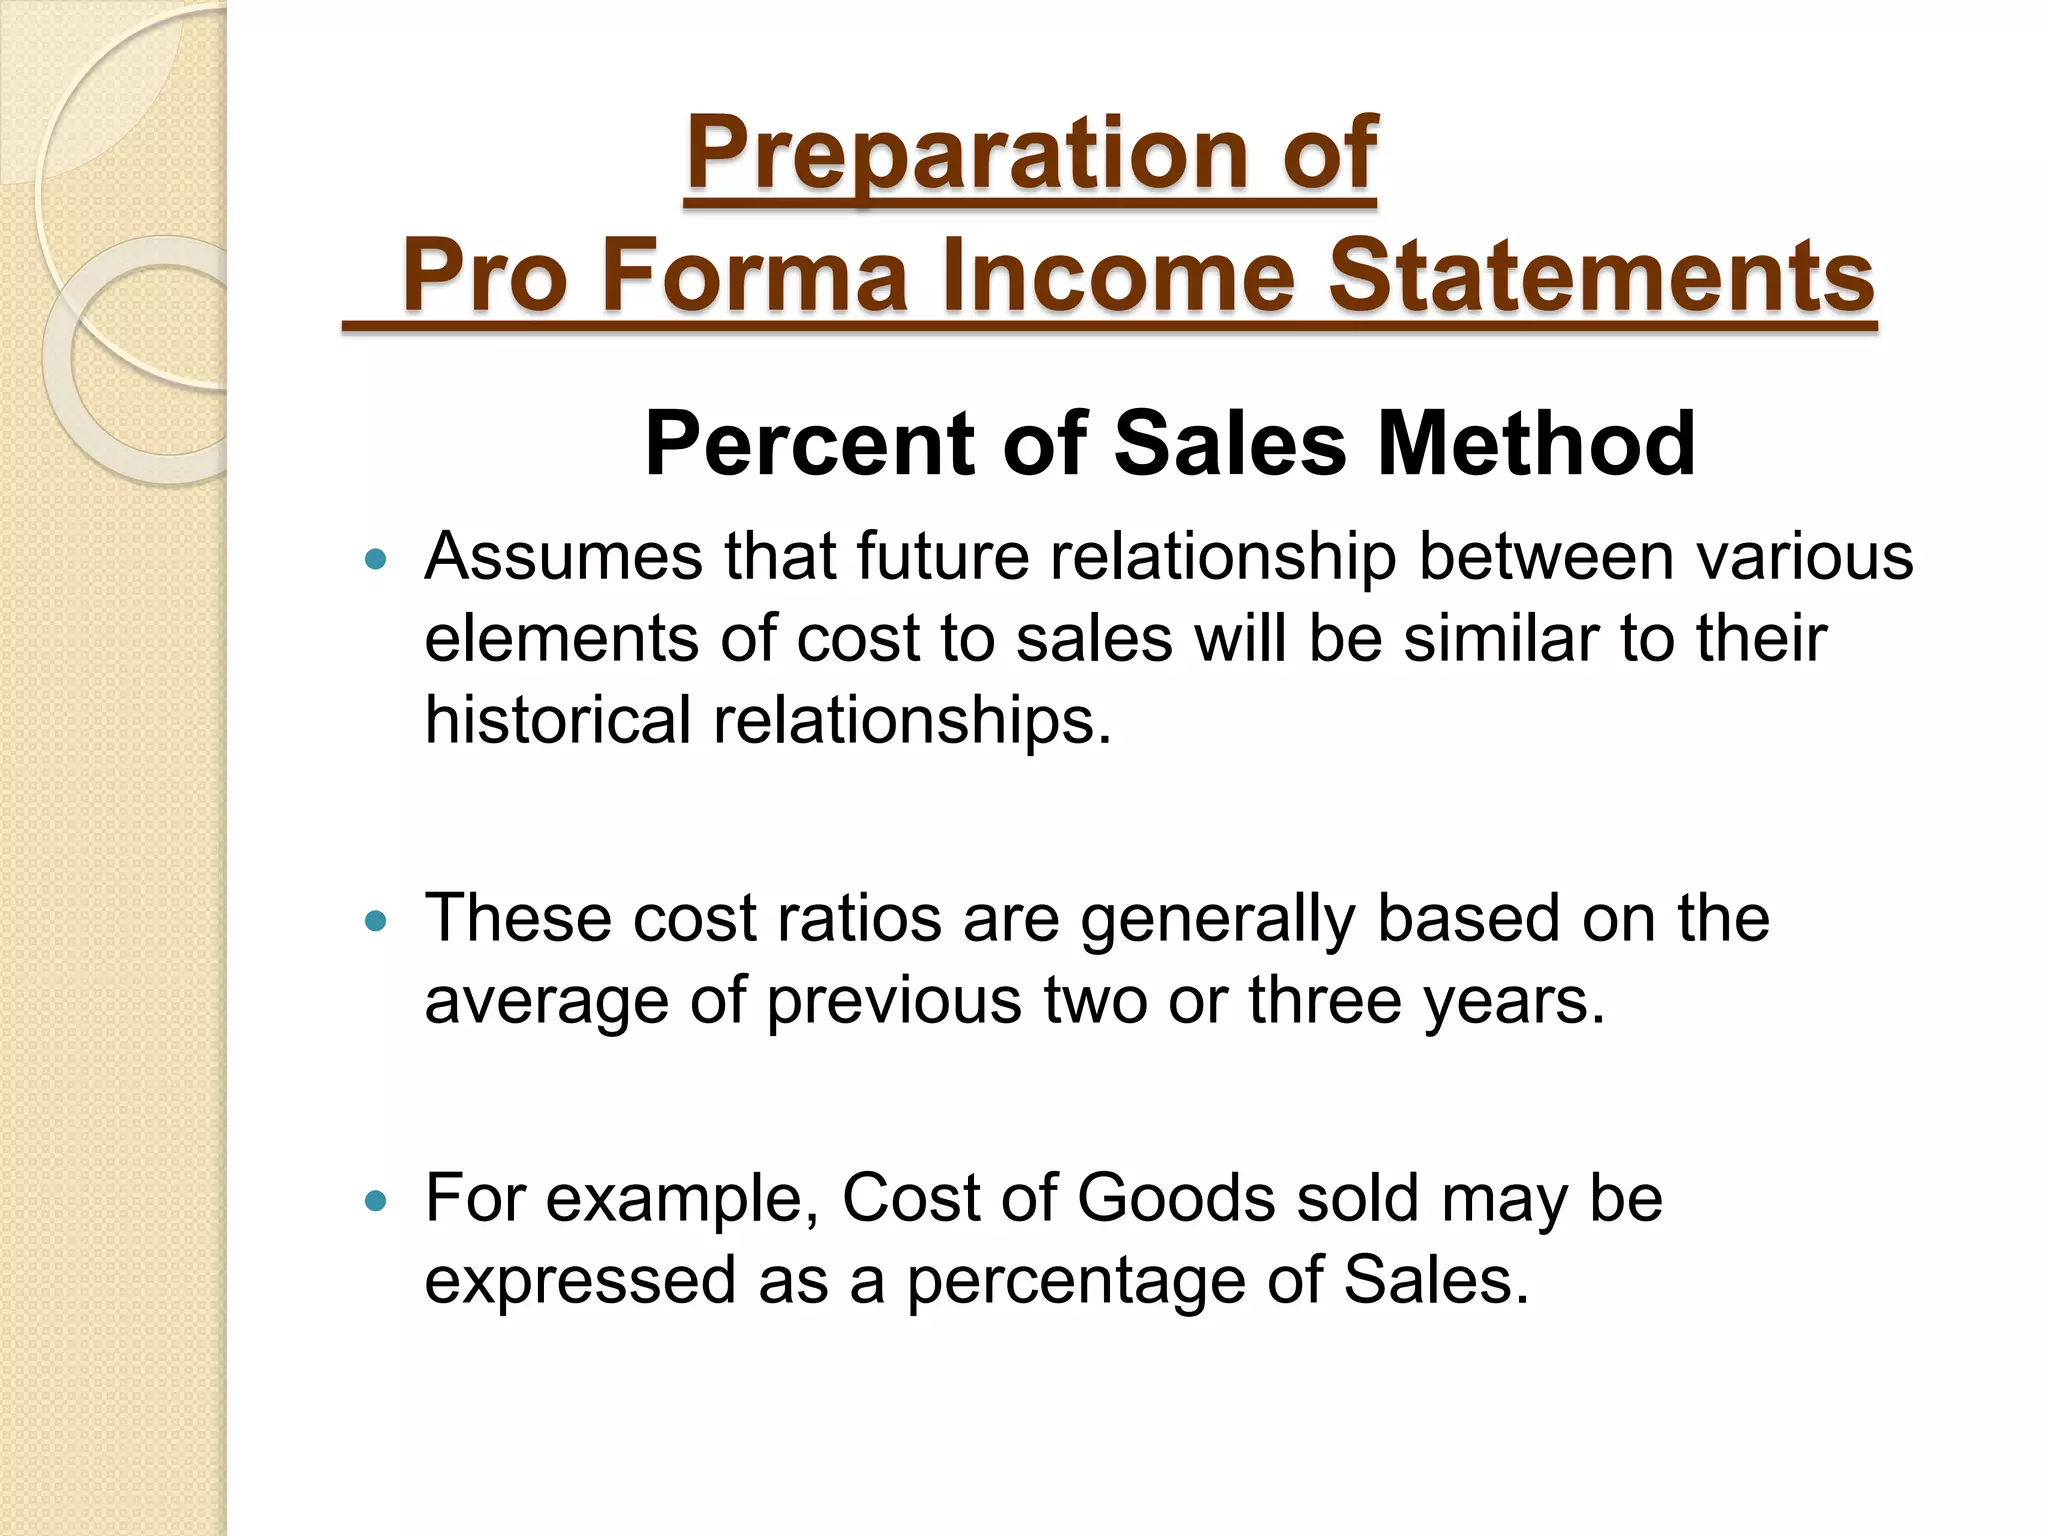
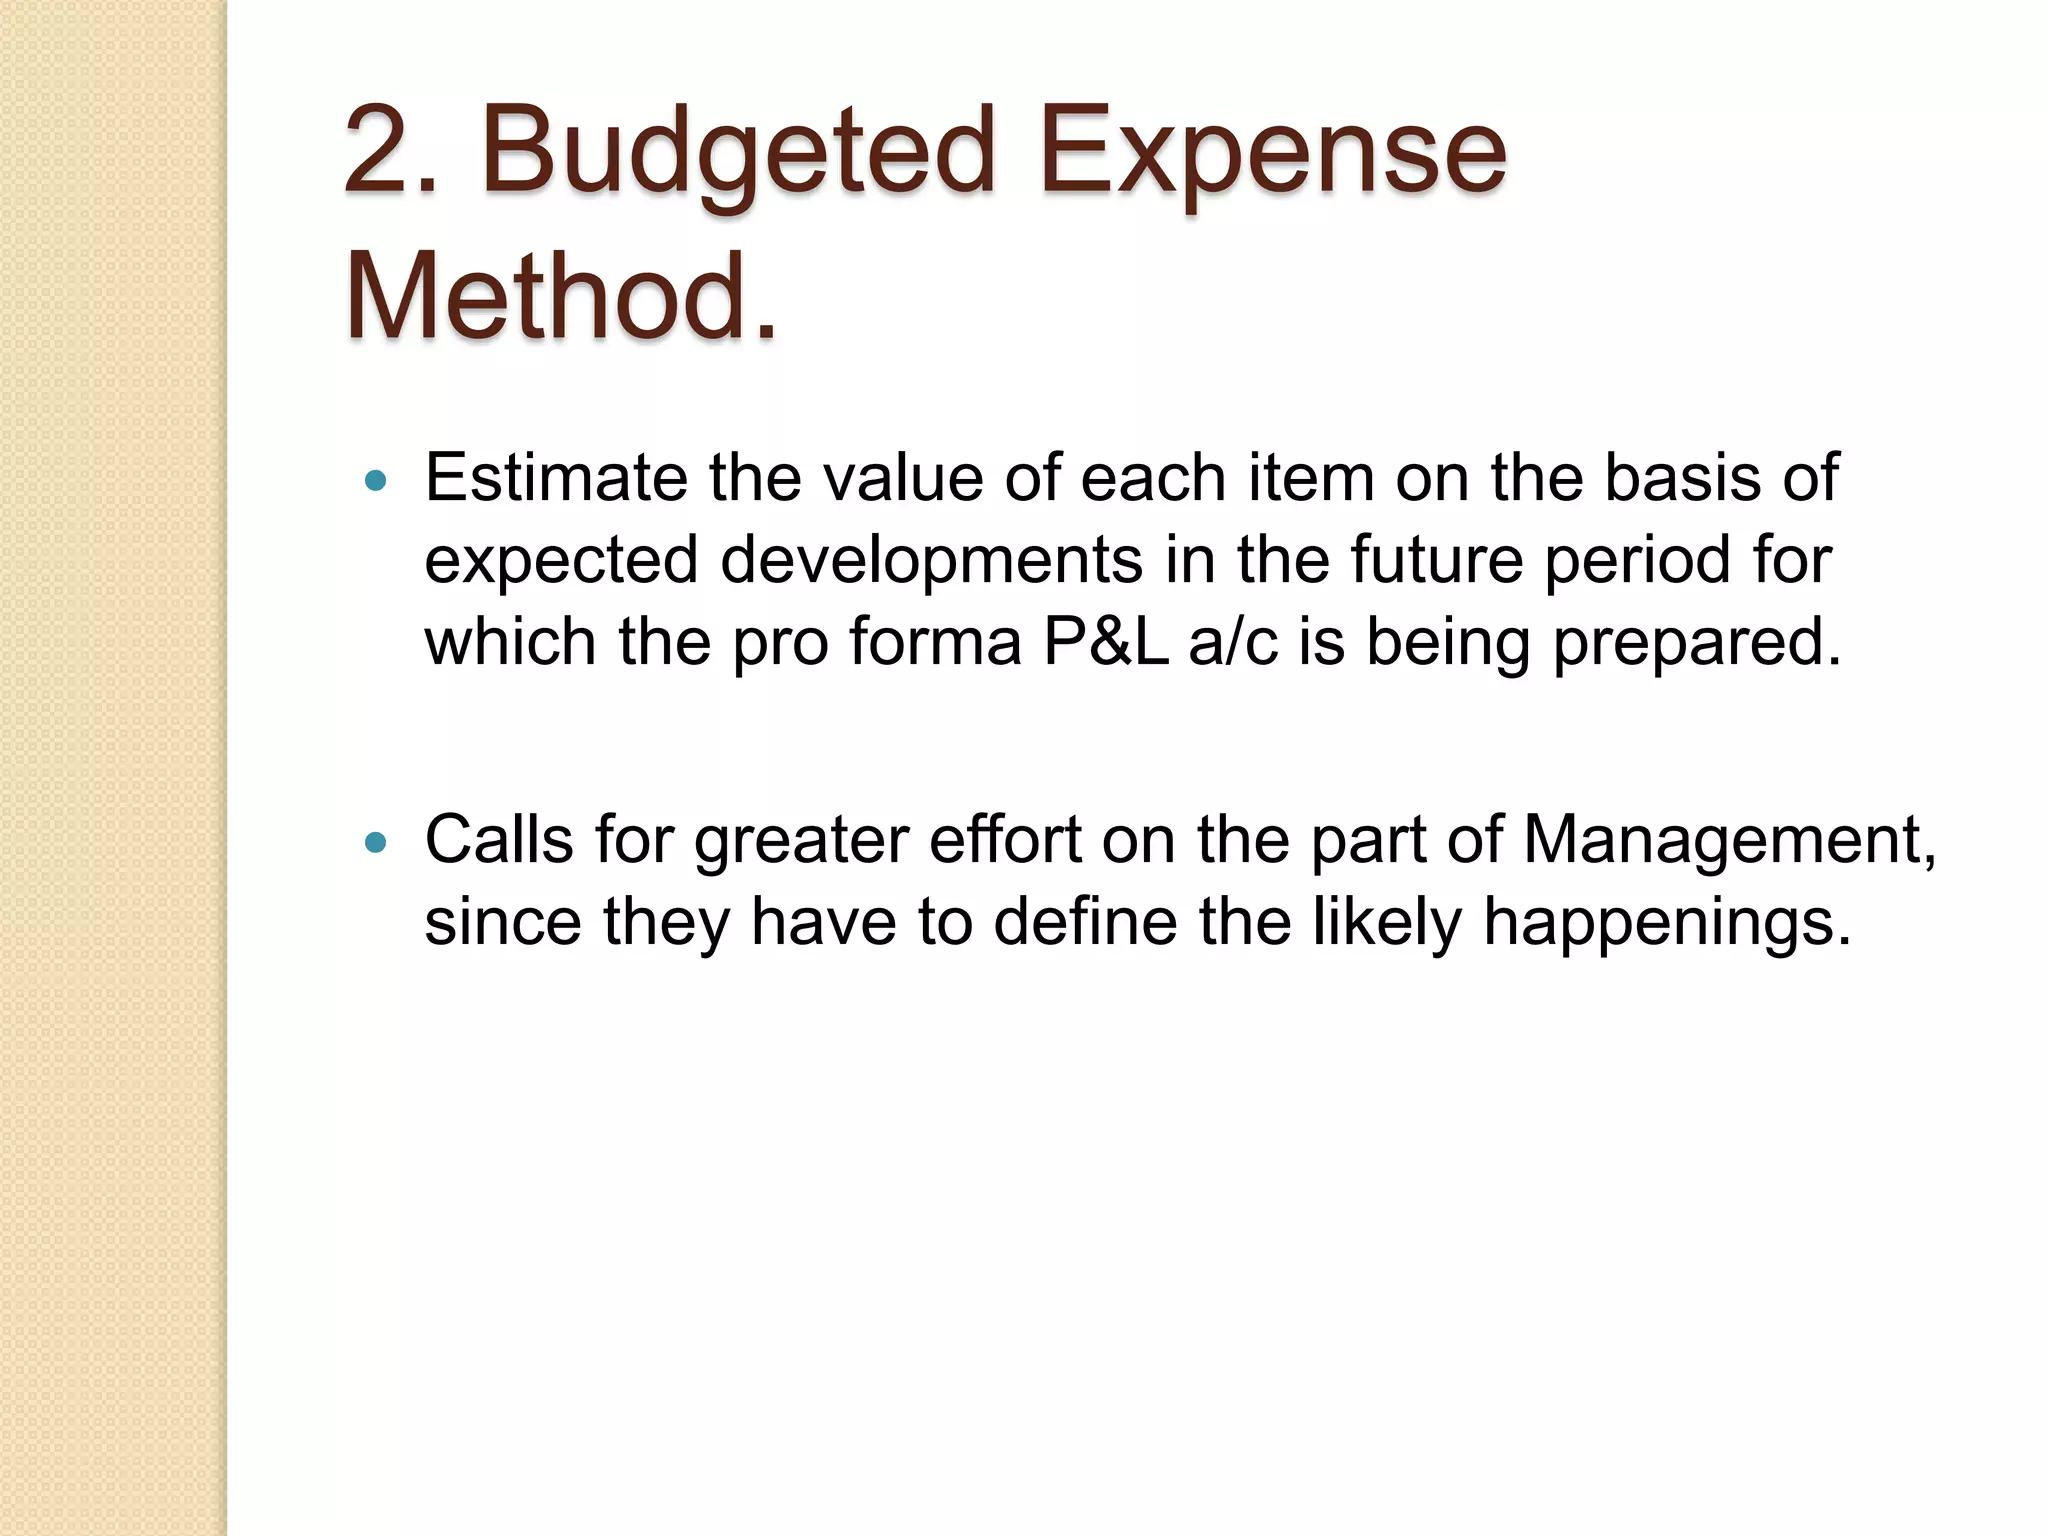
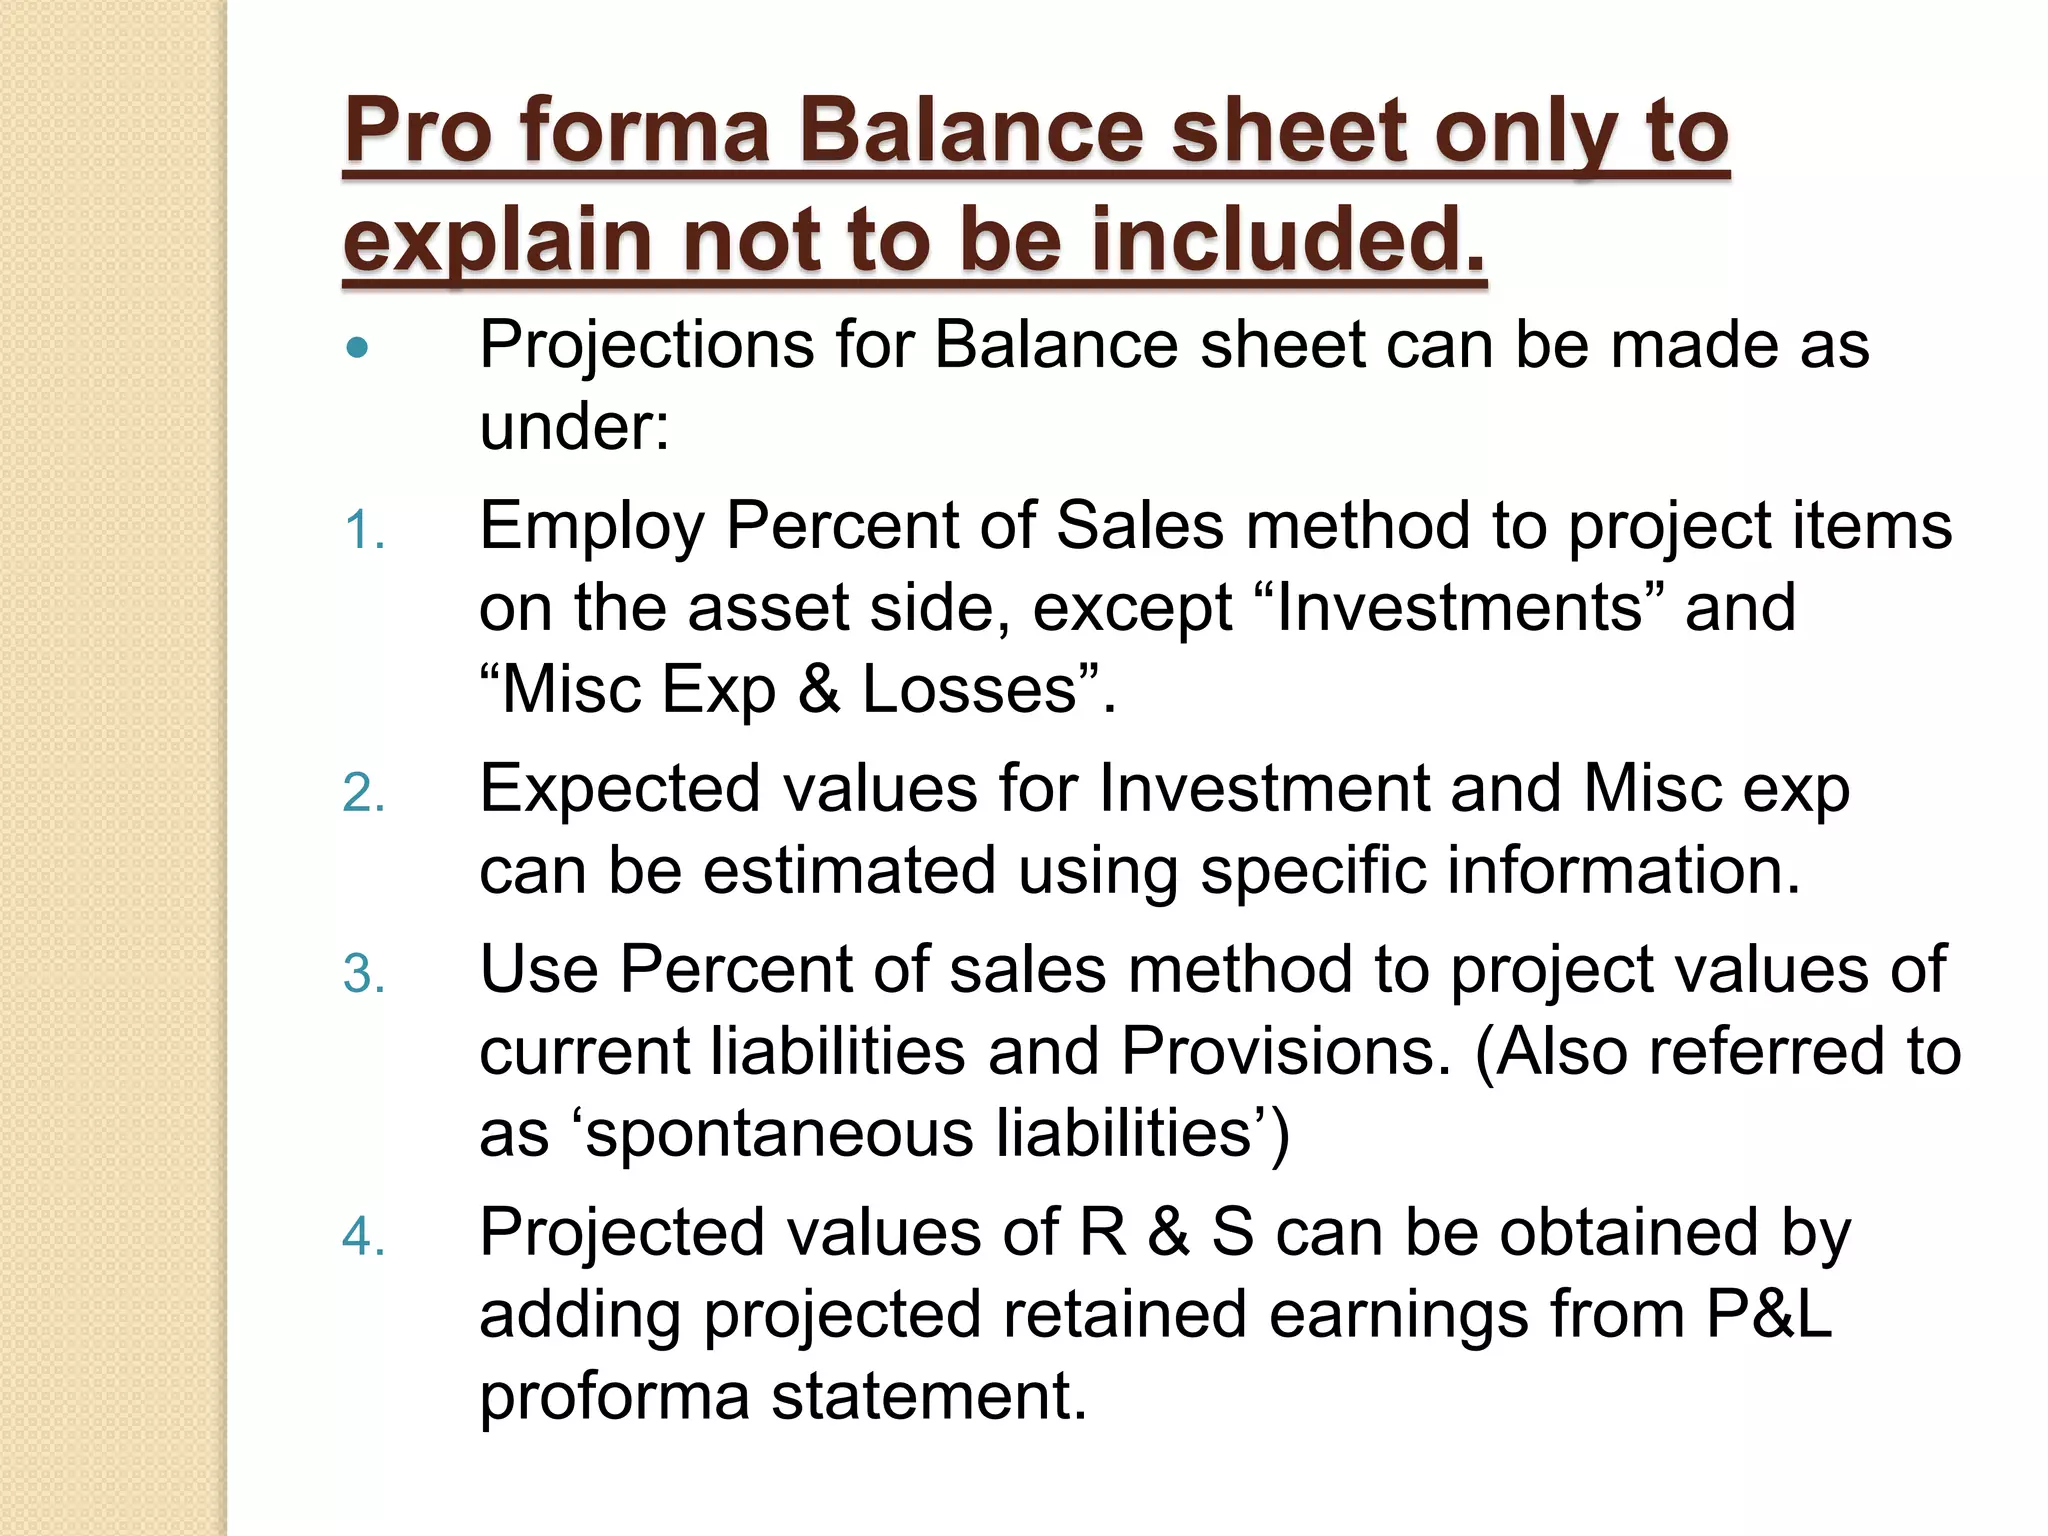
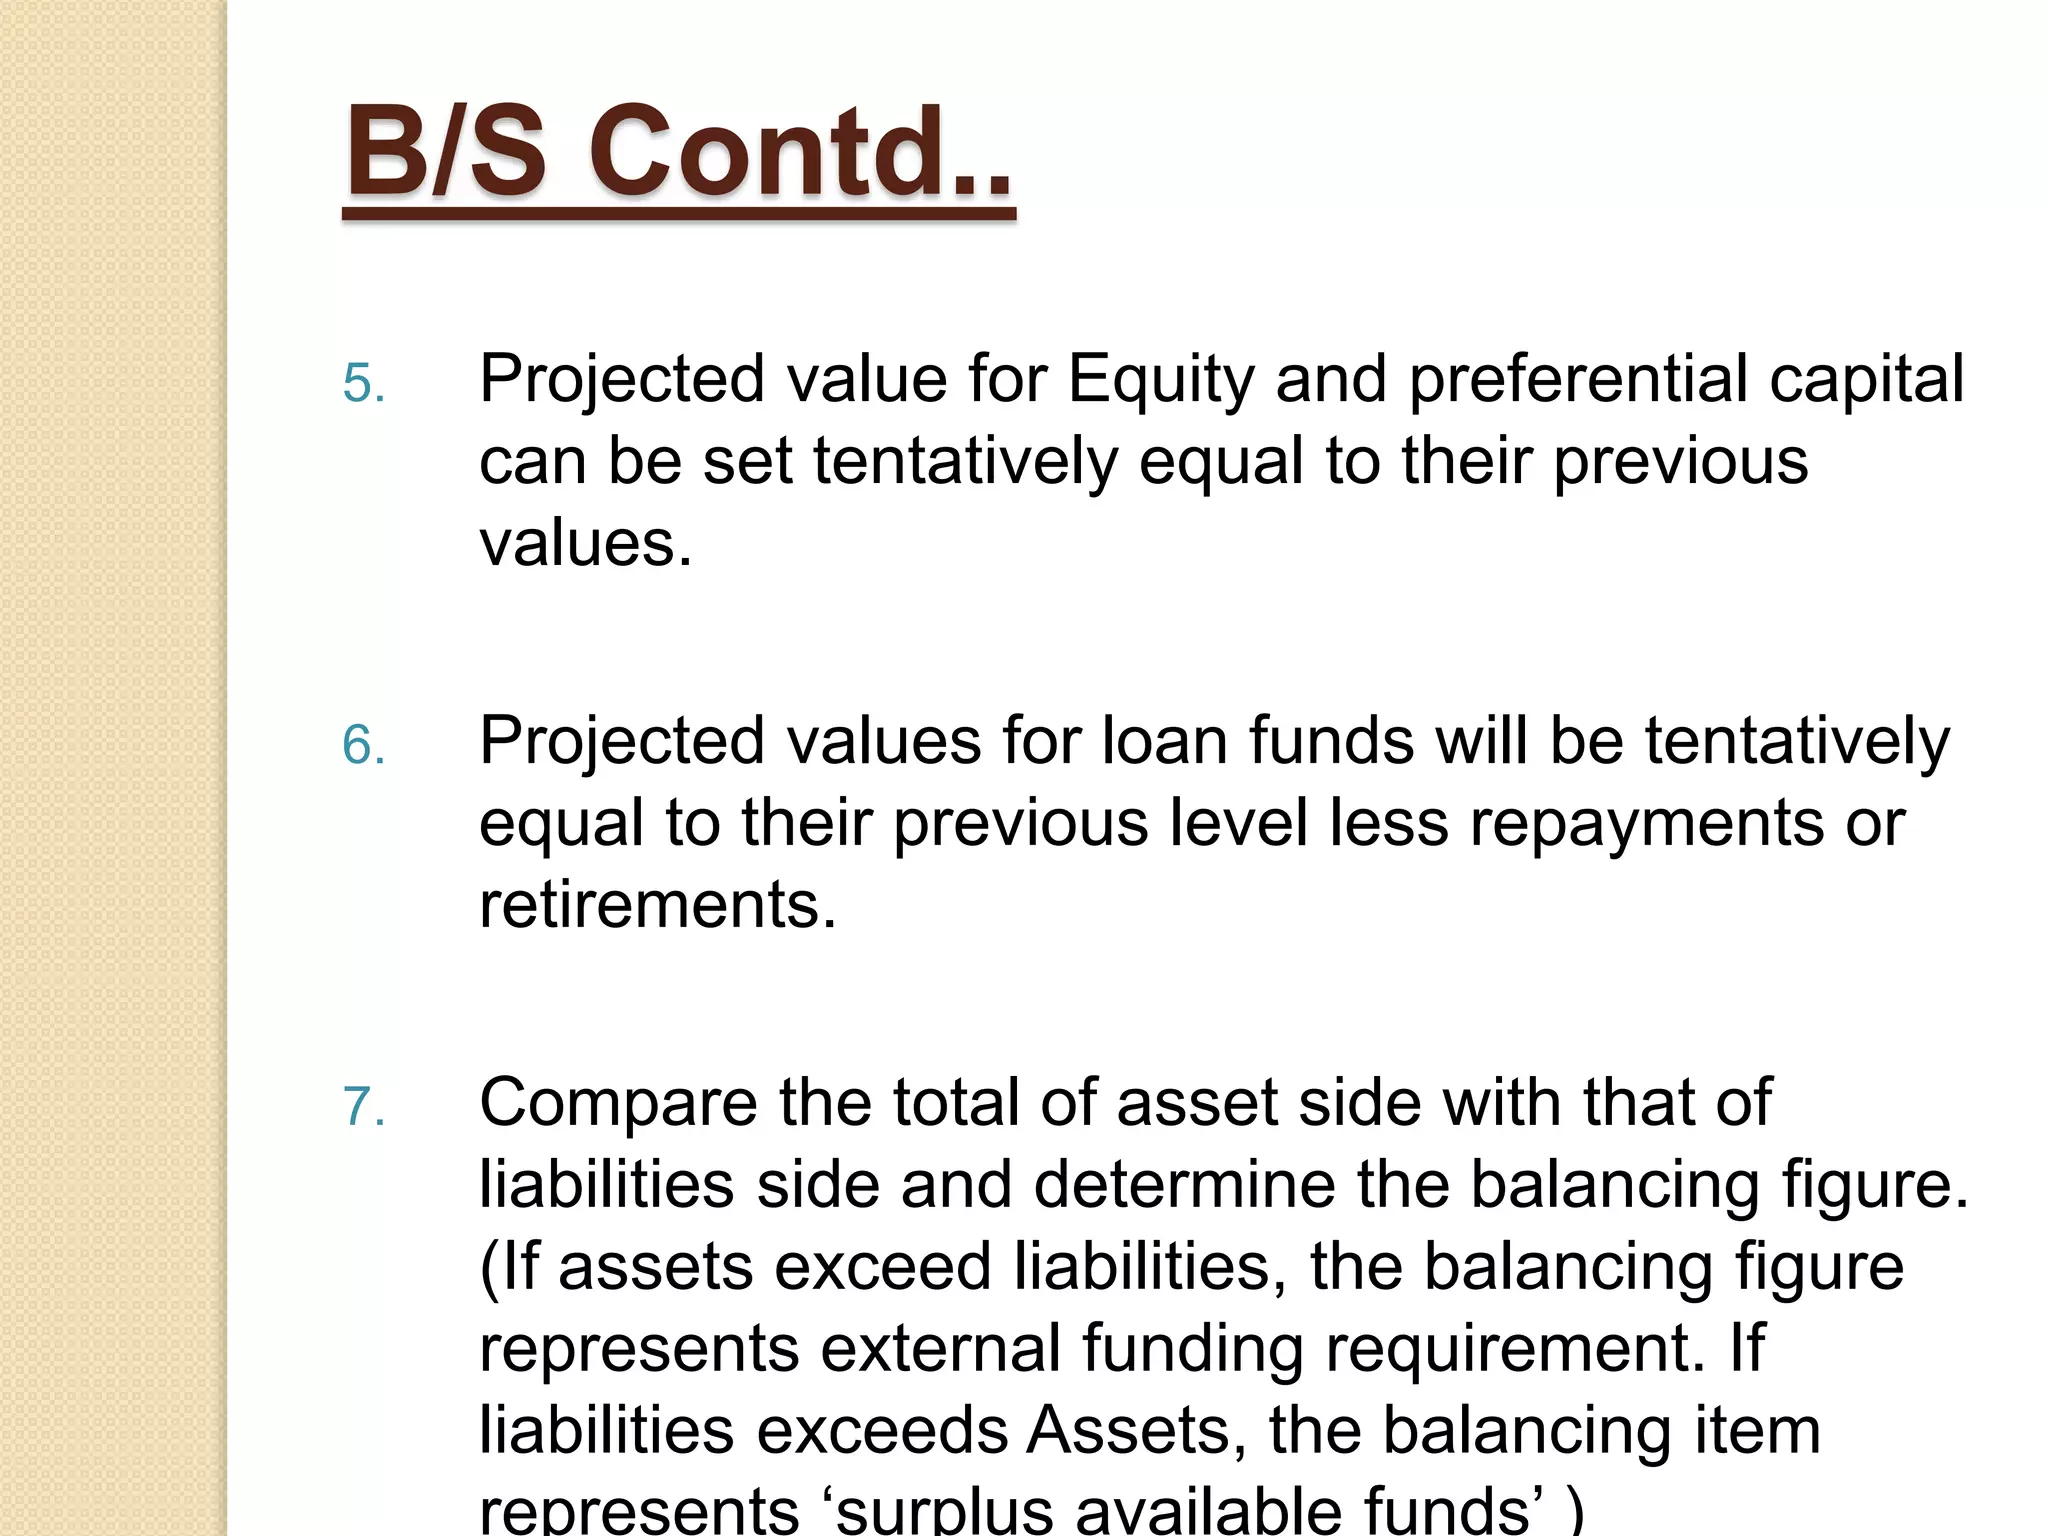
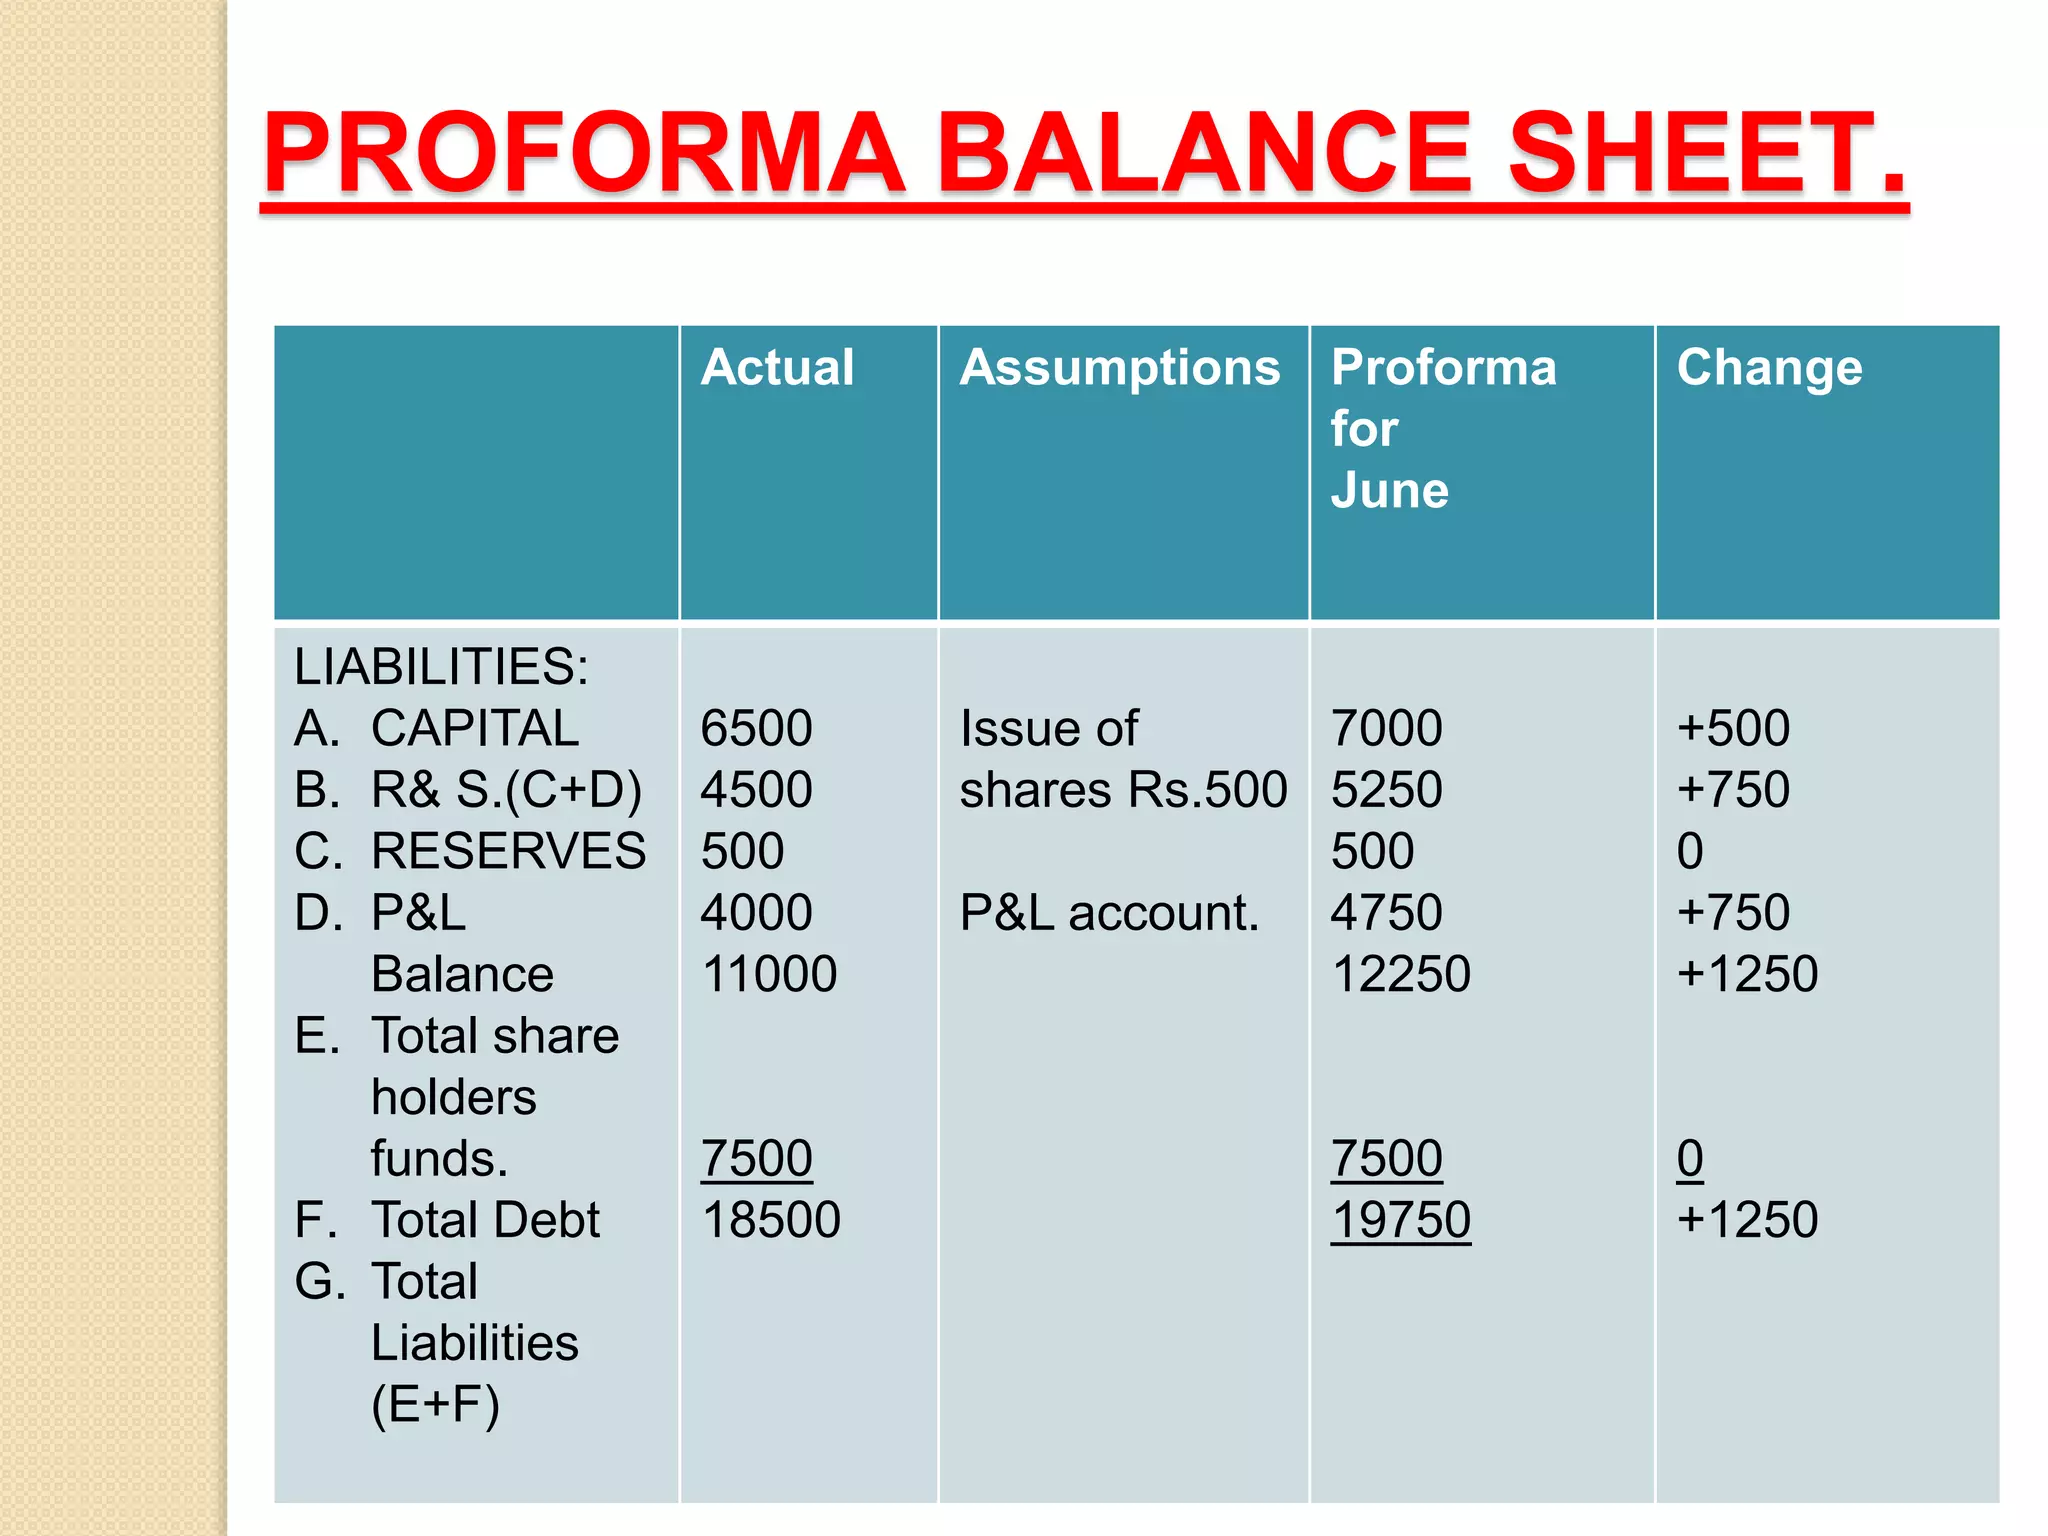
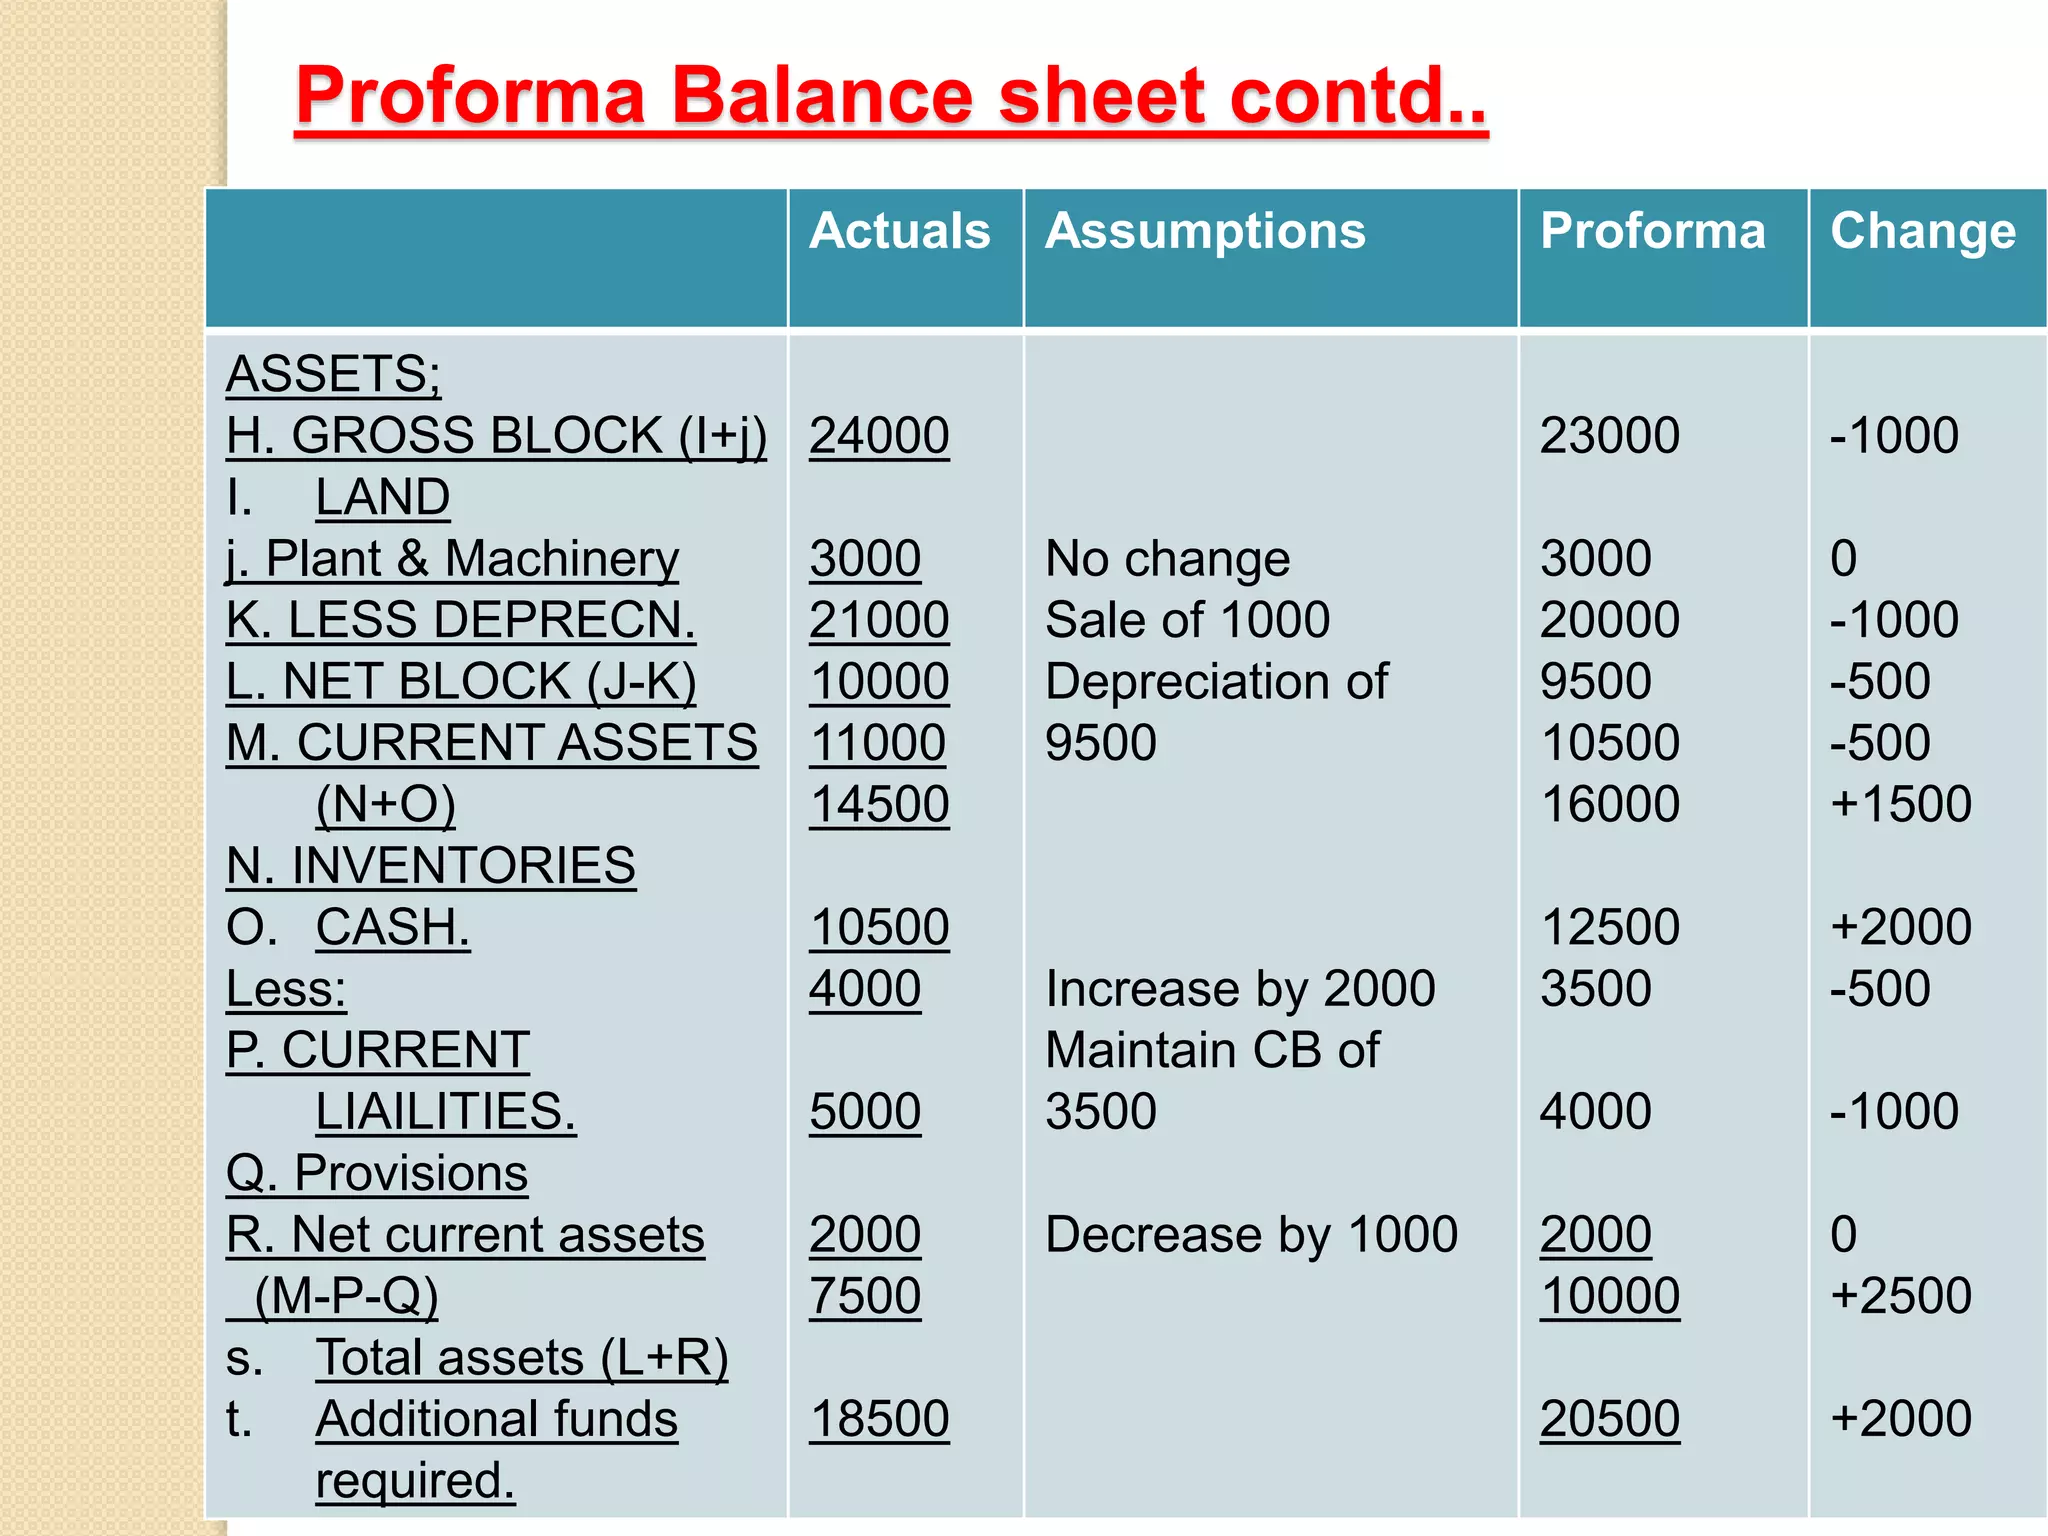
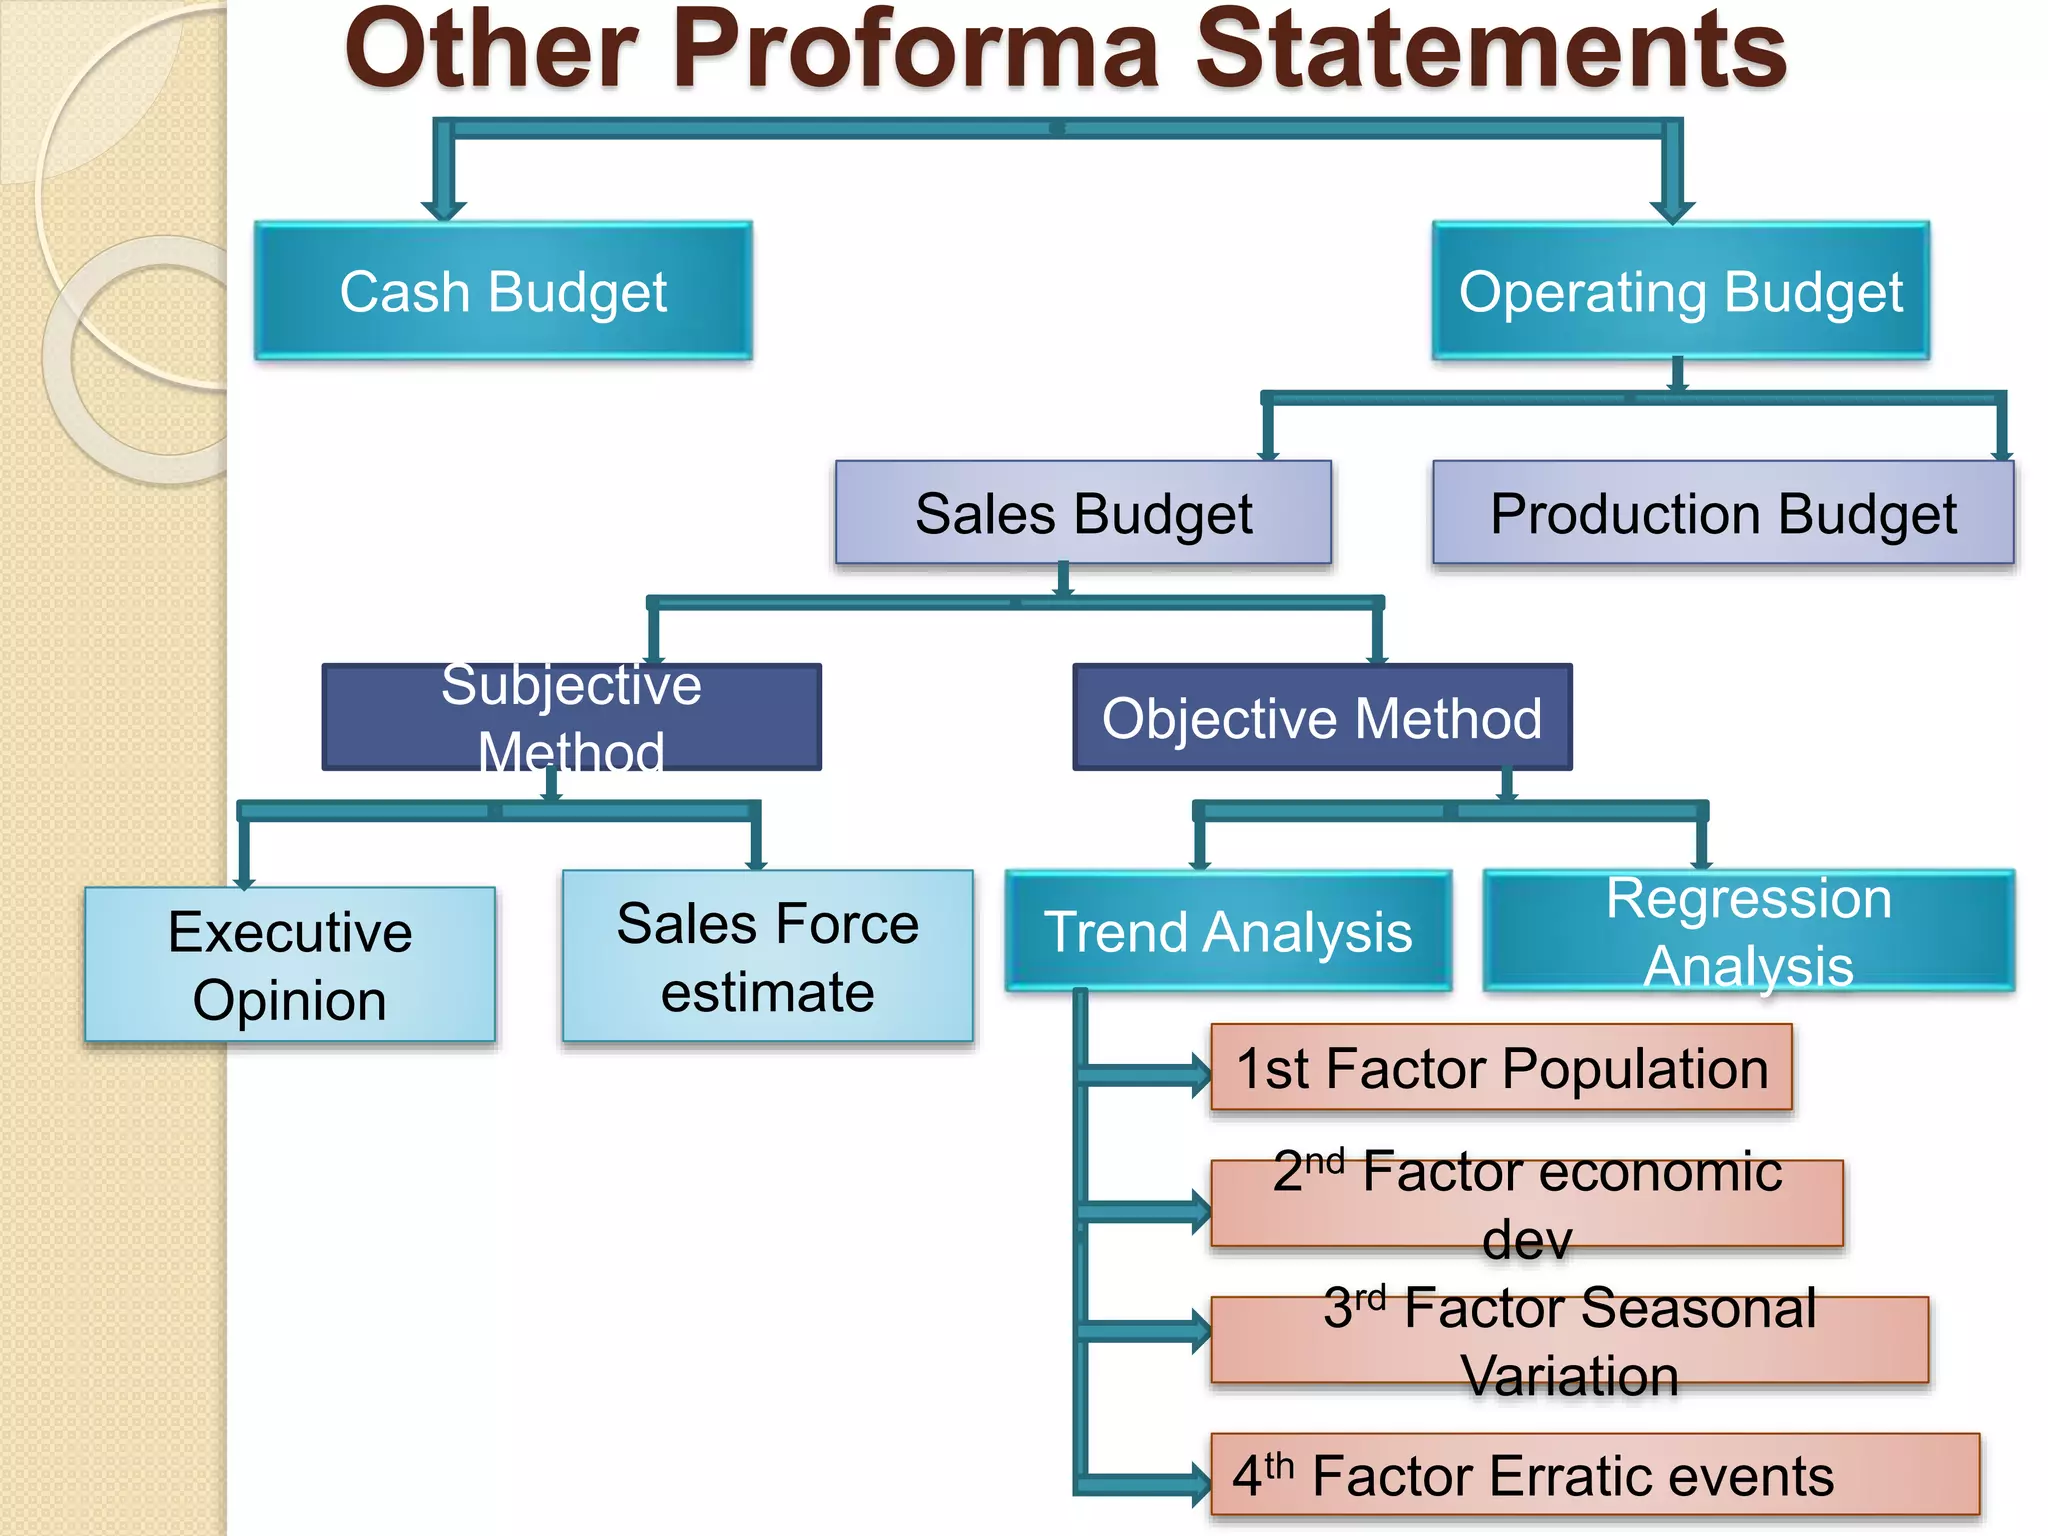

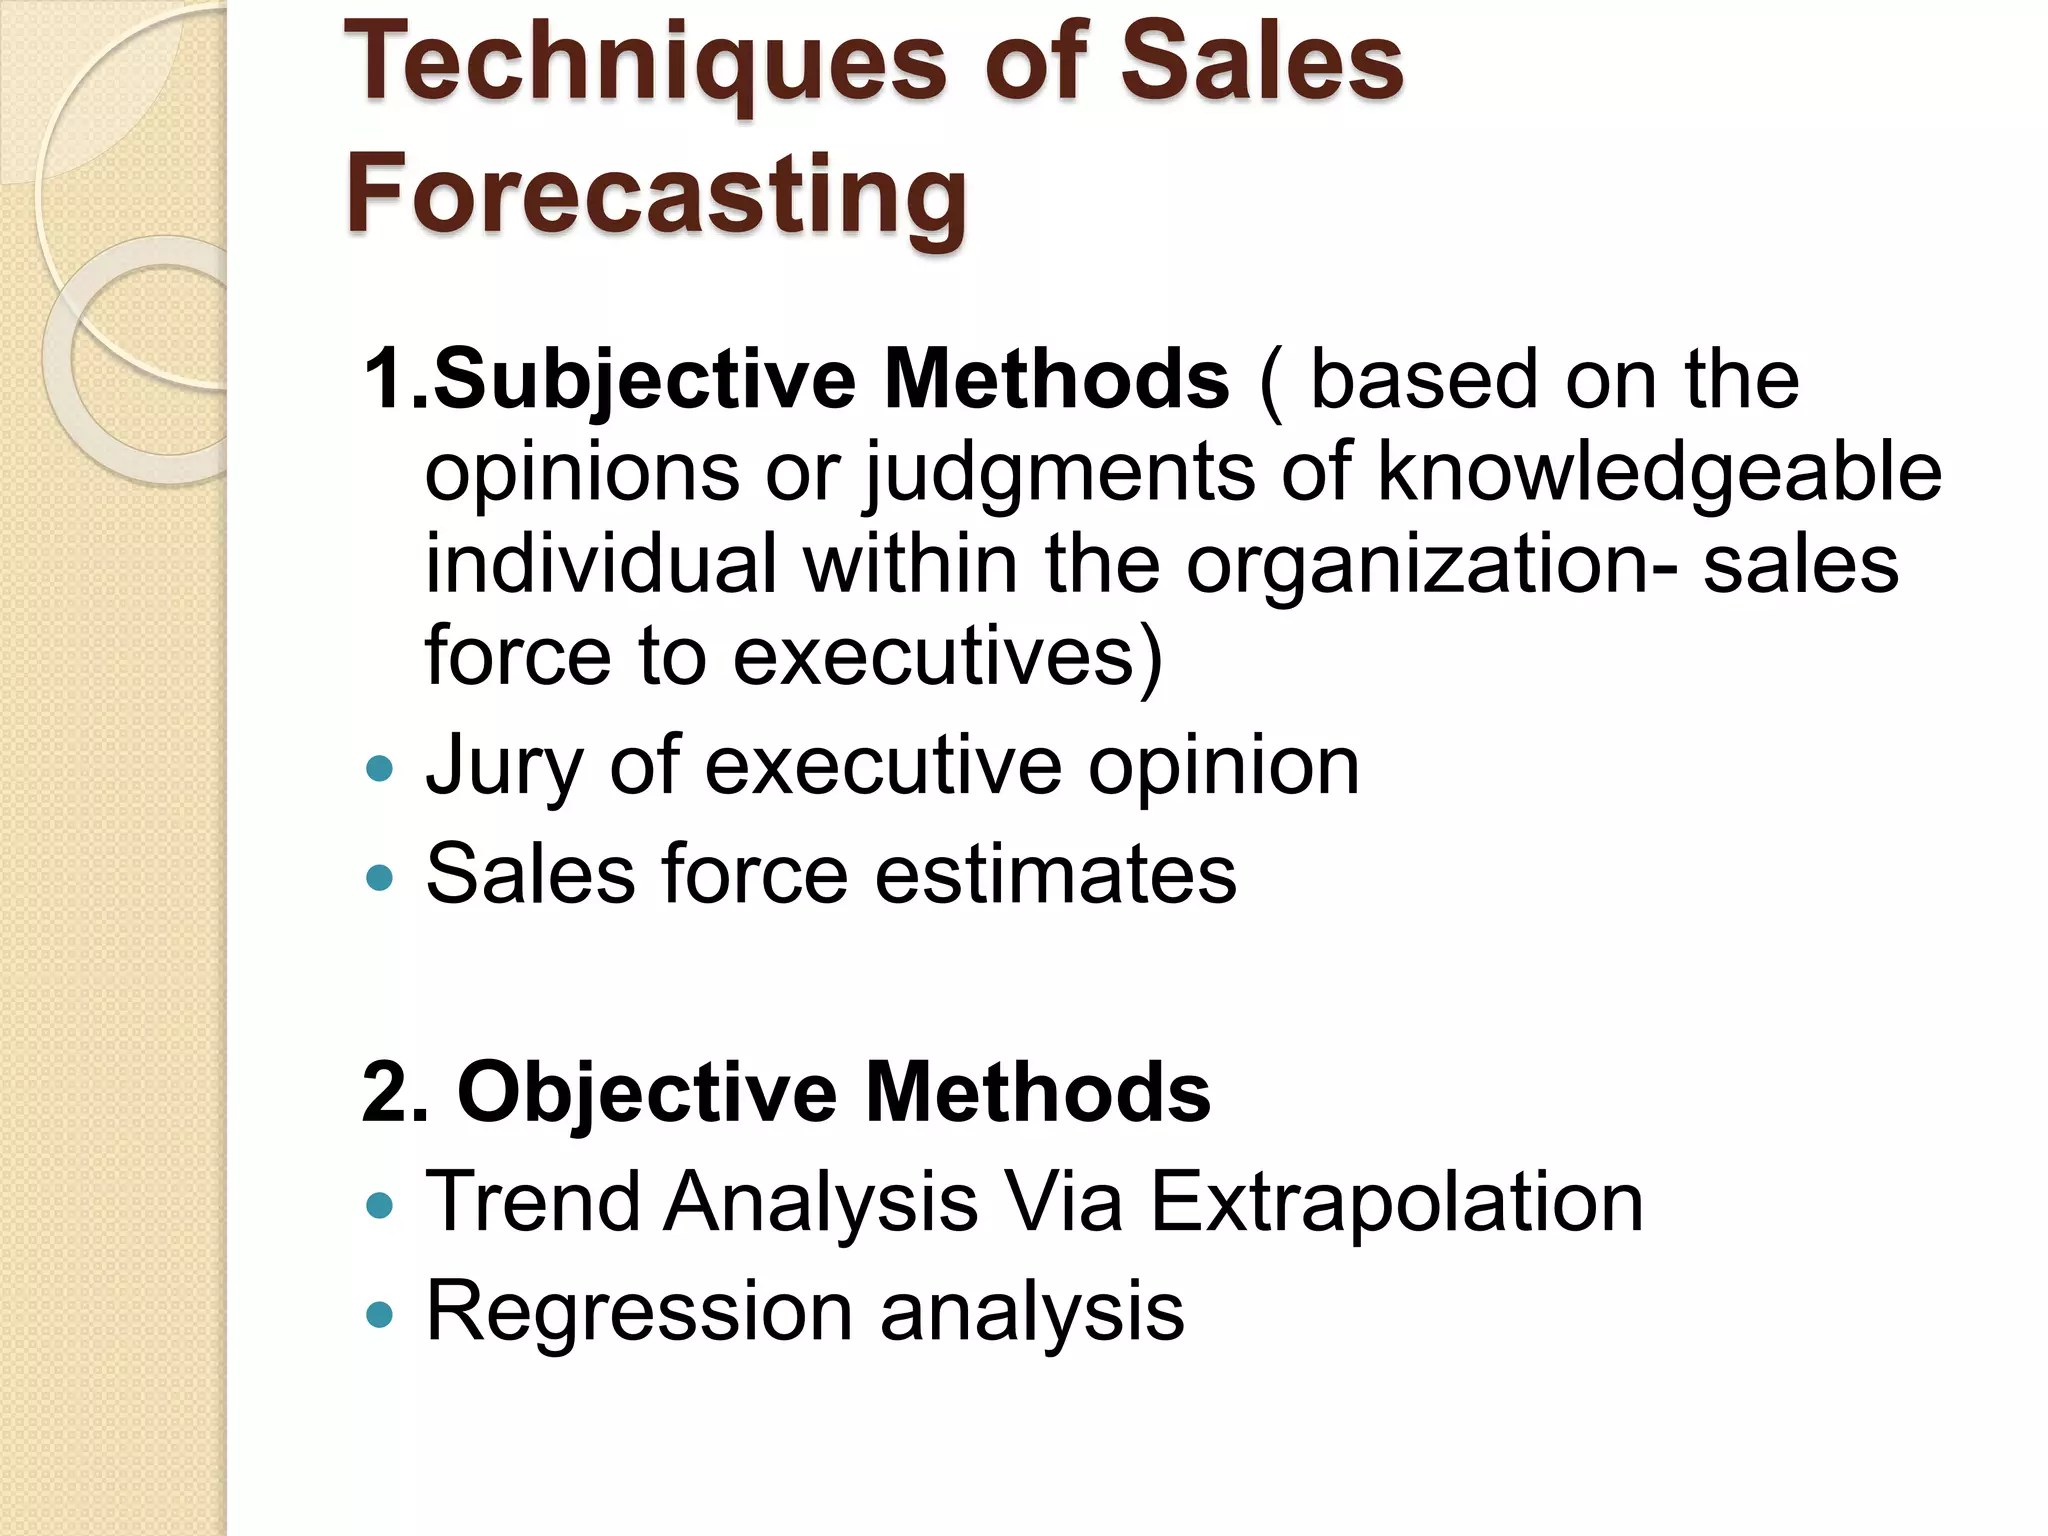
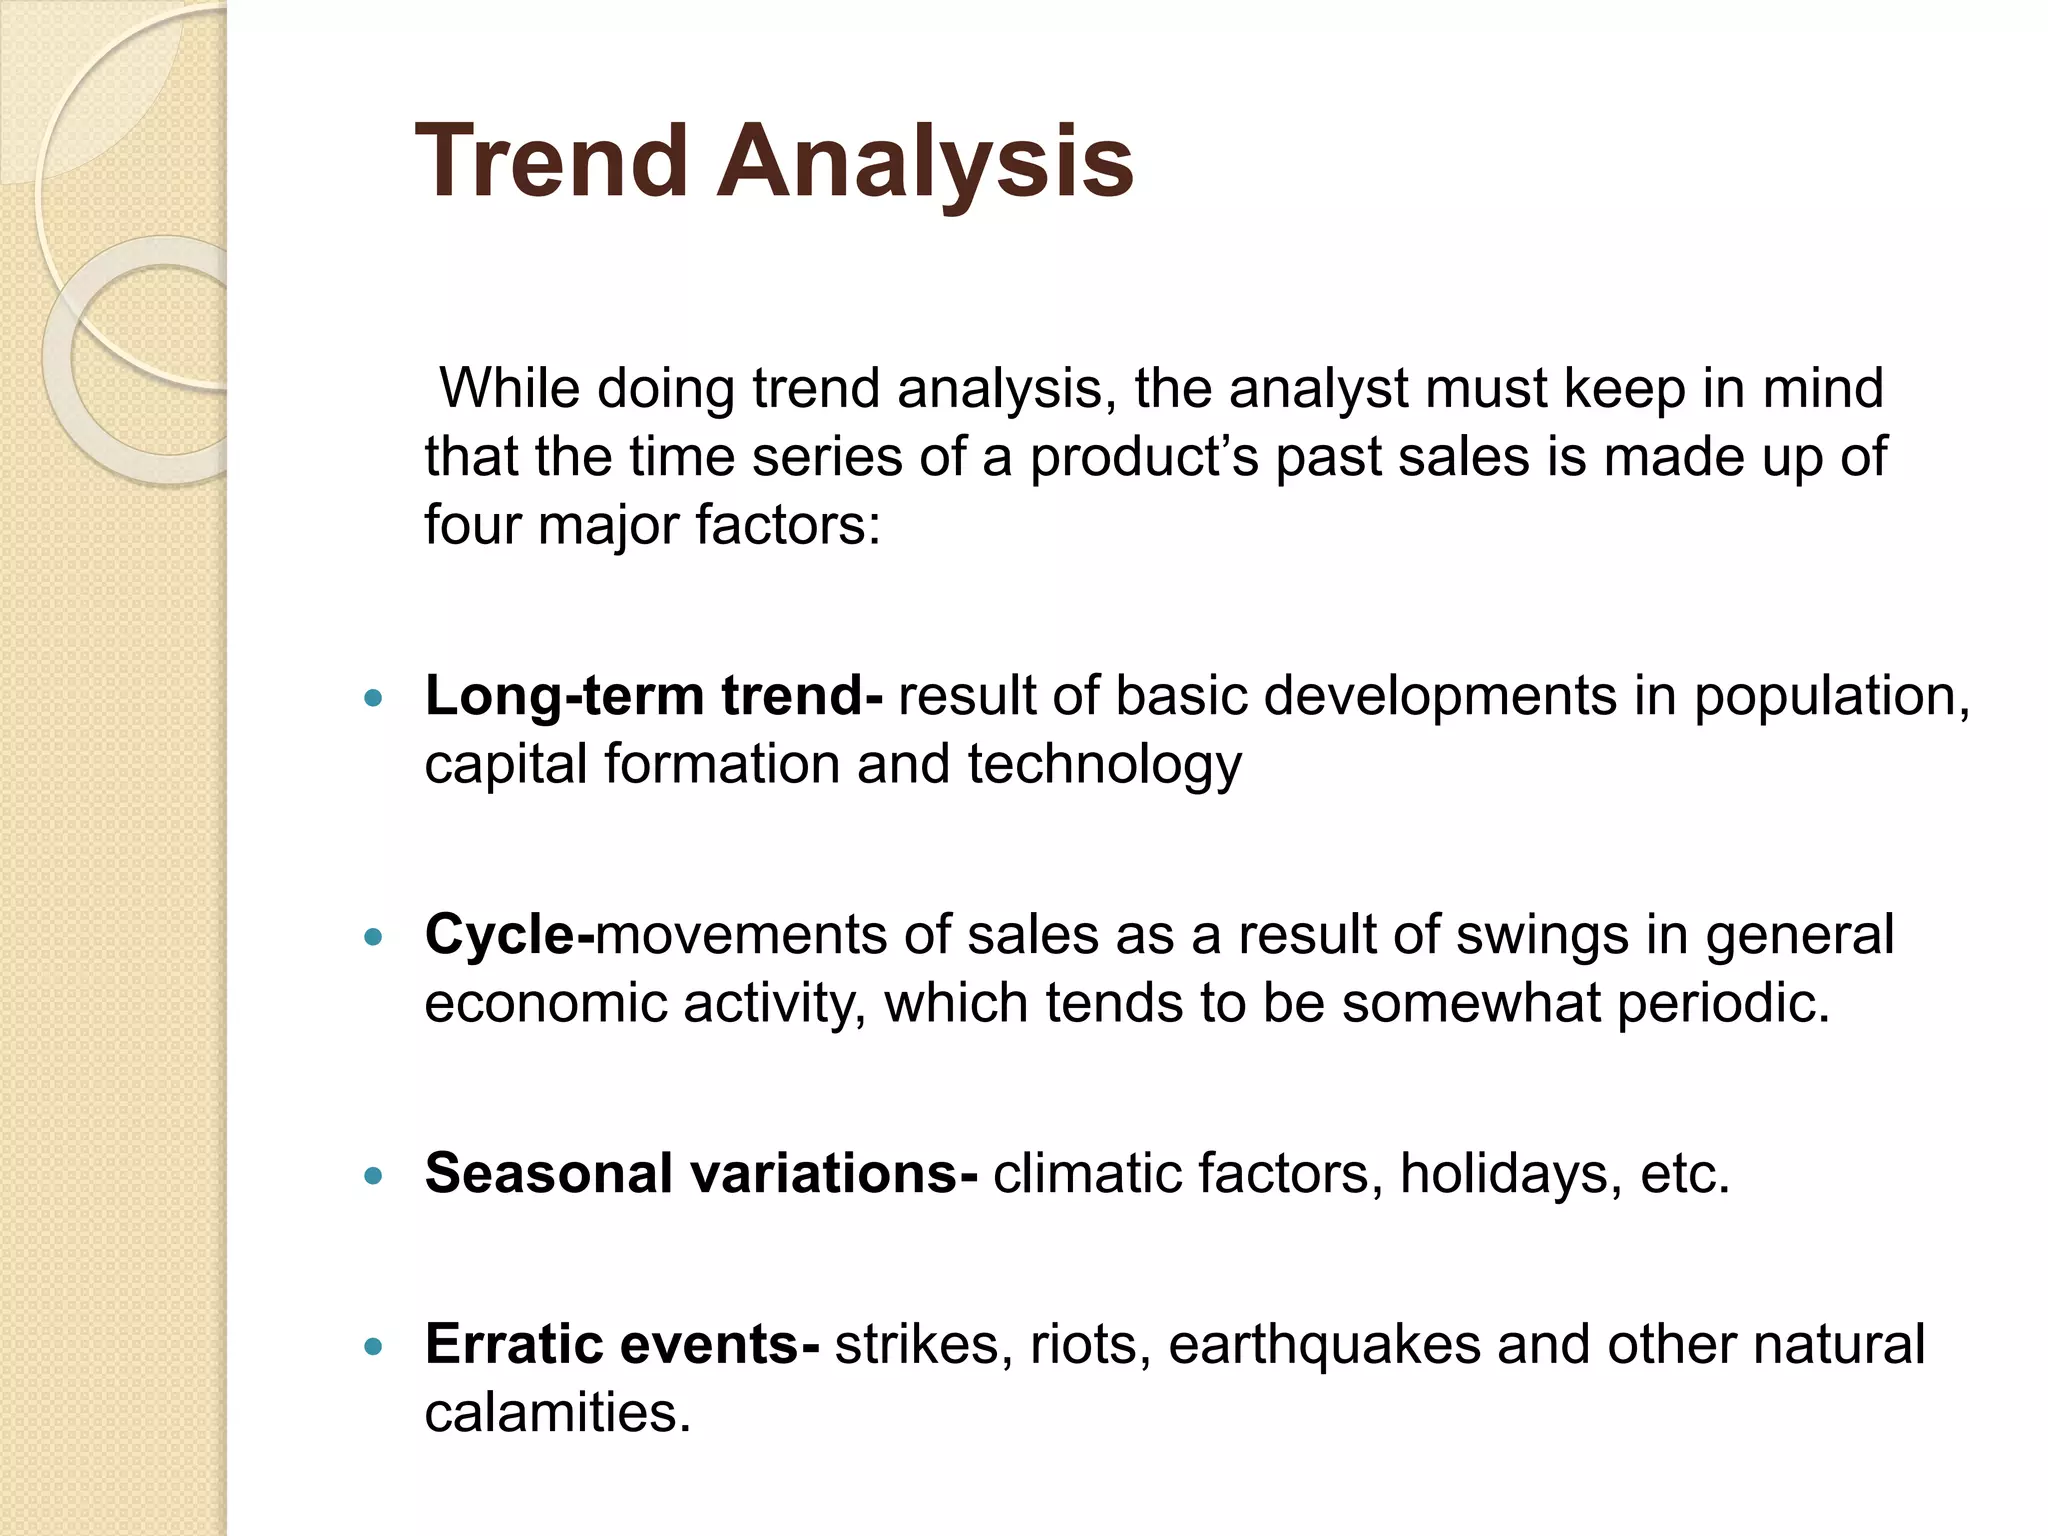
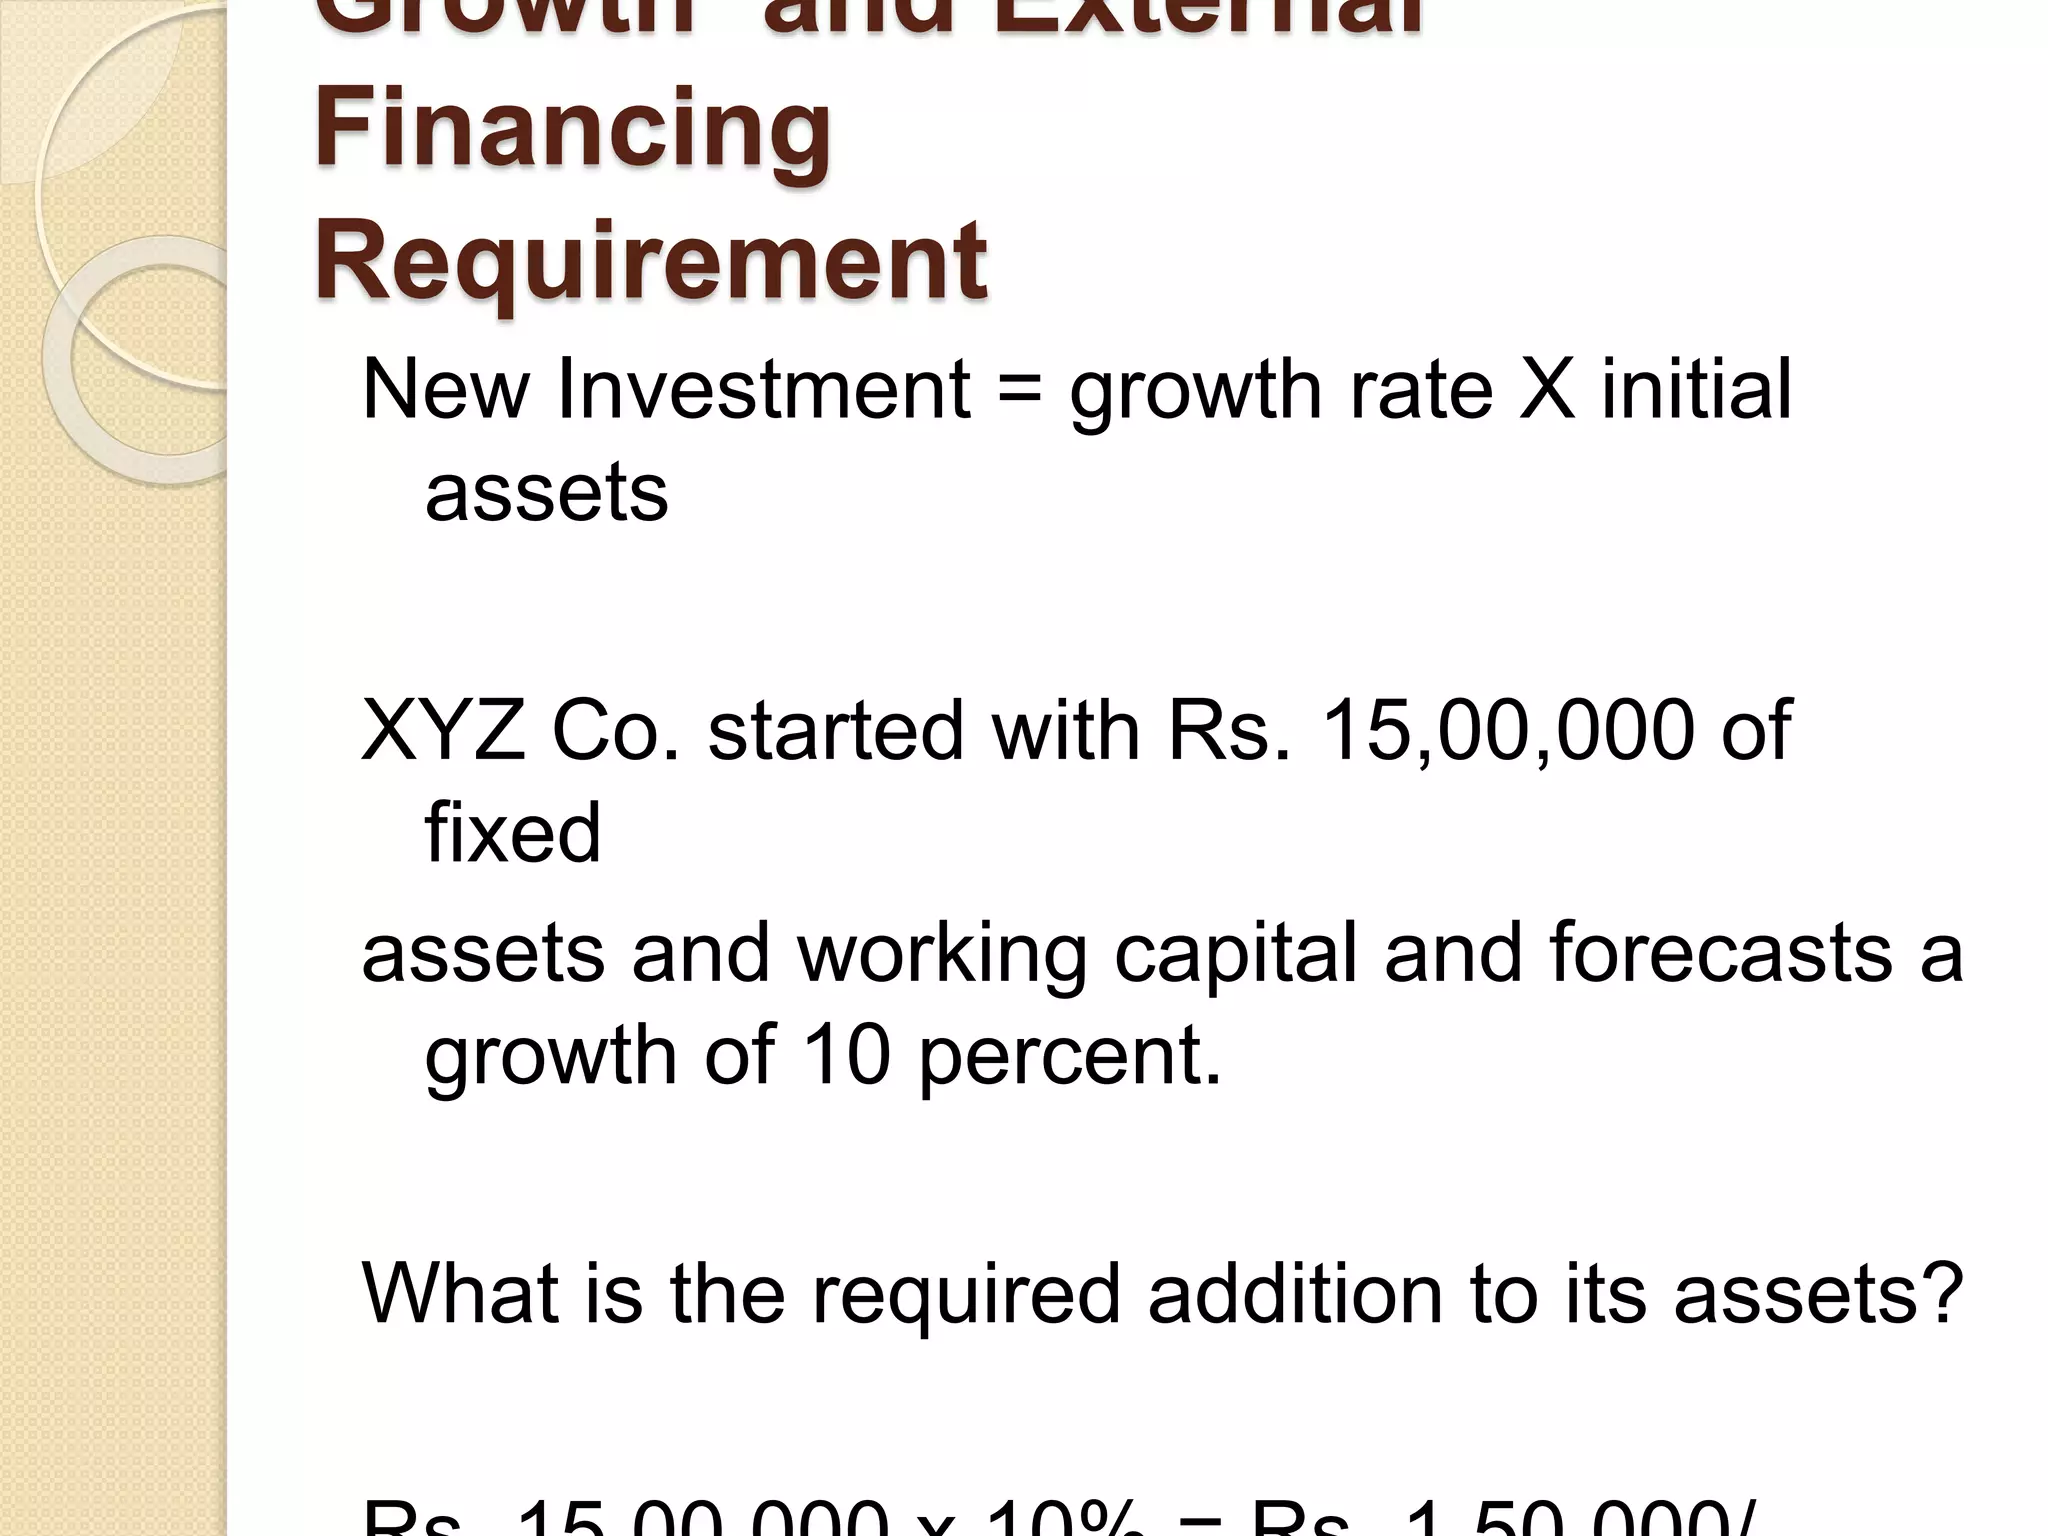
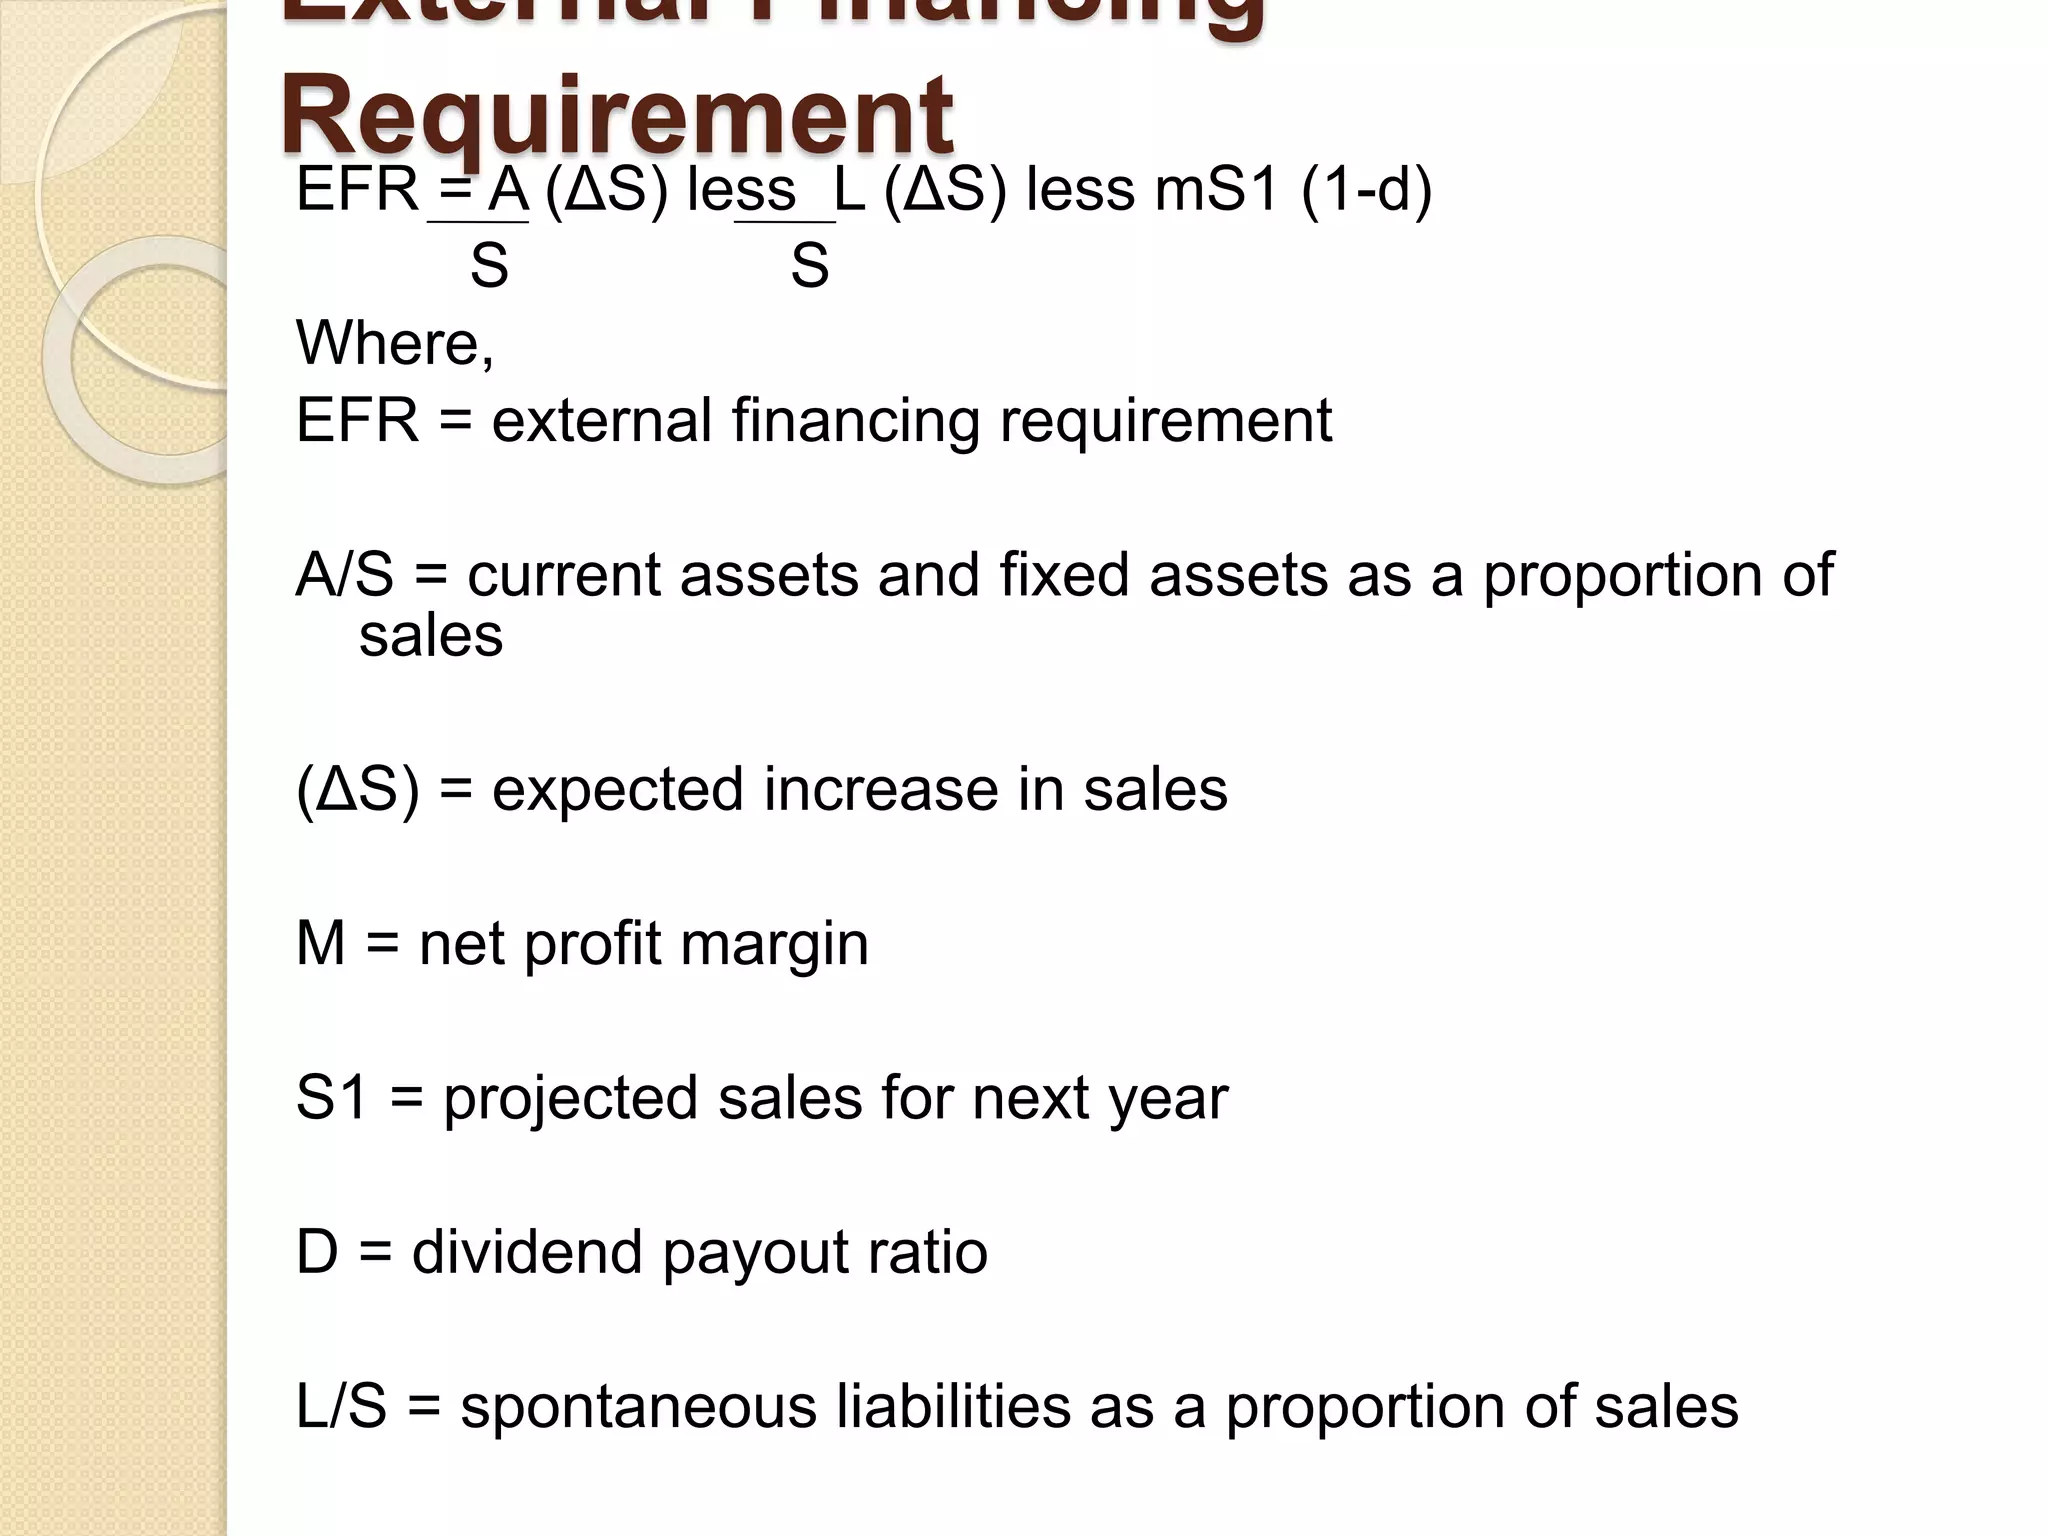
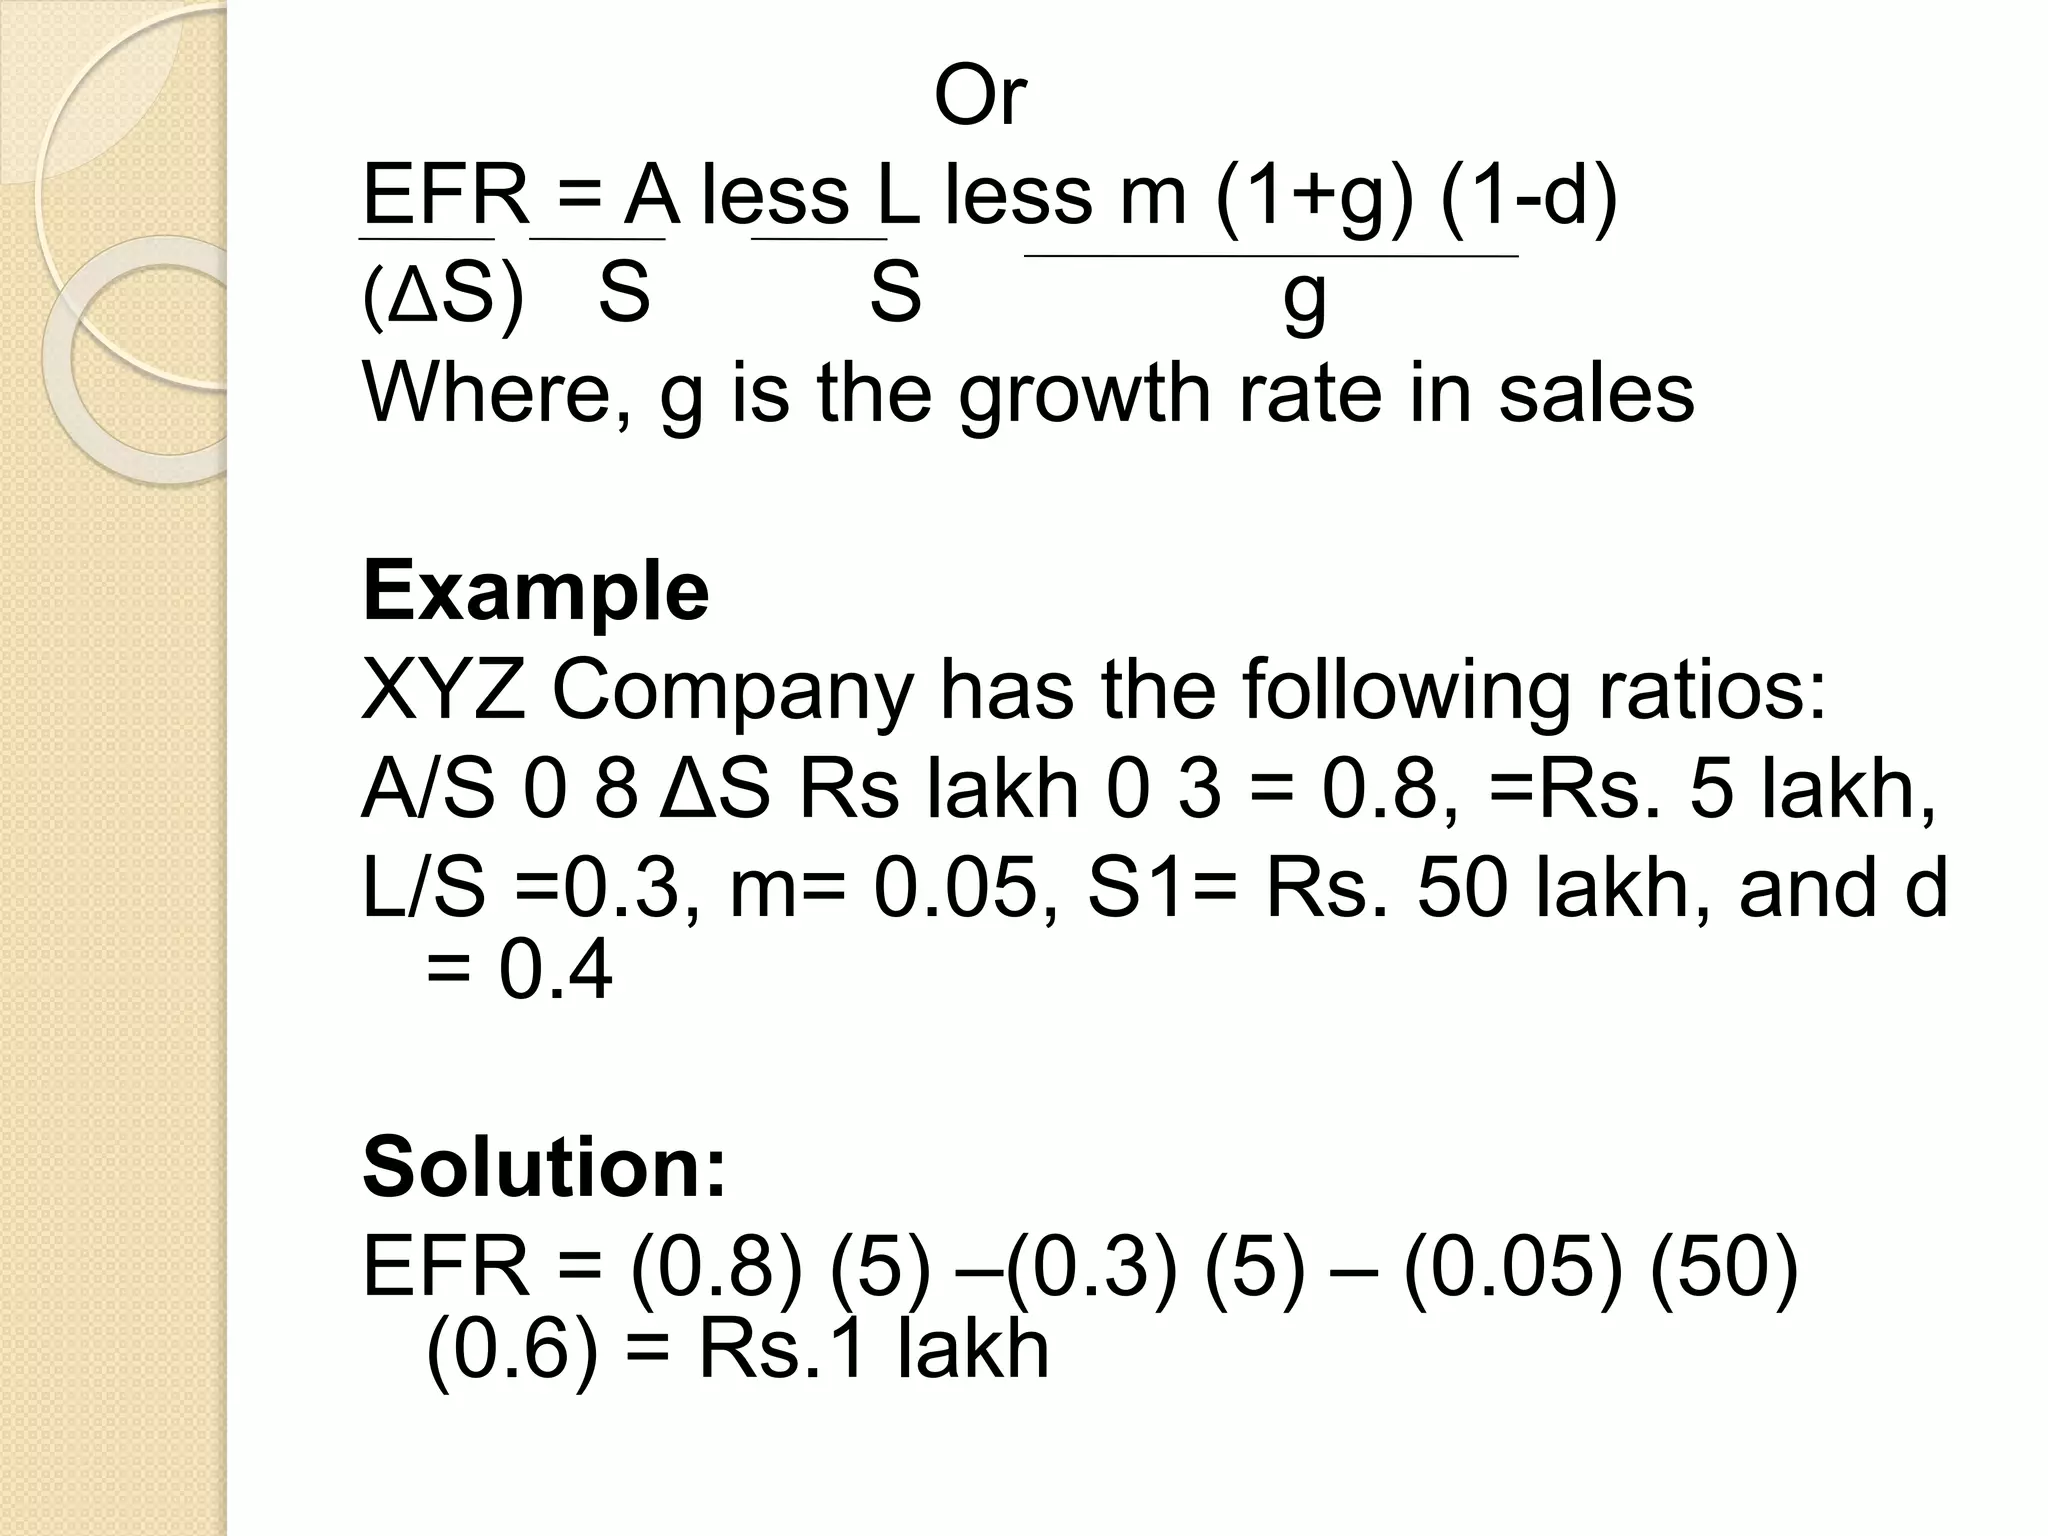
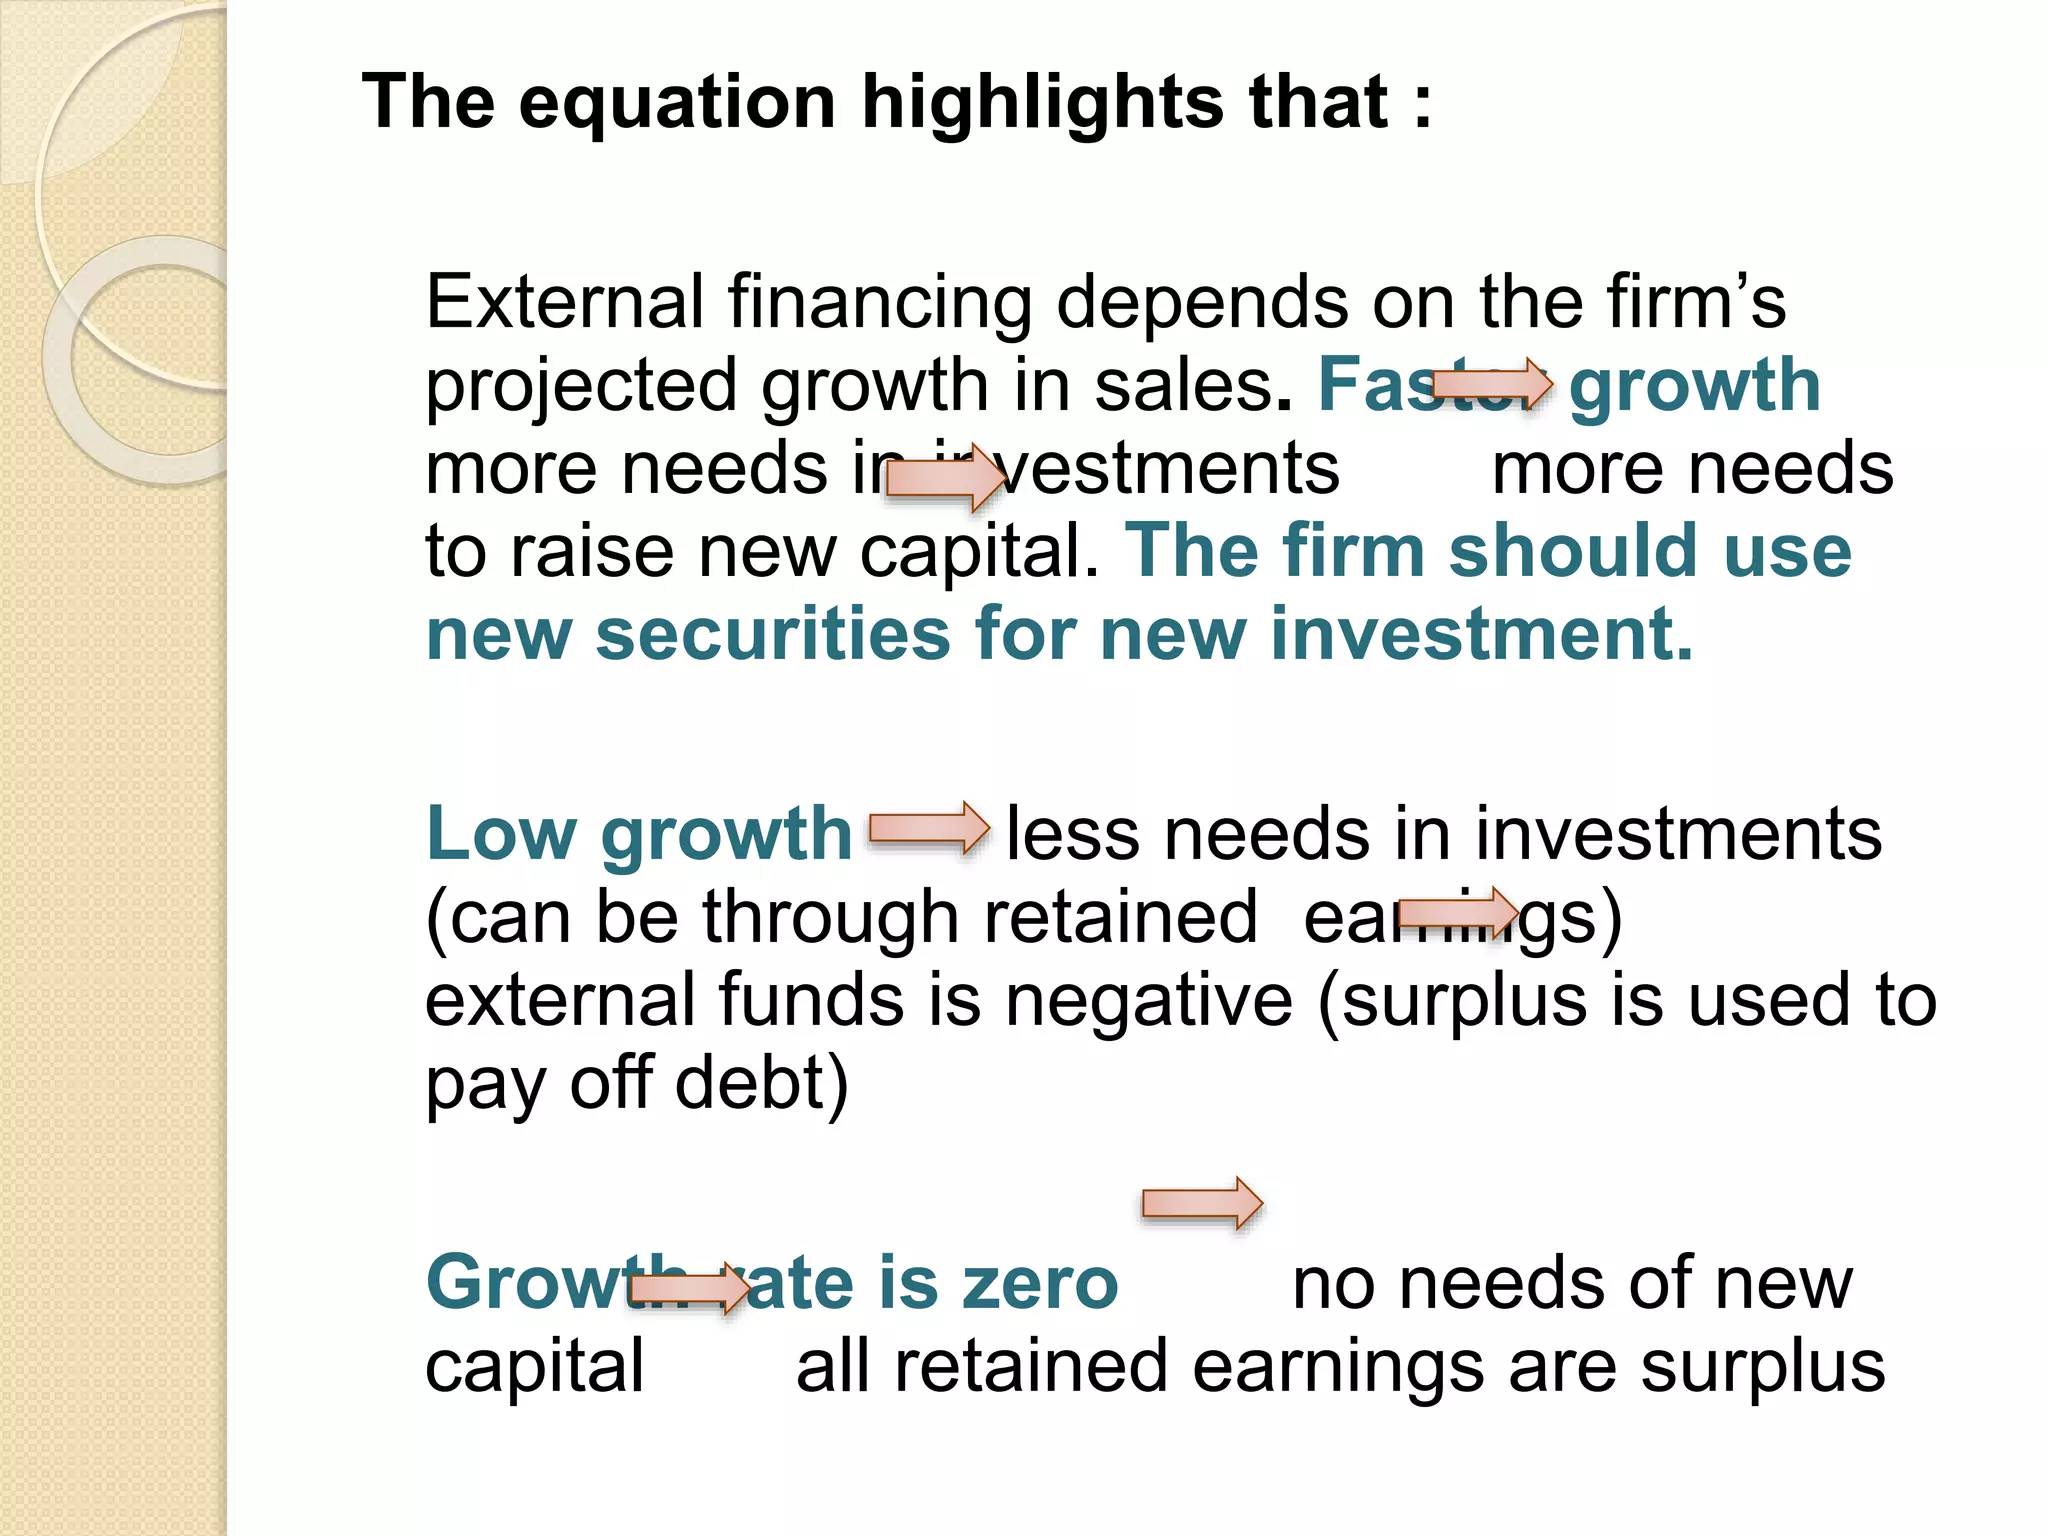
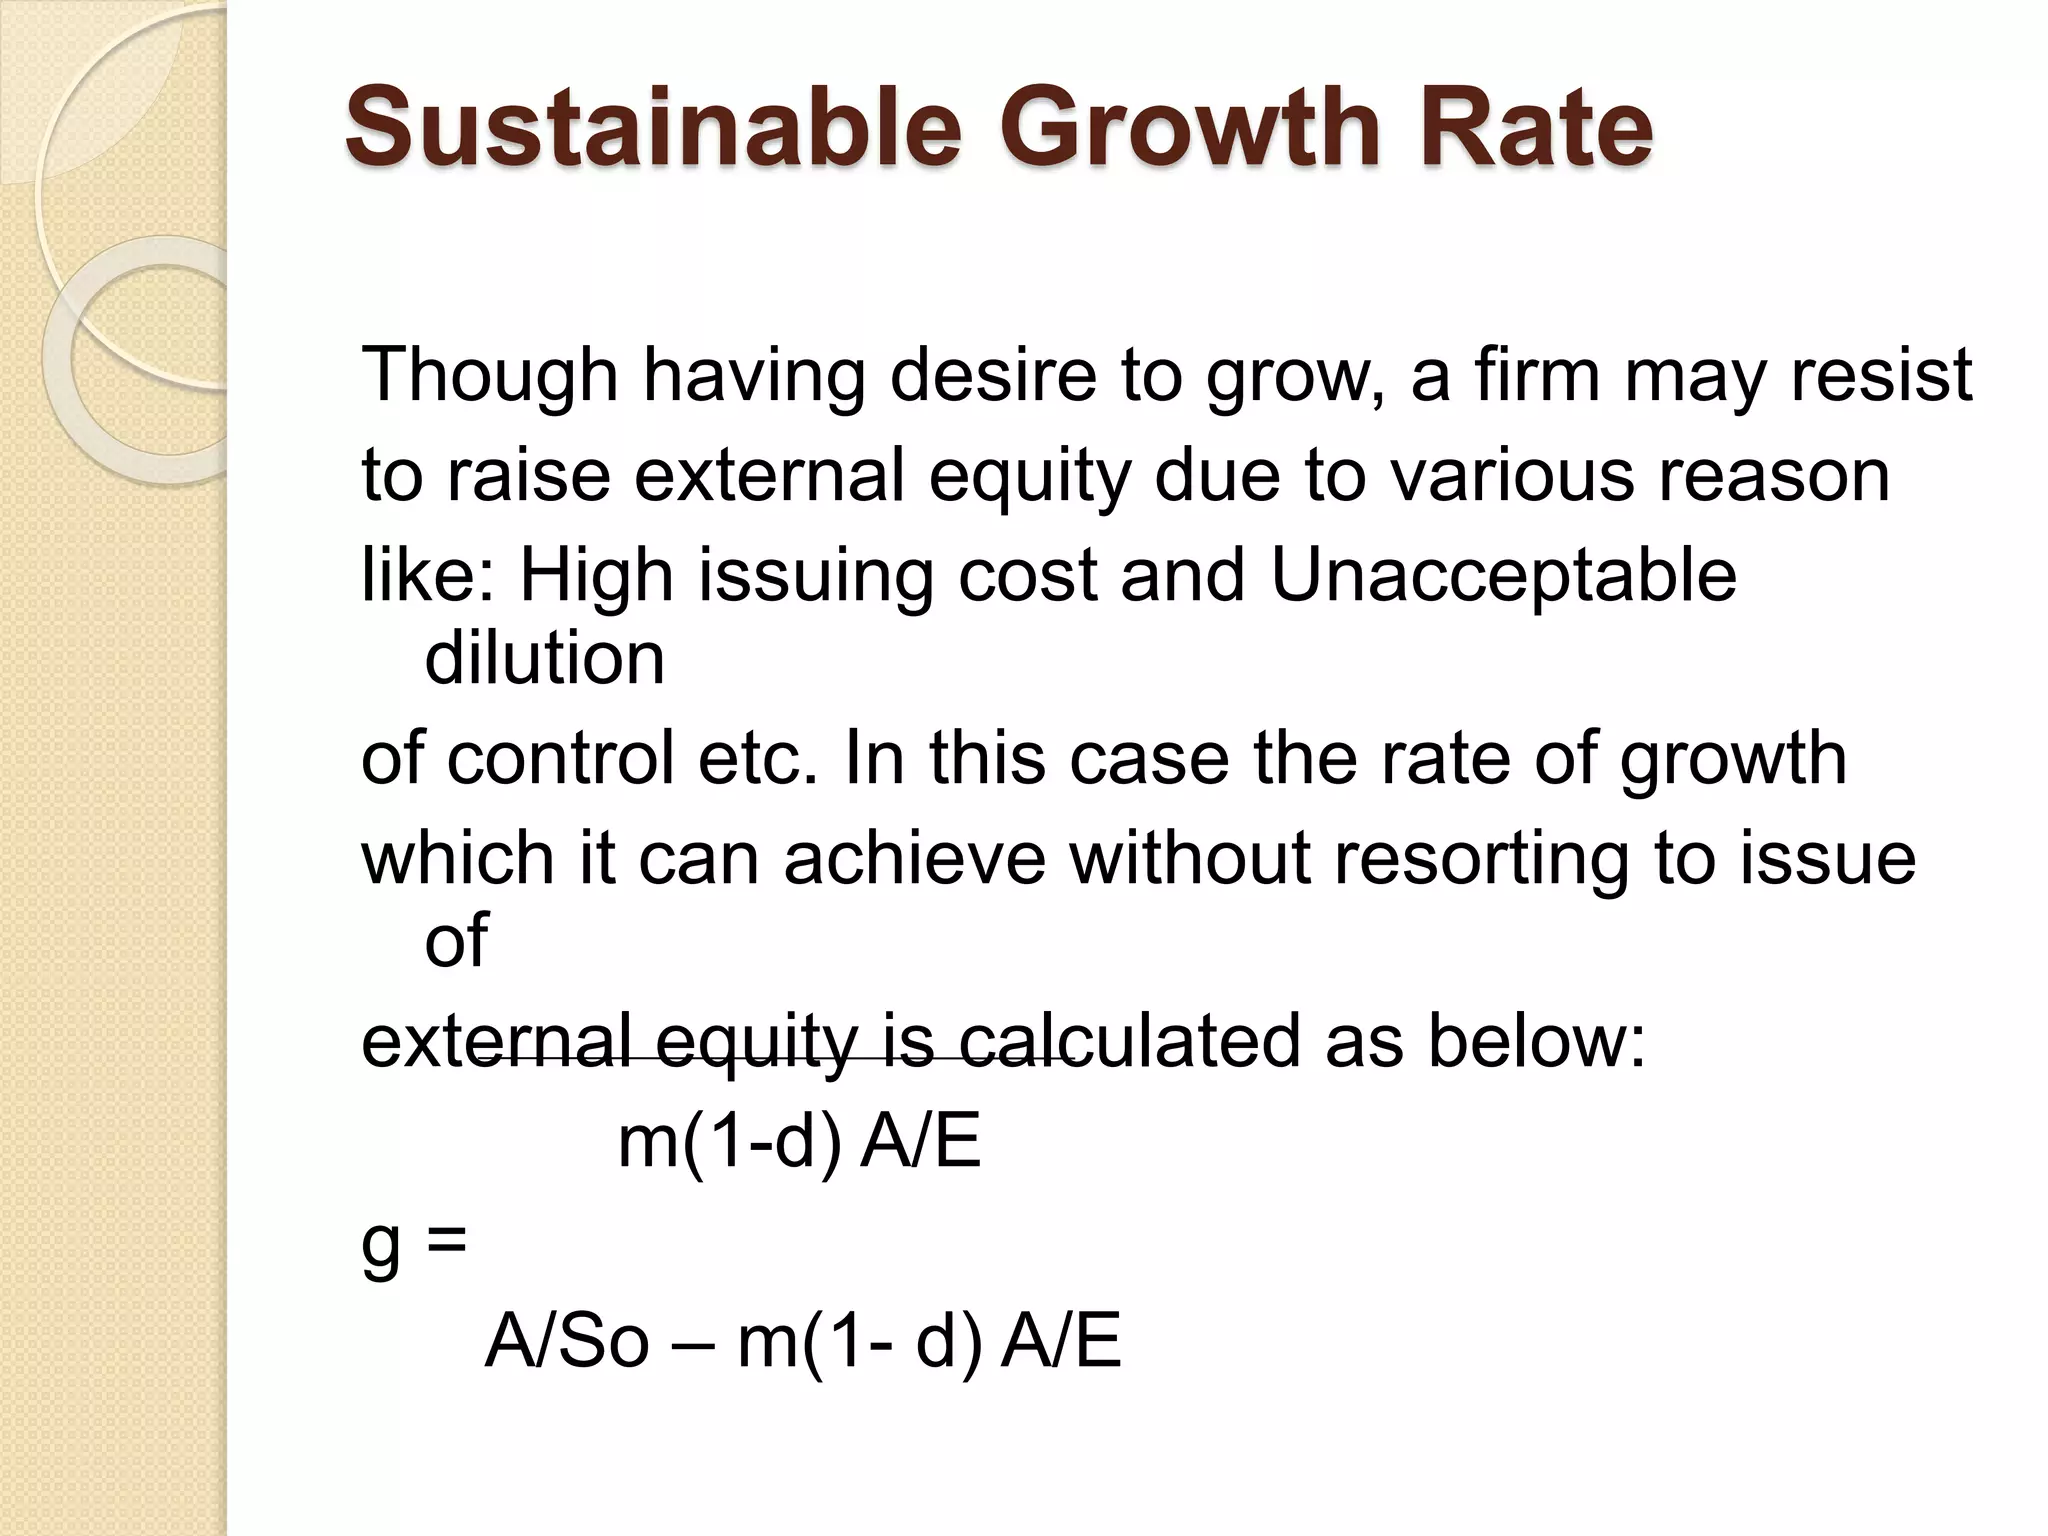
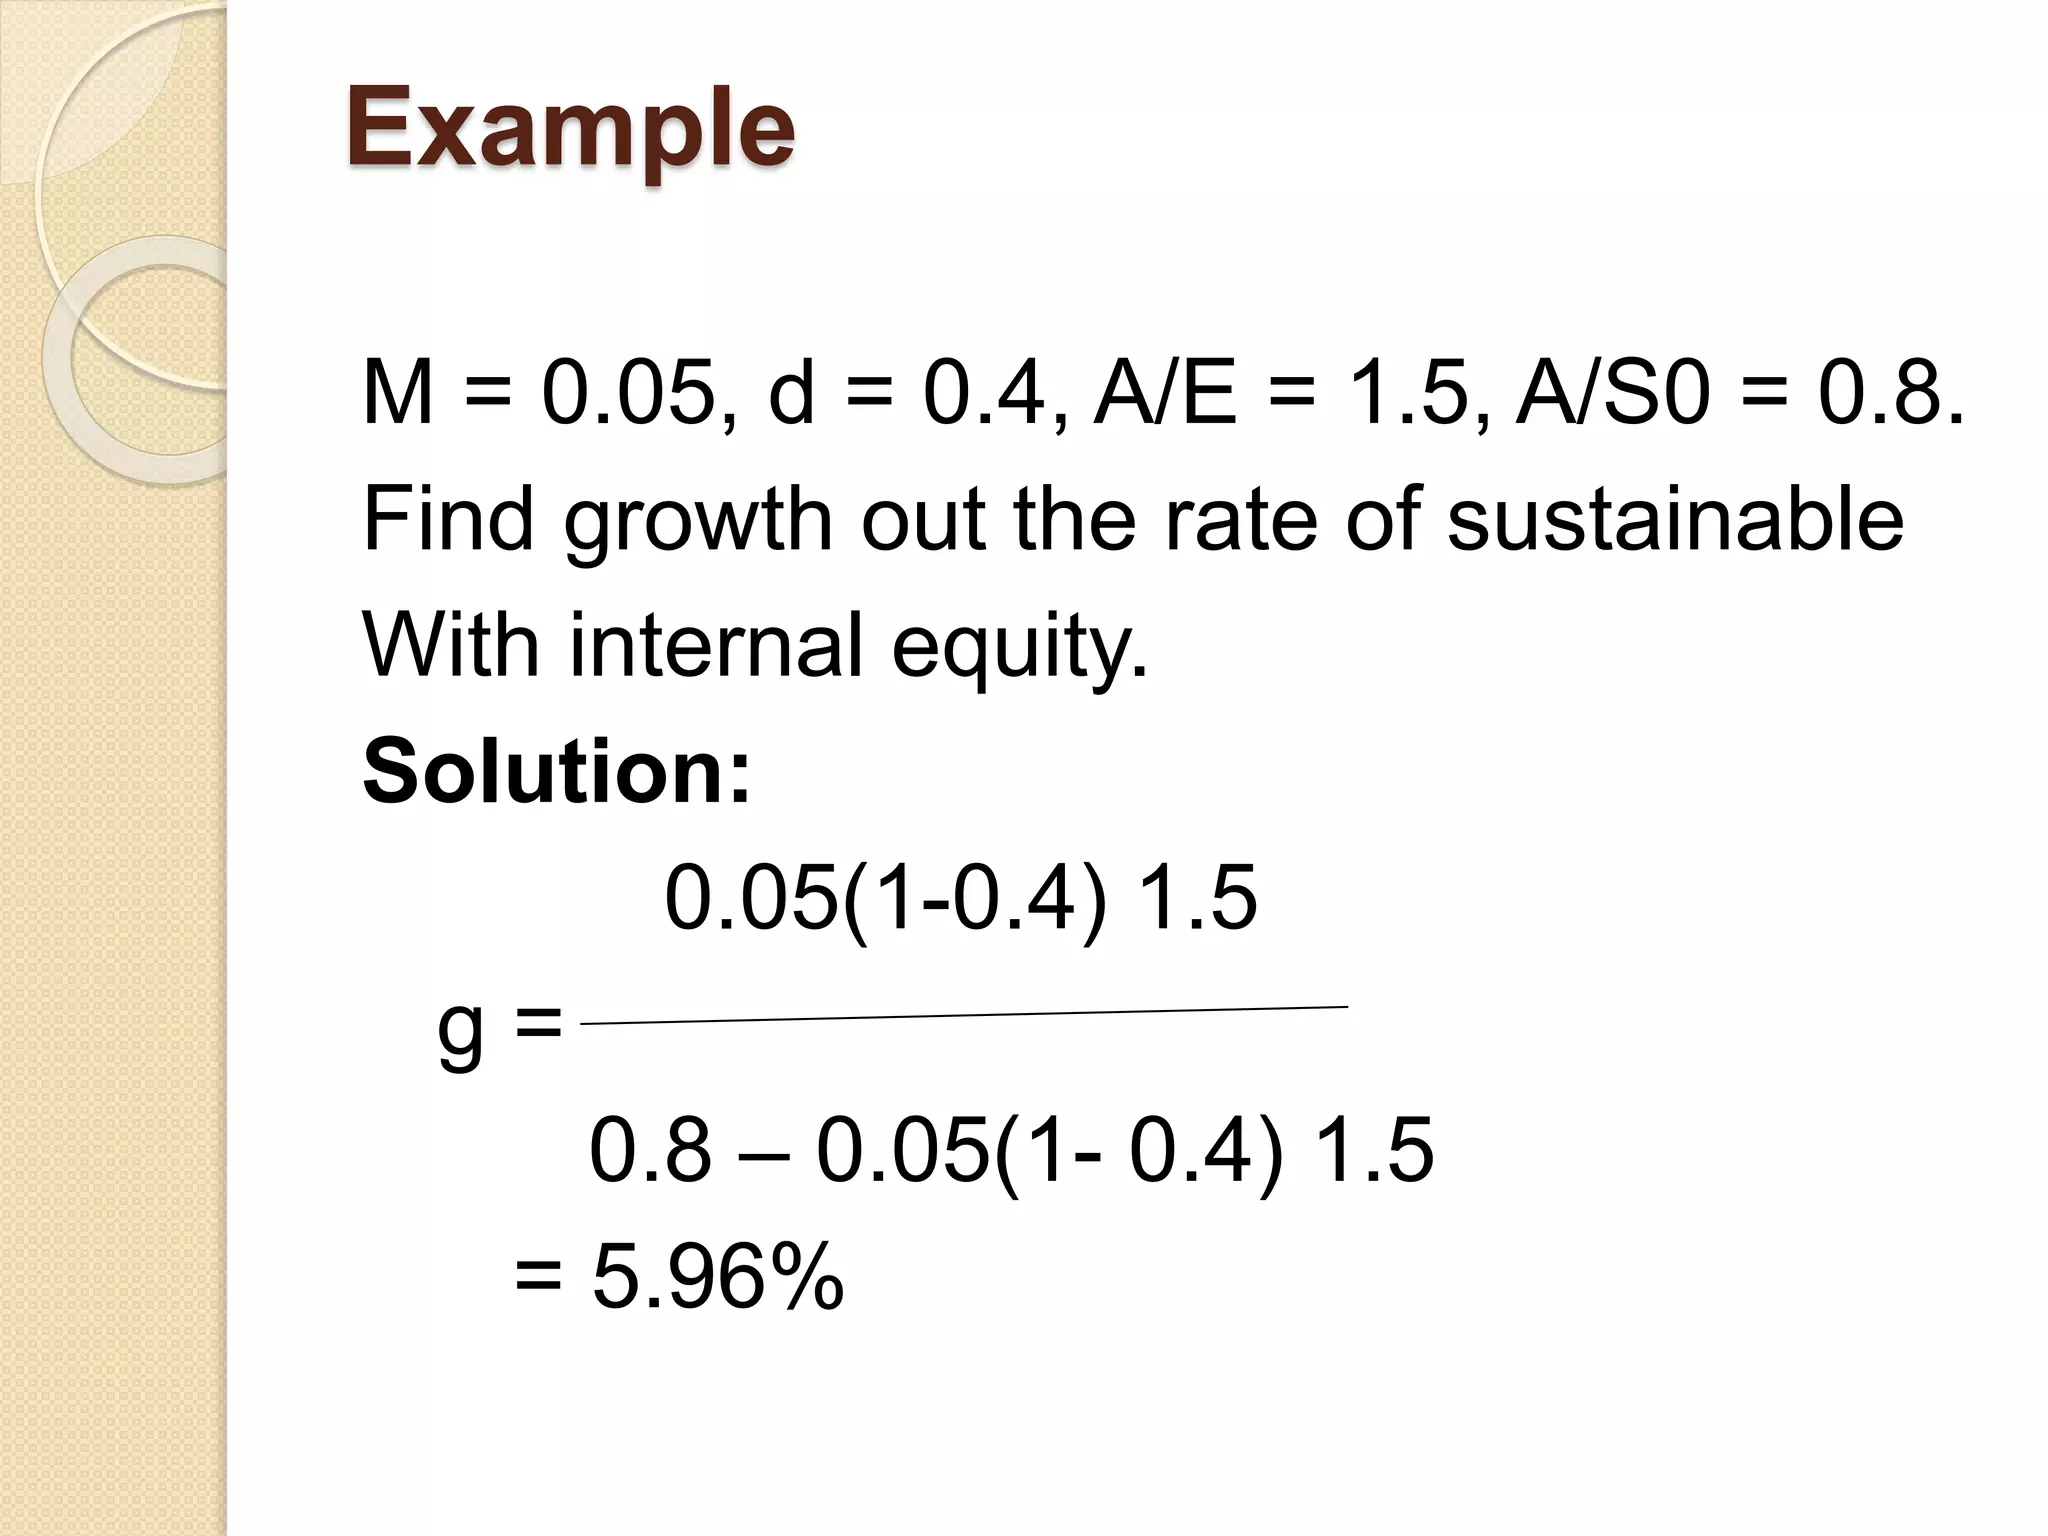

The document outlines the concepts of financial forecasting and planning, emphasizing the importance of utilizing past data to make informed predictions about future financial performance. It discusses various techniques for forecasting, including pro forma financial statements and budget methods, and highlights the need for sensitivity analysis to account for uncertainties. Additionally, it explores the relationship between a firm's growth, external financing requirements, and the sustainable growth rate without resorting to external equity.


