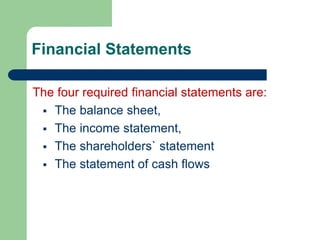
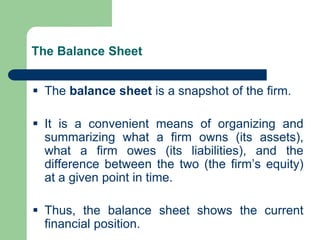
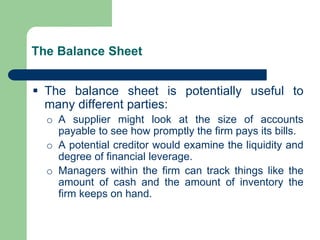
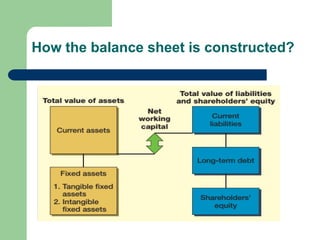
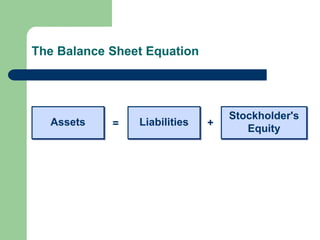
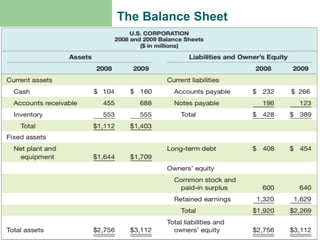
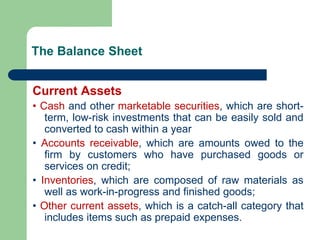
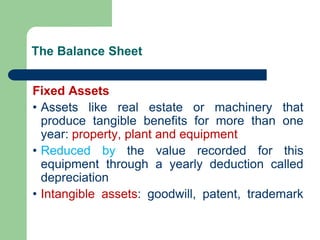
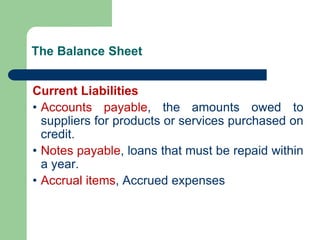
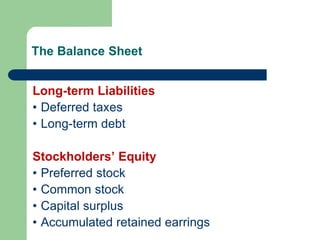
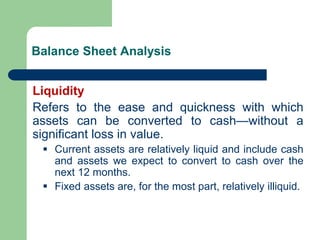
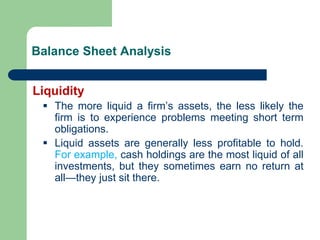
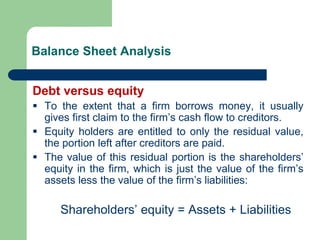
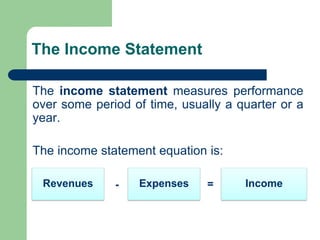
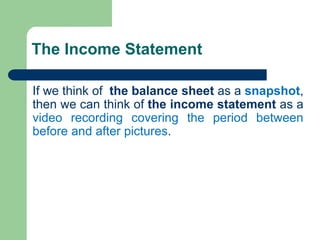
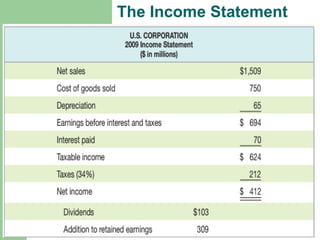
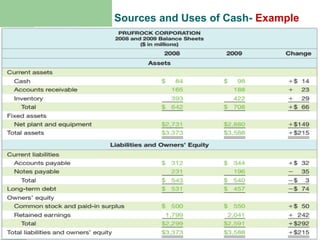
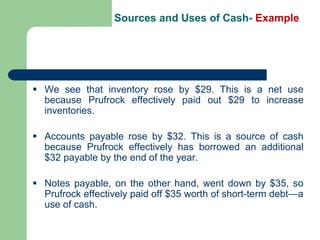
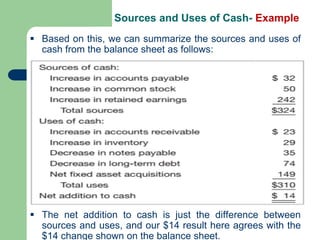
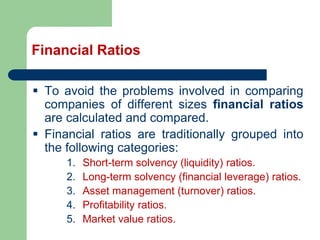
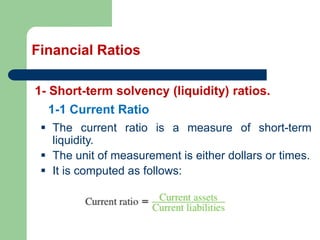
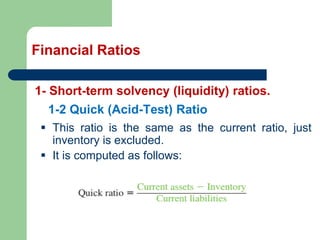
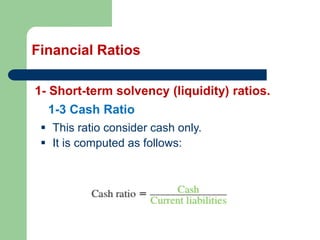
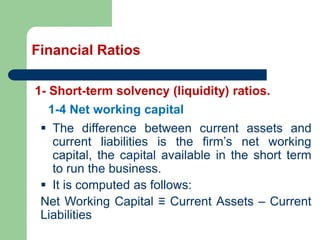
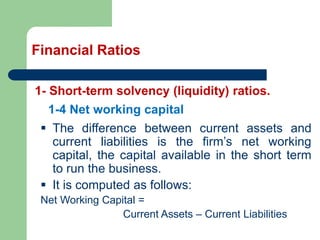
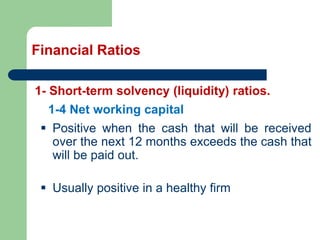
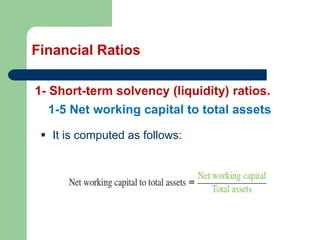
Lecture 3
Financial Analysis
Principles of Corporate Finance
Dr. Abdullah Hamoud
Main source: Ross, Westerfield and Jordan (2010). Fundamentals of Corporate Finance, 9th ed. McGraw-Hill
Financial Statements
The four required financial statements are:
▪ The balance sheet,
▪ The income statement,
▪ The shareholders` statement
▪ The statement of cash flows
The Balance Sheet
▪ The balance sheet is a snapshot of the firm.
▪ It is a convenient means of organizing and
summarizing what a firm owns (its assets),
what a firm owes (its liabilities), and the
difference between the two (the firm’s equity)
at a given point in time.
▪ Thus, the balance sheet shows the current
financial position.
The Balance Sheet
▪ The balance sheet is potentially useful to
many different parties:
o A supplier might look at the size of accounts
payable to see how promptly the firm pays its bills.
o A potential creditor would examine the liquidity and
degree of financial leverage.
o Managers within the firm can track things like the
amount of cash and the amount of inventory the
firm keeps on hand.
How the balance sheet is constructed?
The Balance Sheet Equation
Assets Liabilities
Stockholder's
Equity
= +
The Balance Sheet
The Balance Sheet
Current Assets
• Cash and other marketable securities, which are short-
term, low-risk investments that can be easily sold and
converted to cash within a year
• Accounts receivable, which are amounts owed to the
firm by customers who have purchased goods or
services on credit;
• Inventories, which are composed of raw materials as
well as work-in-progress and finished goods;
• Other current assets, which is a catch-all category that
includes items such as prepaid expenses.
The Balance Sheet
Fixed Assets
• Assets like real estate or machinery that
produce tangible benefits for more than one
year: property, plant and equipment
• Reduced by the value recorded for this
equipment through a yearly deduction called
depreciation
• Intangible assets: goodwill, patent, trademark
The Balance Sheet
Current Liabilities
• Accounts payable, the amounts owed to
suppliers for products or services purchased on
credit.
• Notes payable, loans that must be repaid within
a year.
• Accrual items, Accrued expenses
The Balance Sheet
Long-term Liabilities
• Deferred taxes
• Long-term debt
Stockholders’ Equity
• Preferred stock
• Common stock
• Capital surplus
• Accumulated retained earrings
Balance Sheet Analysis
There are three things to keep in mind when
analyzing a balance sheet :
1.Accounting liquidity
2.Debt versus equity
3.Market value versus book value (value versus
cost)
Balance Sheet Analysis
Liquidity
Refers to the ease and quickness with which
assets can be converted to cash—without a
significant loss in value.
▪ Current assets are relatively liquid and include cash
and assets we expect to convert to cash over the
next 12 months.
▪ Fixed assets are, for the most part, relatively illiquid.
Balance Sheet Analysis
Liquidity
▪ The more liquid a firm’s assets, the less likely the
firm is to experience problems meeting short term
obligations.
▪ Liquid assets are generally less profitable to hold.
For example, cash holdings are the most liquid of all
investments, but they sometimes earn no return at
all—they just sit there.
Balance Sheet Analysis
Debt versus equity
▪ To the extent that a firm borrows money, it usually
gives first claim to the firm’s cash flow to creditors.
▪ Equity holders are entitled to only the residual value,
the portion left after creditors are paid.
▪ The value of this residual portion is the shareholders’
equity in the firm, which is just the value of the firm’s
assets less the value of the firm’s liabilities:
Shareholders’ equity = Assets + Liabilities
Balance Sheet Analysis
Debt versus equity
▪ The use of debt in a firm’s capital structure is called
financial leverage.
▪ The more debt a firm has (as a percentage of assets),
the greater is its degree of financial leverage.
▪ Financial leverage increases the potential reward to
shareholders, but it also increases the potential for
financial distress and business failure.
Balance Sheet Analysis
Market value versus book value
▪ The values shown on the balance sheet for the
firm’s assets are book values and generally
are not what the assets are actually worth.
▪ Audited financial statements generally show
assets at historical cost.
▪ Assets are “carried on the books” at what the
firm paid for them, no matter how long ago
they were purchased or how much they are
worth today.
▪
Balance Sheet Analysis
Market value versus book value
In this example, shareholders’ equity is actually worth almost twice as much
as what is shown on the books. The distinction between book and market
values is important precisely because book values can be so different from
true economic value.
The Income Statement
The income statement measures performance
over some period of time, usually a quarter or a
year.
The income statement equation is:
Revenues Expenses Income
- =
The Income Statement
If we think of the balance sheet as a snapshot,
then we can think of the income statement as a
video recording covering the period between
before and after pictures.
The Income Statement
Calculating Earnings and Dividends per Share
Income Statement Analysis
There are three things to keep in mind when
analyzing an income statement:
1.Generally Accepted Accounting Principles
(GAAP)
2. Noncash Items
3. Time and Costs
Income Statement Analysis
GAAP
• The matching principal of GAAP dictates that
revenues be matched with expenses.
• Thus, income is reported when it is earned,
even though no cash flow may have occurred.
Income Statement Analysis
Noncash Items
• Depreciation is the most apparent. No firm
ever writes a check for “depreciation.”
• when we purchase a machine, the cash flow
occurs immediately, but we recognize the
expense of the machine over time as it is used
in the production process (i.e., depreciation).
• Another noncash item is deferred taxes, which
does not represent a cash flow.
• Thus, net income is not cash.
Income Statement Analysis
Time and Costs
• In the short run, certain equipment, resources,
and commitments of the firm are fixed, but the
firm can vary such inputs as labor and raw
materials.
• In the long run, all inputs of production (and
hence costs) are variable.
Income Statement Analysis
Time and Costs
• Financial accountants do not distinguish
between variable costs and fixed costs.
Instead, accounting costs usually fit into a
classification that distinguishes product costs
from period costs.
• Product costs: raw materials, direct labor, and
manufacturing overhead •
• Period costs: selling, general and
administrative expenses.
Sources and Uses of Cash
▪ Activities that bring in cash are called sources
of cash.
▪ Activities that involve spending cash
are called uses (or applications) of cash.
▪ We need to trace the changes in the firm’s
balance sheet to see how the firm obtained
and spent its cash during some period.
Sources and Uses of Cash- Example
▪ We see that inventory rose by $29. This is a net use
because Prufrock effectively paid out $29 to increase
inventories.
▪ Accounts payable rose by $32. This is a source of cash
because Prufrock effectively has borrowed an additional
$32 payable by the end of the year.
▪ Notes payable, on the other hand, went down by $35, so
Prufrock effectively paid off $35 worth of short-term debt—a
use of cash.
Sources and Uses of Cash- Example
▪ The net addition to cash is just the difference between
sources and uses, and our $14 result here agrees with the
$14 change shown on the balance sheet.
Sources and Uses of Cash- Example
▪ Based on this, we can summarize the sources and uses of
cash from the balance sheet as follows:
Financial Ratios
▪ To avoid the problems involved in comparing
companies of different sizes financial ratios
are calculated and compared.
▪ Financial ratios are traditionally grouped into
the following categories:
1. Short-term solvency (liquidity) ratios.
2. Long-term solvency (financial leverage) ratios.
3. Asset management (turnover) ratios.
4. Profitability ratios.
5. Market value ratios.
Financial Ratios
1- Short-term solvency (liquidity) ratios.
▪ Short-term solvency ratios are intended to
provide information about a firm’s liquidity, and
these ratios are sometimes called liquidity
measures.
▪ The primary concern is the firm’s ability to pay
its bills over the short run without undue
stress. Consequently, these ratios focus on
current assets and current liabilities.
Financial Ratios
1- Short-term solvency (liquidity) ratios.
▪ The current ratio is a measure of short-term
liquidity.
▪ The unit of measurement is either dollars or times.
▪ It is computed as follows:
1-1 Current Ratio
Financial Ratios
1- Short-term solvency (liquidity) ratios.
▪ This ratio is the same as the current ratio, just
inventory is excluded.
▪ It is computed as follows:
1-2 Quick (Acid-Test) Ratio
Financial Ratios
1- Short-term solvency (liquidity) ratios.
▪ This ratio consider cash only.
▪ It is computed as follows:
1-3 Cash Ratio
Financial Ratios
1- Short-term solvency (liquidity) ratios.
▪ The difference between current assets and
current liabilities is the firm’s net working
capital, the capital available in the short term
to run the business.
▪ It is computed as follows:
Net Working Capital ≡ Current Assets – Current
Liabilities
1-4 Net working capital
Financial Ratios
1- Short-term solvency (liquidity) ratios.
▪ The difference between current assets and
current liabilities is the firm’s net working
capital, the capital available in the short term
to run the business.
▪ It is computed as follows:
Net Working Capital =
Current Assets – Current Liabilities
1-4 Net working capital
Financial Ratios
1- Short-term solvency (liquidity) ratios.
▪ Positive when the cash that will be received
over the next 12 months exceeds the cash that
will be paid out.
▪ Usually positive in a healthy firm
1-4 Net working capital
Financial Ratios
1- Short-term solvency (liquidity) ratios.
▪ It is computed as follows:
1-5 Net working capital to total assets

Lecture-3.pdf

  • 1.
    Lecture 3 Financial Analysis Principlesof Corporate Finance Dr. Abdullah Hamoud Main source: Ross, Westerfield and Jordan (2010). Fundamentals of Corporate Finance, 9th ed. McGraw-Hill
  • 2.
    Financial Statements The fourrequired financial statements are: ▪ The balance sheet, ▪ The income statement, ▪ The shareholders` statement ▪ The statement of cash flows
  • 3.
    The Balance Sheet ▪The balance sheet is a snapshot of the firm. ▪ It is a convenient means of organizing and summarizing what a firm owns (its assets), what a firm owes (its liabilities), and the difference between the two (the firm’s equity) at a given point in time. ▪ Thus, the balance sheet shows the current financial position.
  • 4.
    The Balance Sheet ▪The balance sheet is potentially useful to many different parties: o A supplier might look at the size of accounts payable to see how promptly the firm pays its bills. o A potential creditor would examine the liquidity and degree of financial leverage. o Managers within the firm can track things like the amount of cash and the amount of inventory the firm keeps on hand.
  • 5.
    How the balancesheet is constructed?
  • 6.
    The Balance SheetEquation Assets Liabilities Stockholder's Equity = +
  • 7.
  • 8.
    The Balance Sheet CurrentAssets • Cash and other marketable securities, which are short- term, low-risk investments that can be easily sold and converted to cash within a year • Accounts receivable, which are amounts owed to the firm by customers who have purchased goods or services on credit; • Inventories, which are composed of raw materials as well as work-in-progress and finished goods; • Other current assets, which is a catch-all category that includes items such as prepaid expenses.
  • 9.
    The Balance Sheet FixedAssets • Assets like real estate or machinery that produce tangible benefits for more than one year: property, plant and equipment • Reduced by the value recorded for this equipment through a yearly deduction called depreciation • Intangible assets: goodwill, patent, trademark
  • 10.
    The Balance Sheet CurrentLiabilities • Accounts payable, the amounts owed to suppliers for products or services purchased on credit. • Notes payable, loans that must be repaid within a year. • Accrual items, Accrued expenses
  • 11.
    The Balance Sheet Long-termLiabilities • Deferred taxes • Long-term debt Stockholders’ Equity • Preferred stock • Common stock • Capital surplus • Accumulated retained earrings
  • 12.
    Balance Sheet Analysis Thereare three things to keep in mind when analyzing a balance sheet : 1.Accounting liquidity 2.Debt versus equity 3.Market value versus book value (value versus cost)
  • 13.
    Balance Sheet Analysis Liquidity Refersto the ease and quickness with which assets can be converted to cash—without a significant loss in value. ▪ Current assets are relatively liquid and include cash and assets we expect to convert to cash over the next 12 months. ▪ Fixed assets are, for the most part, relatively illiquid.
  • 14.
    Balance Sheet Analysis Liquidity ▪The more liquid a firm’s assets, the less likely the firm is to experience problems meeting short term obligations. ▪ Liquid assets are generally less profitable to hold. For example, cash holdings are the most liquid of all investments, but they sometimes earn no return at all—they just sit there.
  • 15.
    Balance Sheet Analysis Debtversus equity ▪ To the extent that a firm borrows money, it usually gives first claim to the firm’s cash flow to creditors. ▪ Equity holders are entitled to only the residual value, the portion left after creditors are paid. ▪ The value of this residual portion is the shareholders’ equity in the firm, which is just the value of the firm’s assets less the value of the firm’s liabilities: Shareholders’ equity = Assets + Liabilities
  • 16.
    Balance Sheet Analysis Debtversus equity ▪ The use of debt in a firm’s capital structure is called financial leverage. ▪ The more debt a firm has (as a percentage of assets), the greater is its degree of financial leverage. ▪ Financial leverage increases the potential reward to shareholders, but it also increases the potential for financial distress and business failure.
  • 17.
    Balance Sheet Analysis Marketvalue versus book value ▪ The values shown on the balance sheet for the firm’s assets are book values and generally are not what the assets are actually worth. ▪ Audited financial statements generally show assets at historical cost. ▪ Assets are “carried on the books” at what the firm paid for them, no matter how long ago they were purchased or how much they are worth today. ▪
  • 18.
    Balance Sheet Analysis Marketvalue versus book value In this example, shareholders’ equity is actually worth almost twice as much as what is shown on the books. The distinction between book and market values is important precisely because book values can be so different from true economic value.
  • 19.
    The Income Statement Theincome statement measures performance over some period of time, usually a quarter or a year. The income statement equation is: Revenues Expenses Income - =
  • 20.
    The Income Statement Ifwe think of the balance sheet as a snapshot, then we can think of the income statement as a video recording covering the period between before and after pictures.
  • 21.
  • 22.
    The Income Statement CalculatingEarnings and Dividends per Share
  • 23.
    Income Statement Analysis Thereare three things to keep in mind when analyzing an income statement: 1.Generally Accepted Accounting Principles (GAAP) 2. Noncash Items 3. Time and Costs
  • 24.
    Income Statement Analysis GAAP •The matching principal of GAAP dictates that revenues be matched with expenses. • Thus, income is reported when it is earned, even though no cash flow may have occurred.
  • 25.
    Income Statement Analysis NoncashItems • Depreciation is the most apparent. No firm ever writes a check for “depreciation.” • when we purchase a machine, the cash flow occurs immediately, but we recognize the expense of the machine over time as it is used in the production process (i.e., depreciation). • Another noncash item is deferred taxes, which does not represent a cash flow. • Thus, net income is not cash.
  • 26.
    Income Statement Analysis Timeand Costs • In the short run, certain equipment, resources, and commitments of the firm are fixed, but the firm can vary such inputs as labor and raw materials. • In the long run, all inputs of production (and hence costs) are variable.
  • 27.
    Income Statement Analysis Timeand Costs • Financial accountants do not distinguish between variable costs and fixed costs. Instead, accounting costs usually fit into a classification that distinguishes product costs from period costs. • Product costs: raw materials, direct labor, and manufacturing overhead • • Period costs: selling, general and administrative expenses.
  • 28.
    Sources and Usesof Cash ▪ Activities that bring in cash are called sources of cash. ▪ Activities that involve spending cash are called uses (or applications) of cash. ▪ We need to trace the changes in the firm’s balance sheet to see how the firm obtained and spent its cash during some period.
  • 29.
    Sources and Usesof Cash- Example
  • 30.
    ▪ We seethat inventory rose by $29. This is a net use because Prufrock effectively paid out $29 to increase inventories. ▪ Accounts payable rose by $32. This is a source of cash because Prufrock effectively has borrowed an additional $32 payable by the end of the year. ▪ Notes payable, on the other hand, went down by $35, so Prufrock effectively paid off $35 worth of short-term debt—a use of cash. Sources and Uses of Cash- Example
  • 31.
    ▪ The netaddition to cash is just the difference between sources and uses, and our $14 result here agrees with the $14 change shown on the balance sheet. Sources and Uses of Cash- Example ▪ Based on this, we can summarize the sources and uses of cash from the balance sheet as follows:
  • 32.
    Financial Ratios ▪ Toavoid the problems involved in comparing companies of different sizes financial ratios are calculated and compared. ▪ Financial ratios are traditionally grouped into the following categories: 1. Short-term solvency (liquidity) ratios. 2. Long-term solvency (financial leverage) ratios. 3. Asset management (turnover) ratios. 4. Profitability ratios. 5. Market value ratios.
  • 33.
    Financial Ratios 1- Short-termsolvency (liquidity) ratios. ▪ Short-term solvency ratios are intended to provide information about a firm’s liquidity, and these ratios are sometimes called liquidity measures. ▪ The primary concern is the firm’s ability to pay its bills over the short run without undue stress. Consequently, these ratios focus on current assets and current liabilities.
  • 34.
    Financial Ratios 1- Short-termsolvency (liquidity) ratios. ▪ The current ratio is a measure of short-term liquidity. ▪ The unit of measurement is either dollars or times. ▪ It is computed as follows: 1-1 Current Ratio
  • 35.
    Financial Ratios 1- Short-termsolvency (liquidity) ratios. ▪ This ratio is the same as the current ratio, just inventory is excluded. ▪ It is computed as follows: 1-2 Quick (Acid-Test) Ratio
  • 36.
    Financial Ratios 1- Short-termsolvency (liquidity) ratios. ▪ This ratio consider cash only. ▪ It is computed as follows: 1-3 Cash Ratio
  • 37.
    Financial Ratios 1- Short-termsolvency (liquidity) ratios. ▪ The difference between current assets and current liabilities is the firm’s net working capital, the capital available in the short term to run the business. ▪ It is computed as follows: Net Working Capital ≡ Current Assets – Current Liabilities 1-4 Net working capital
  • 38.
    Financial Ratios 1- Short-termsolvency (liquidity) ratios. ▪ The difference between current assets and current liabilities is the firm’s net working capital, the capital available in the short term to run the business. ▪ It is computed as follows: Net Working Capital = Current Assets – Current Liabilities 1-4 Net working capital
  • 39.
    Financial Ratios 1- Short-termsolvency (liquidity) ratios. ▪ Positive when the cash that will be received over the next 12 months exceeds the cash that will be paid out. ▪ Usually positive in a healthy firm 1-4 Net working capital
  • 40.
    Financial Ratios 1- Short-termsolvency (liquidity) ratios. ▪ It is computed as follows: 1-5 Net working capital to total assets