Download to read offline


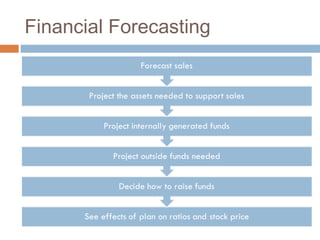
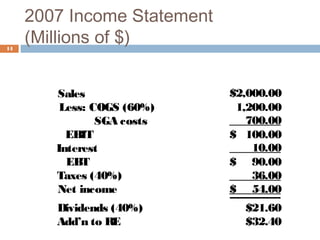
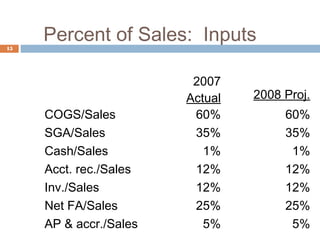
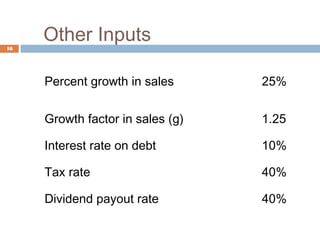
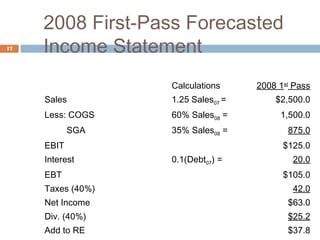
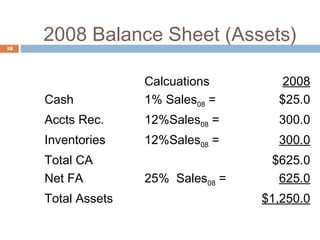
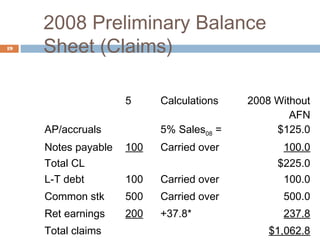
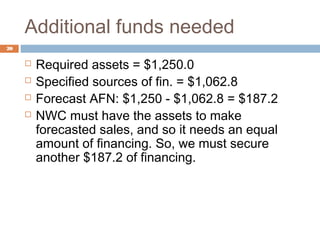
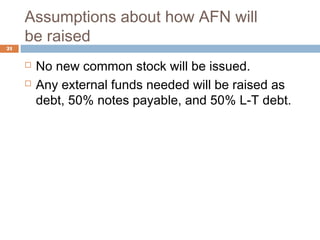
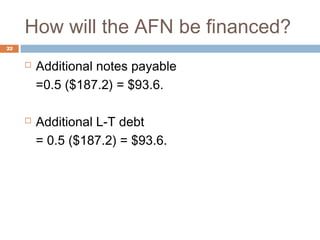
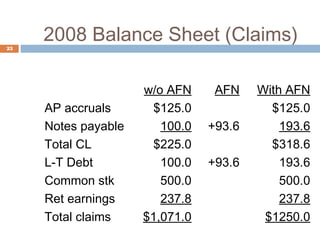
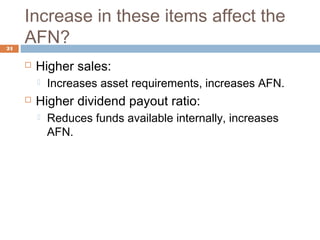
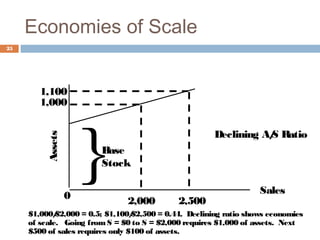


The document discusses financial planning and forecasting pro forma financial statements. It provides details on: 1) Forecasting sales using projected growth rates and estimating costs, assets, and liabilities as a percentage of sales. 2) Calculating additional funds needed (AFN) by comparing forecasted assets to sources of internal financing. If AFN is positive, external financing is required. 3) Assumptions made in the example forecast, such as how any additional funds needed will be obtained through debt financing split evenly between notes payable and long-term debt.


