Index
Introduction to FinancialModeling
Use and Users of Financial Modeling
Modeling
Issues for Profit & loss and Balance Sheet items
Corporate Valuations
Types of Financial Models
3.
Financial models
– Afinancial model is simply a logical and orderly
representation of a business, which, if built correctly, will
become one of the most vital tools in the entrepreneur’s
tool box.
– Financial modeling is the process by which a firm
constructs a financial representation of some, or all,
aspects of the firm or given security. The model is usually
characterized by performing calculations and makes
recommendations based on that information.
4.
Financial modeling
These modelsare generally built around
– Financial statements ( 10k report),normally for 5
years.
– Inputs (assumptions) impacting outputs
– External inputs/global variables (exchange rates,
tax percentage, etc…)
– Internal inputs/ companies pacific variables
(wages, unit costs, etc…)
– Output
5.
Financial modeling
Possible Applicationsinclude:
– Business plan performance & valuation
– Scenario planning and management decision making, (expansions &
strategic planning analysis)
– Project finance
– Equity Investment
– Portfolio & Risk Management
– Credit Analysis
– Fair Valuation
6.
Use and Usersof Financial Models
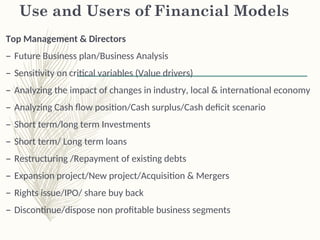
Top Management & Directors
– Future Business plan/Business Analysis
– Sensitivity on critical variables (Value drivers)
– Analyzing the impact of changes in industry, local & international economy
– Analyzing Cash flow position/Cash surplus/Cash deficit scenario
– Short term/long term Investments
– Short term/ Long term loans
– Restructuring /Repayment of existing debts
– Expansion project/New project/Acquisition & Mergers
– Rights issue/IPO/ share buy back
– Discontinue/dispose non profitable business segments
7.
Use and Usersof Financial Models
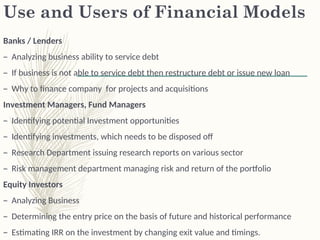
Banks / Lenders
– Analyzing business ability to service debt
– If business is not able to service debt then restructure debt or issue new loan
– Why to finance company for projects and acquisitions
Investment Managers, Fund Managers
– Identifying potential Investment opportunities
– Identifying investments, which needs to be disposed off
– Research Department issuing research reports on various sector
– Risk management department managing risk and return of the portfolio
Equity Investors
– Analyzing Business
– Determining the entry price on the basis of future and historical performance
– Estimating IRR on the investment by changing exit value and timings.
8.
Use and Usersof Financial Models
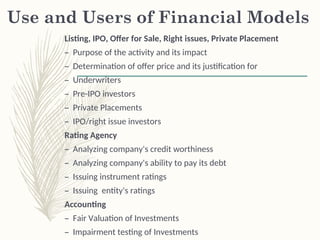
Listing, IPO, Offer for Sale, Right issues, Private Placement
– Purpose of the activity and its impact
– Determination of offer price and its justification for
– Underwriters
– Pre-IPO investors
– Private Placements
– IPO/right issue investors
Rating Agency
– Analyzing company's credit worthiness
– Analyzing company's ability to pay its debt
– Issuing instrument ratings
– Issuing entity's ratings
Accounting
– Fair Valuation of Investments
– Impairment testing of Investments
9.
You as theModel Developer
(Three HATS)
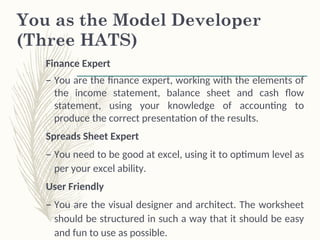
Finance Expert
– You are the finance expert, working with the elements of
the income statement, balance sheet and cash flow
statement, using your knowledge of accounting to
produce the correct presentation of the results.
Spreads Sheet Expert
– You need to be good at excel, using it to optimum level as
per your excel ability.
User Friendly
– You are the visual designer and architect. The worksheet
should be structured in such a way that it should be easy
and fun to use as possible.
10.
Financial Modeling Process
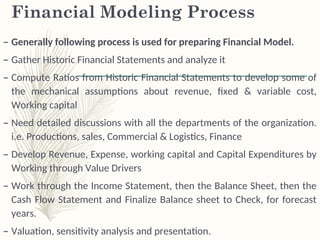
–Generally following process is used for preparing Financial Model.
– Gather Historic Financial Statements and analyze it
– Compute Ratios from Historic Financial Statements to develop some of
the mechanical assumptions about revenue, fixed & variable cost,
Working capital
– Need detailed discussions with all the departments of the organization.
i.e. Productions, sales, Commercial & Logistics, Finance
– Develop Revenue, Expense, working capital and Capital Expenditures by
Working through Value Drivers
– Work through the Income Statement, then the Balance Sheet, then the
Cash Flow Statement and Finalize Balance sheet to Check, for forecast
years.
– Valuation, sensitivity analysis and presentation.
11.
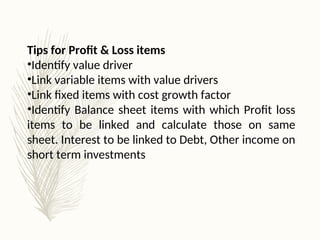
Tips for Profit& Loss items
•Identify value driver
•Link variable items with value drivers
•Link fixed items with cost growth factor
•Identify Balance sheet items with which Profit loss
items to be linked and calculate those on same
sheet. Interest to be linked to Debt, Other income on
short term investments
12.
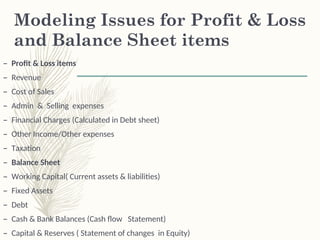
Modeling Issues forProfit & Loss
and Balance Sheet items
– Profit & Loss items
– Revenue
– Cost of Sales
– Admin & Selling expenses
– Financial Charges (Calculated in Debt sheet)
– Other Income/Other expenses
– Taxation
– Balance Sheet
– Working Capital( Current assets & liabilities)
– Fixed Assets
– Debt
– Cash & Bank Balances (Cash flow Statement)
– Capital & Reserves ( Statement of changes in Equity)
13.
Revenue
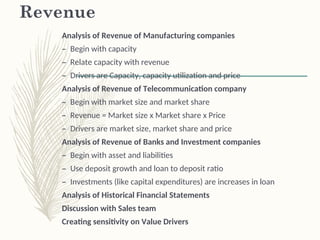
Analysis of Revenueof Manufacturing companies
– Begin with capacity
– Relate capacity with revenue
– Drivers are Capacity, capacity utilization and price
Analysis of Revenue of Telecommunication company
– Begin with market size and market share
– Revenue = Market size x Market share x Price
– Drivers are market size, market share and price
Analysis of Revenue of Banks and Investment companies
– Begin with asset and liabilities
– Use deposit growth and loan to deposit ratio
– Investments (like capital expenditures) are increases in loan
Analysis of Historical Financial Statements
Discussion with Sales team
Creating sensitivity on Value Drivers
14.
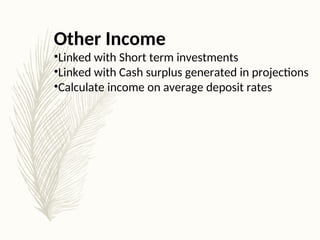
Other Income
•Linked withShort term investments
•Linked with Cash surplus generated in projections
•Calculate income on average deposit rates
15.
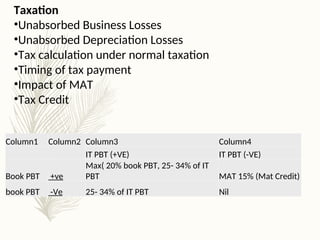
Taxation
•Unabsorbed Business Losses
•UnabsorbedDepreciation Losses
•Tax calculation under normal taxation
•Timing of tax payment
•Impact of MAT
•Tax Credit
Column1 Column2 Column3 Column4
IT PBT (+VE) IT PBT (-VE)
Book PBT +ve
Max( 20% book PBT, 25- 34% of IT
PBT MAT 15% (Mat Credit)
book PBT -Ve 25- 34% of IT PBT Nil
16.
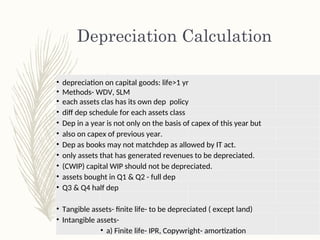
Depreciation Calculation
• depreciationon capital goods: life>1 yr
• Methods- WDV, SLM
• each assets clas has its own dep policy
• diff dep schedule for each assets class
• Dep in a year is not only on the basis of capex of this year but
• also on capex of previous year.
• Dep as books may not matchdep as allowed by IT act.
• only assets that has generated revenues to be depreciated.
• (CWIP) capital WIP should not be depreciated.
• assets bought in Q1 & Q2 - full dep
• Q3 & Q4 half dep
• Tangible assets- finite life- to be depreciated ( except land)
• Intangible assets-
• a) Finite life- IPR, Copywright- amortization
17.
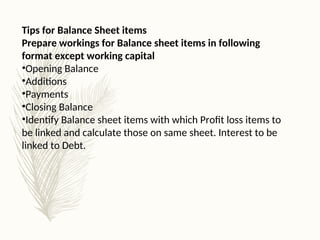
Tips for BalanceSheet items
Prepare workings for Balance sheet items in following
format except working capital
•Opening Balance
•Additions
•Payments
•Closing Balance
•Identify Balance sheet items with which Profit loss items to
be linked and calculate those on same sheet. Interest to be
linked to Debt.
18.
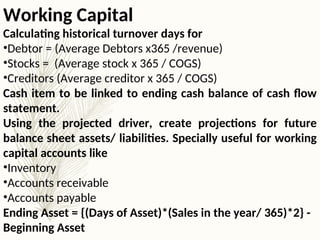
Working Capital
Calculating historicalturnover days for
•Debtor = (Average Debtors x365 /revenue)
•Stocks = (Average stock x 365 / COGS)
•Creditors (Average creditor x 365 / COGS)
Cash item to be linked to ending cash balance of cash flow
statement.
Using the projected driver, create projections for future
balance sheet assets/ liabilities. Specially useful for working
capital accounts like
•Inventory
•Accounts receivable
•Accounts payable
Ending Asset = {(Days of Asset)*(Sales in the year/ 365)*2} -
Beginning Asset
19.
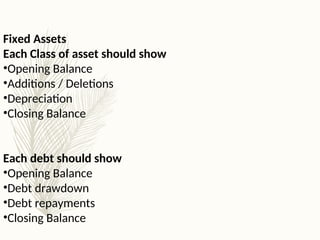
Fixed Assets
Each Classof asset should show
•Opening Balance
•Additions / Deletions
•Depreciation
•Closing Balance
Each debt should show
•Opening Balance
•Debt drawdown
•Debt repayments
•Closing Balance
20.
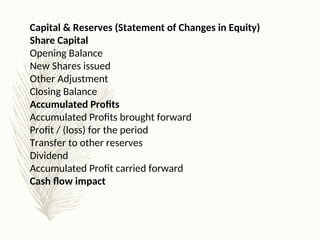
Capital & Reserves(Statement of Changes in Equity)
Share Capital
Opening Balance
New Shares issued
Other Adjustment
Closing Balance
Accumulated Profits
Accumulated Profits brought forward
Profit / (loss) for the period
Transfer to other reserves
Dividend
Accumulated Profit carried forward
Cash flow impact
21.
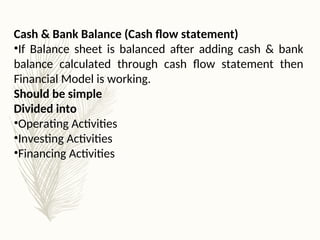
Cash & BankBalance (Cash flow statement)
•If Balance sheet is balanced after adding cash & bank
balance calculated through cash flow statement then
Financial Model is working.
Should be simple
Divided into
•Operating Activities
•Investing Activities
•Financing Activities
22.
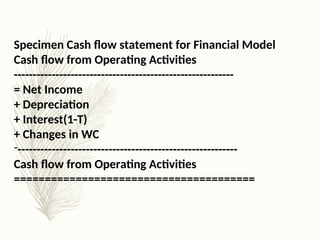
Specimen Cash flowstatement for Financial Model
Cash flow from Operating Activities
----------------------------------------------------------
= Net Income
+ Depreciation
+ Interest(1-T)
+ Changes in WC
-----------------------------------------------------------
Cash flow from Operating Activities
=======================================
23.
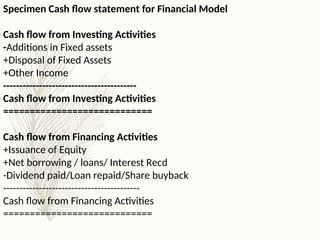
Specimen Cash flowstatement for Financial Model
Cash flow from Investing Activities
-Additions in Fixed assets
+Disposal of Fixed Assets
+Other Income
-----------------------------------------
Cash flow from Investing Activities
============================
Cash flow from Financing Activities
+Issuance of Equity
+Net borrowing / loans/ Interest Recd
-Dividend paid/Loan repaid/Share buyback
------------------------------------------
Cash flow from Financing Activities
============================
24.
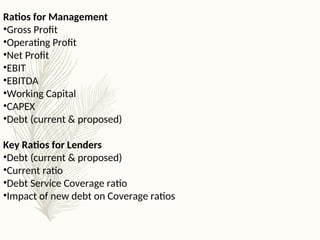
Ratios for Management
•GrossProfit
•Operating Profit
•Net Profit
•EBIT
•EBITDA
•Working Capital
•CAPEX
•Debt (current & proposed)
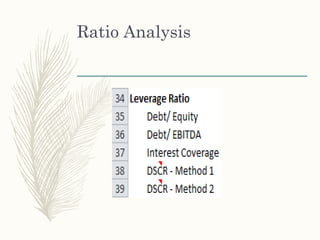
Key Ratios for Lenders
•Debt (current & proposed)
•Current ratio
•Debt Service Coverage ratio
•Impact of new debt on Coverage ratios
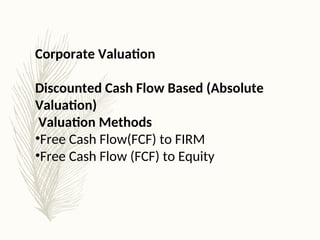
Corporate Valuation
Discounted CashFlow Based (Absolute
Valuation)
Valuation Methods
•Free Cash Flow(FCF) to FIRM
•Free Cash Flow (FCF) to Equity
31.
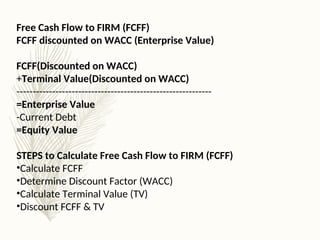
Free Cash Flowto FIRM (FCFF)
FCFF discounted on WACC (Enterprise Value)
FCFF(Discounted on WACC)
+Terminal Value(Discounted on WACC)
------------------------------------------------------------
=Enterprise Value
-Current Debt
=Equity Value
STEPS to Calculate Free Cash Flow to FIRM (FCFF)
•Calculate FCFF
•Determine Discount Factor (WACC)
•Calculate Terminal Value (TV)
•Discount FCFF & TV
32.
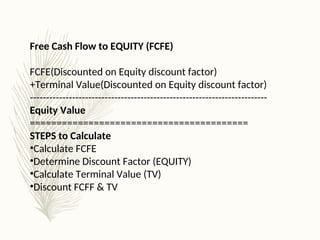
Free Cash Flowto EQUITY (FCFE)
FCFE(Discounted on Equity discount factor)
+Terminal Value(Discounted on Equity discount factor)
-------------------------------------------------------------------------
Equity Value
=========================================
STEPS to Calculate
•Calculate FCFE
•Determine Discount Factor (EQUITY)
•Calculate Terminal Value (TV)
•Discount FCFF & TV
33.
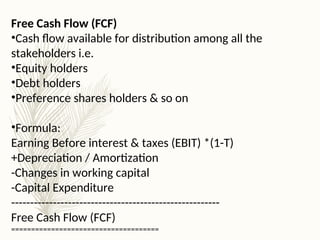
Free Cash Flow(FCF)
•Cash flow available for distribution among all the
stakeholders i.e.
•Equity holders
•Debt holders
•Preference shares holders & so on
•Formula:
Earning Before interest & taxes (EBIT) *(1-T)
+Depreciation / Amortization
-Changes in working capital
-Capital Expenditure
-------------------------------------------------------
Free Cash Flow (FCF)
=====================================
34.
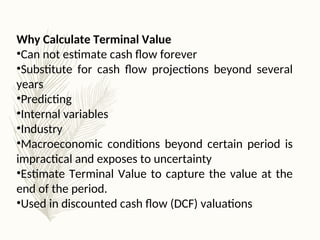
Why Calculate TerminalValue
•Can not estimate cash flow forever
•Substitute for cash flow projections beyond several
years
•Predicting
•Internal variables
•Industry
•Macroeconomic conditions beyond certain period is
impractical and exposes to uncertainty
•Estimate Terminal Value to capture the value at the
end of the period.
•Used in discounted cash flow (DCF) valuations
35.
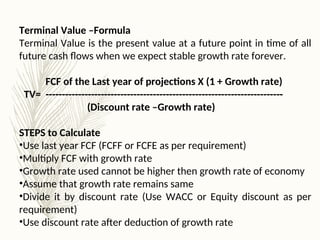
Terminal Value –Formula
TerminalValue is the present value at a future point in time of all
future cash flows when we expect stable growth rate forever.
FCF of the Last year of projections X (1 + Growth rate)
TV= -------------------------------------------------------------------------
(Discount rate –Growth rate)
STEPS to Calculate
•Use last year FCF (FCFF or FCFE as per requirement)
•Multiply FCF with growth rate
•Growth rate used cannot be higher then growth rate of economy
•Assume that growth rate remains same
•Divide it by discount rate (Use WACC or Equity discount as per
requirement)
•Use discount rate after deduction of growth rate
36.
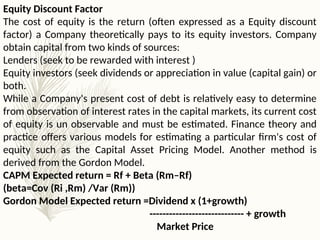
Equity Discount Factor
Thecost of equity is the return (often expressed as a Equity discount
factor) a Company theoretically pays to its equity investors. Company
obtain capital from two kinds of sources:
Lenders (seek to be rewarded with interest )
Equity investors (seek dividends or appreciation in value (capital gain) or
both.
While a Company's present cost of debt is relatively easy to determine
from observation of interest rates in the capital markets, its current cost
of equity is un observable and must be estimated. Finance theory and
practice offers various models for estimating a particular firm's cost of
equity such as the Capital Asset Pricing Model. Another method is
derived from the Gordon Model.
CAPM Expected return = Rf + Beta (Rm–Rf)
(beta=Cov (Ri ,Rm) /Var (Rm))
Gordon Model Expected return =Dividend x (1+growth)
----------------------------- + growth
Market Price
37.
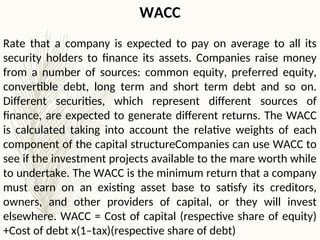
WACC
Rate that acompany is expected to pay on average to all its
security holders to finance its assets. Companies raise money
from a number of sources: common equity, preferred equity,
convertible debt, long term and short term debt and so on.
Different securities, which represent different sources of
finance, are expected to generate different returns. The WACC
is calculated taking into account the relative weights of each
component of the capital structureCompanies can use WACC to
see if the investment projects available to the mare worth while
to undertake. The WACC is the minimum return that a company
must earn on an existing asset base to satisfy its creditors,
owners, and other providers of capital, or they will invest
elsewhere. WACC = Cost of capital (respective share of equity)
+Cost of debt x(1–tax)(respective share of debt)
38.
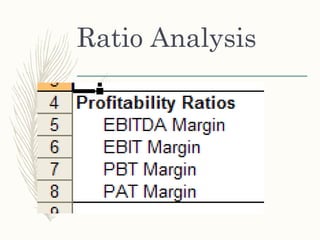
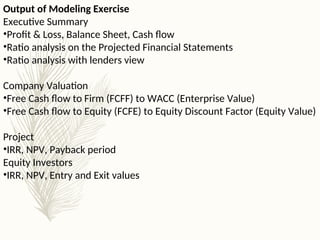
Output of ModelingExercise
Executive Summary
•Profit & Loss, Balance Sheet, Cash flow
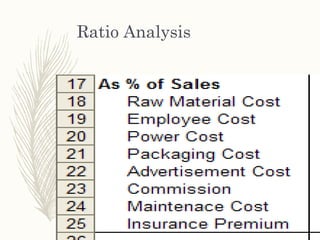
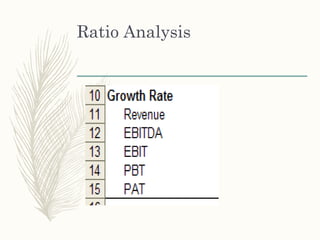
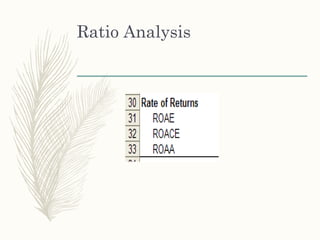
•Ratio analysis on the Projected Financial Statements
•Ratio analysis with lenders view
Company Valuation
•Free Cash flow to Firm (FCFF) to WACC (Enterprise Value)
•Free Cash flow to Equity (FCFE) to Equity Discount Factor (Equity Value)
Project
•IRR, NPV, Payback period
Equity Investors
•IRR, NPV, Entry and Exit values
39.
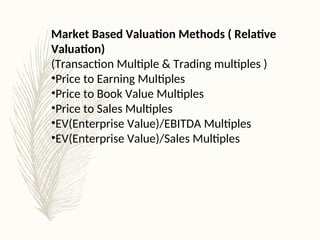
Market Based ValuationMethods ( Relative
Valuation)
(Transaction Multiple & Trading multiples )
•Price to Earning Multiples
•Price to Book Value Multiples
•Price to Sales Multiples
•EV(Enterprise Value)/EBITDA Multiples
•EV(Enterprise Value)/Sales Multiples
40.
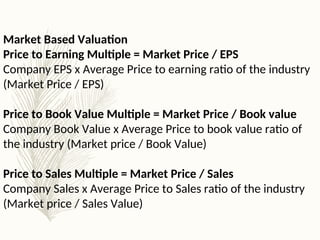
Market Based Valuation
Priceto Earning Multiple = Market Price / EPS
Company EPS x Average Price to earning ratio of the industry
(Market Price / EPS)
Price to Book Value Multiple = Market Price / Book value
Company Book Value x Average Price to book value ratio of
the industry (Market price / Book Value)
Price to Sales Multiple = Market Price / Sales
Company Sales x Average Price to Sales ratio of the industry
(Market price / Sales Value)
41.
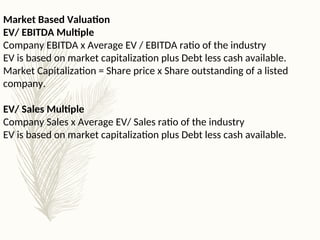
Market Based Valuation
EV/EBITDA Multiple
Company EBITDA x Average EV / EBITDA ratio of the industry
EV is based on market capitalization plus Debt less cash available.
Market Capitalization = Share price x Share outstanding of a listed
company.
EV/ Sales Multiple
Company Sales x Average EV/ Sales ratio of the industry
EV is based on market capitalization plus Debt less cash available.
42.
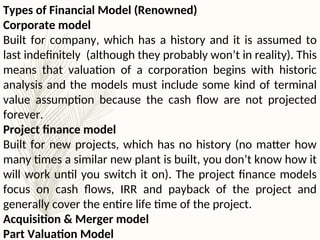
Types of FinancialModel (Renowned)
Corporate model
Built for company, which has a history and it is assumed to
last indefinitely (although they probably won’t in reality). This
means that valuation of a corporation begins with historic
analysis and the models must include some kind of terminal
value assumption because the cash flow are not projected
forever.
Project finance model
Built for new projects, which has no history (no matter how
many times a similar new plant is built, you don’t know how it
will work until you switch it on). The project finance models
focus on cash flows, IRR and payback of the project and
generally cover the entire life time of the project.
Acquisition & Merger model
Part Valuation Model
43.
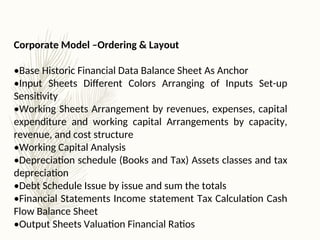
Corporate Model –Ordering& Layout
•Base Historic Financial Data Balance Sheet As Anchor
•Input Sheets Different Colors Arranging of Inputs Set-up
Sensitivity
•Working Sheets Arrangement by revenues, expenses, capital
expenditure and working capital Arrangements by capacity,
revenue, and cost structure
•Working Capital Analysis
•Depreciation schedule (Books and Tax) Assets classes and tax
depreciation
•Debt Schedule Issue by issue and sum the totals
•Financial Statements Income statement Tax Calculation Cash
Flow Balance Sheet
•Output Sheets Valuation Financial Ratios
44.
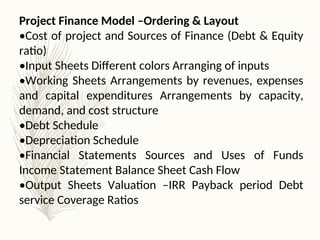
Project Finance Model–Ordering & Layout
•Cost of project and Sources of Finance (Debt & Equity
ratio)
•Input Sheets Different colors Arranging of inputs
•Working Sheets Arrangements by revenues, expenses
and capital expenditures Arrangements by capacity,
demand, and cost structure
•Debt Schedule
•Depreciation Schedule
•Financial Statements Sources and Uses of Funds
Income Statement Balance Sheet Cash Flow
•Output Sheets Valuation –IRR Payback period Debt
service Coverage Ratios
45.
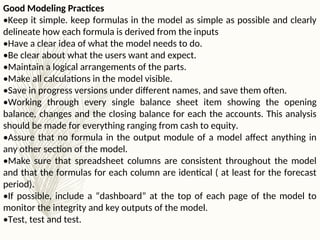
Good Modeling Practices
•Keepit simple. keep formulas in the model as simple as possible and clearly
delineate how each formula is derived from the inputs
•Have a clear idea of what the model needs to do.
•Be clear about what the users want and expect.
•Maintain a logical arrangements of the parts.
•Make all calculations in the model visible.
•Save in progress versions under different names, and save them often.
•Working through every single balance sheet item showing the opening
balance, changes and the closing balance for each the accounts. This analysis
should be made for everything ranging from cash to equity.
•Assure that no formula in the output module of a model affect anything in
any other section of the model.
•Make sure that spreadsheet columns are consistent throughout the model
and that the formulas for each column are identical ( at least for the forecast
period).
•If possible, include a “dashboard” at the top of each page of the model to
monitor the integrity and key outputs of the model.
•Test, test and test.
46.
Happy Modeling
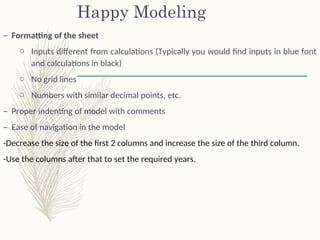
– Formattingof the sheet
o Inputs different from calculations (Typically you would find inputs in blue font
and calculations in black)
o No grid lines
o Numbers with similar decimal points, etc.
– Proper indenting of model with comments
– Ease of navigation in the model
-Decrease the size of the first 2 columns and increase the size of the third column.
-Use the columns after that to set the required years.
47.
Misconceptions about
Valuation
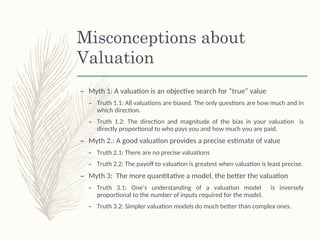
– Myth1: A valuation is an objective search for “true” value
– Truth 1.1: All valuations are biased. The only questions are how much and in
which direction.
– Truth 1.2: The direction and magnitude of the bias in your valuation is
directly proportional to who pays you and how much you are paid.
– Myth 2.: A good valuation provides a precise estimate of value
– Truth 2.1: There are no precise valuations
– Truth 2.2: The payoff to valuation is greatest when valuation is least precise.
– Myth 3: The more quantitative a model, the better the valuation
– Truth 3.1: One’s understanding of a valuation model is inversely
proportional to the number of inputs required for the model.
– Truth 3.2: Simpler valuation models do much better than complex ones.
48.
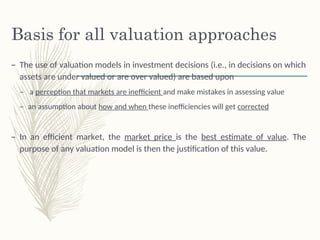
Basis for allvaluation approaches
– The use of valuation models in investment decisions (i.e., in decisions on which
assets are under valued or are over valued) are based upon
– a perception that markets are inefficient and make mistakes in assessing value
– an assumption about how and when these inefficiencies will get corrected
– In an efficient market, the market price is the best estimate of value. The
purpose of any valuation model is then the justification of this value.
49.
Discounted Cash Flow
Valuation
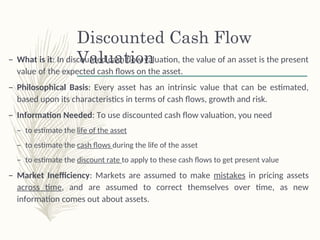
–What is it: In discounted cash flow valuation, the value of an asset is the present
value of the expected cash flows on the asset.
– Philosophical Basis: Every asset has an intrinsic value that can be estimated,
based upon its characteristics in terms of cash flows, growth and risk.
– Information Needed: To use discounted cash flow valuation, you need
– to estimate the life of the asset
– to estimate the cash flows during the life of the asset
– to estimate the discount rate to apply to these cash flows to get present value
– Market Inefficiency: Markets are assumed to make mistakes in pricing assets
across time, and are assumed to correct themselves over time, as new
information comes out about assets.
50.
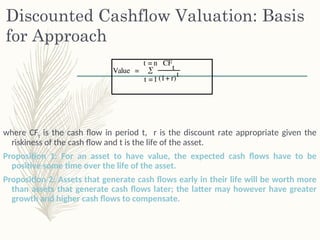
Discounted Cashflow Valuation:Basis
for Approach
where CFt is the cash flow in period t, r is the discount rate appropriate given the
riskiness of the cash flow and t is the life of the asset.
Proposition 1: For an asset to have value, the expected cash flows have to be
positive some time over the life of the asset.
Proposition 2: Assets that generate cash flows early in their life will be worth more
than assets that generate cash flows later; the latter may however have greater
growth and higher cash flows to compensate.
Value =
CF
t
(1+ r)t
t =1
t = n
#47 While we use the cover of numbers and models to obscure the fact, valuation is extraordinarily subjective. Your biases find their way into your valuations.
Every semester, students in my equity valuation class pick companies to value over the semester. A few years ago, I asked students to let me know at the start of the semester what companies they would be valuing and also whether they thought these companies were under or over valued (before they had actually done the valuation). At the end of the semester, I chronicled what they concluded in their quantitative valuations - 88% of those who thought that their companies were under valued at the start of the semester found them to be undervalued, and 82% of those who thought their companies were overvalued found them to be overv alued.
The current debate about conflicts of interest faced by analysts who have to bring in investment banking business or own stock in the companies that they analyze is well chronicled.
Valuation is also inherently imprecise because you are looking at the future. You cannot apply the same tests of precision to valuing a stock that you would to valuing a bond, or within stocks, to valuing a stable utility to valuing a technology company. The imprecise valuation of a risky company may be more valuable than the precise valuation of a stable company.
Finally, adding more inputs may seem costless to those building models, but they are never costless to those using them.
#48 Implicit in most valuation is the assumption that markets make mistakes and that we can find those mistakes by using the right valuation models. An often unstated assumption is that markets will correct their mistakes, resulting in excess returns for investors.
If you do believe that markets are efficient, valuation still may be a useful tool in different contexts:
Valuing private businesses (where there is no market to yield a price)
Valuing the effect of a restructuring or a merger, where the market has not had a chance to react to the changes being considered.
#49 Discounted cash flow valuation is geared for assets that derive their value from the cashflows that they are expected to generate - most businesses and financial assets fall into this category.
The inputs needed for all discounted cash flow models - cash flows, discount rates and asset life - are the same, though the ease with which they can be estimated may vary from asset to asset.
When we use discounted cash flow valuation, we are assuming that we can estimate intrinsic value and that market prices can deviate from intrinsic values. We also assume that prices will revert back to intrinsic value sooner or later - this is why a long time horizon is a pre-requisit.
#50 Cash is king. A firm with negative cash flows today can be a very valuable firm but only if there is reason to believe that cash flows in the future will be large enough to compensate for the negative cash flows today. The riskier a firm and the longer you have to wait for the cash flows, the greater the cashflows eventually have to be….